Special notes of this burst
Image
Pre-slew 15.0-350.0 keV image (Event data)

# RAcent DECcent POSerr Theta Phi Peak Cts SNR Name
79.5506 73.3343 0.0186 11.9447 144.2393 0.2446122 10.251 TRIG_00100815
Foreground time interval of the image:
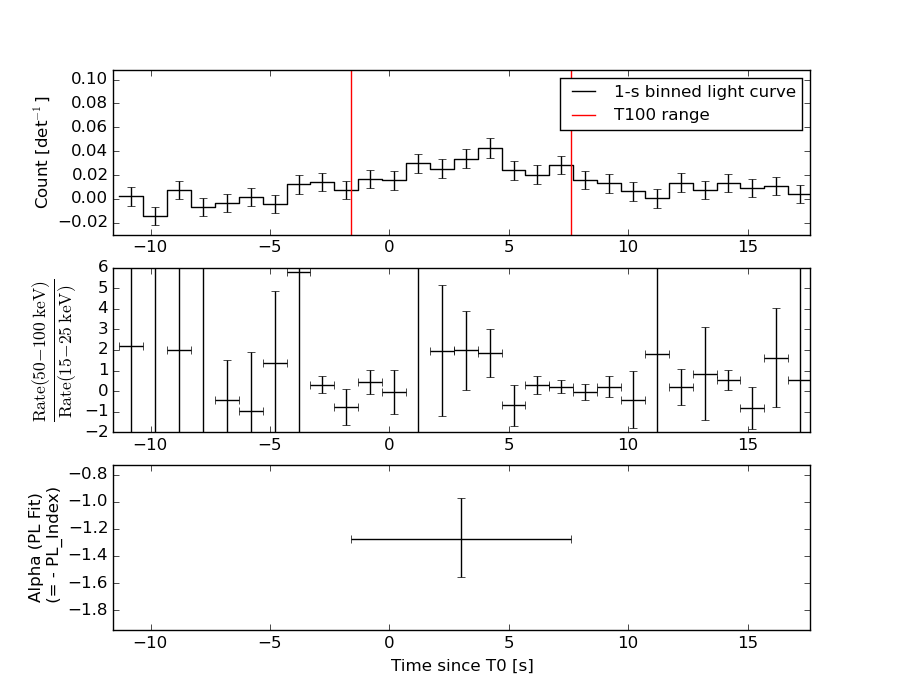
-1.592 7.608 (delta_t = 9.200 [sec])
Background time interval of the image:
-299.304 -1.592 (delta_t = 297.712 [sec])
Lightcurves
Notes:
- 1) The mask-weighted light curves are using the flight position.
- 2) Multiple plots of different time binning/intervals are shown to cover all scenarios of short/long GRBs, rate/image triggers, and real/false positives.
- 3) For all the mask-weighted lightcurves, the y-axis units are counts/sec/det where a det is 0.4 x 0.4 = 0.16 sq cm.
- 4) The verticle lines correspond to following: green dotted lines are T50 interval, black dotted lines are T90 interval, blue solid line(s) is a spacecraft slew start time, and orange solid line(s) is a spacecraft slew end time.
- 5) Time of each bin is in the middle of the bin.
1 s binning
From T0-310 s to T0+310 s
From T100_start - 20 s to T100_end + 30 s
Full time interval

64 ms binning
Full time interval
From T100_start to T100_end
From T0-5 sec to T0+5 sec
16 ms binning
From T100_start-5 s to T100_start+5 s
8 ms binning
From T100_start-3 s to T100_start+3 s
2 ms binning
From T100_start-1 s to T100_start+1 s
SN=5 or 10 sec. binning (whichever binning is satisfied first)
SN=5 or 10 sec. binning (T < 200 sec)
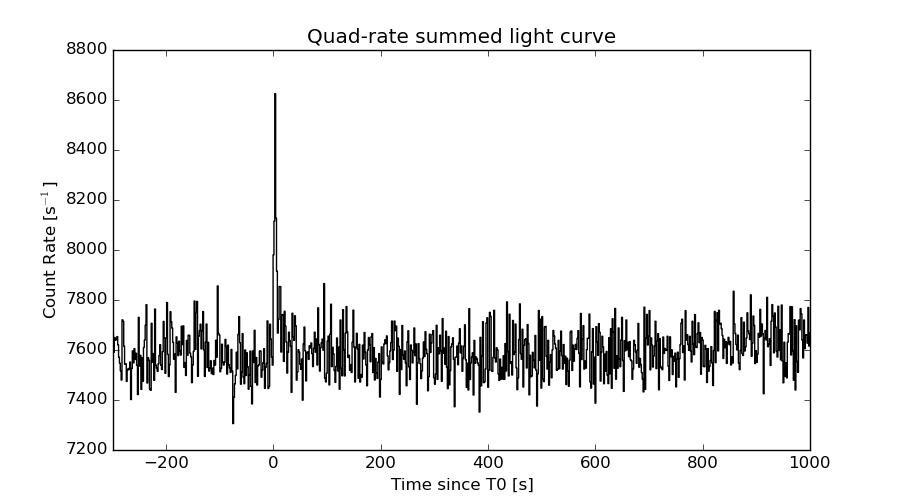
Quad-rate summed light curves (from T0-300s to T0+1000s)
Spectral Evolution
Spectra
Notes:
- 1) The fitting includes the systematic errors.
- 2) When the burst includes telescope slew time periods, the fitting uses an average response file made from multiple 5-s response files through out the slew time plus single time preiod for the non-slew times, and weighted by the total counts in the corresponding time period using addrmf. An average response file is needed becuase a spectral fit using the pre-slew DRM will introduce some errors in both a spectral shape and a normalization if the PHA file contains a lot of the slew/post-slew time interval.
- 3) For fits to more complicated models (e.g. a power-law over a cutoff power-law), the BAT team has decided to require a chi-square improvement of more than 6 for each extra dof.
Time averaged spectrum fit using the average DRM
Power-law model

Time interval is from   -1.592 sec. to    7.608 sec.

Spectral model in power-law:
------------------------------------------------------------
Parameters  : value       lower 90%   higher 90%
Photon index: 1.27154     ( -0.297753   0.285916 )
Norm@50keV  : 1.58473E-03    ( -0.00026055   0.000260241 )
------------------------------------------------------------
#Fit statistic : Chi-Squared =          84.83 using 59 PHA bins.
# Reduced chi-squared =          1.488 for     57 degrees of freedom
# Null hypothesis probability =   9.819137e-03

Photon flux (15-150 keV)    in 9.2 sec: 0.188108 ( -0.0315124  0.0315811 ) ph/cm2/s
Energy fluence (15-150 keV)             : 1.45099e-07 ( -2.66096e-08  2.70821e-08 ) ergs/cm2
Cutoff power-law model

Time interval is from   -1.592 sec. to    7.608 sec.
Spectral model in the cutoff power-law:
------------------------------------------------------------
Parameters  : value       lower 90%   higher 90%
Photon index: 1.23611     (     )
Epeak [keV] : 935.324      (   )
Norm@50keV  : 1.66139E-03    (     )
------------------------------------------------------------
#Fit statistic : Chi-Squared =          84.88 using 59 PHA bins.
# Reduced chi-squared =          1.516 for     56 degrees of freedom
# Null hypothesis probability =   7.655574e-03

Photon flux (15-150 keV)    in 9.2 sec: 0.188142 ( -0.031522  0.031488 ) ph/cm2/s
Energy fluence (15-150 keV)             : 1.44758e-07 ( -3.00978e-08  2.70627e-08 ) ergs/cm2
Band function
Time interval is from   -1.592 sec. to    7.608 sec.

Spectral model in the Band function:
------------------------------------------------------------
Parameters  : value       lower 90%   higher 90%
alpha       : 5.00000   ( -5.27359   -5 )
beta        : -1.61679    ( -0.562896   0.408454 )
Epeak [keV] : 31.5355      ( -9.43863 7.14068 )
Norm@50keV   : 39.2197    ( -6.25611   274.539 )
------------------------------------------------------------
#Fit statistic : Chi-Squared =          80.39 using 59 PHA bins.
# Reduced chi-squared =          1.462 for     55 degrees of freedom
# Null hypothesis probability =   1.441271e-02

Photon flux (15-150 keV)    in 9.2 sec:  (    ) ph/cm2/s
Energy fluence (15-150 keV)             : 0 ( 0  0 ) ergs/cm2
Single BB
Spectral model blackbody:
------------------------------------------------------------
Parameters  : value    Lower 90%  Upper 90%
kT [keV]    : 13.0844  (-2.3908  3.49857)
R^2/D10^2   : 3.51129E-02  (-0.0198778   0.0371468)
(R is the radius in km and D10 is the distance to the source in units of 10 kpc)
------------------------------------------------------------
#Fit statistic : Chi-Squared =          92.44 using 59 PHA bins.
# Reduced chi-squared =          1.622 for     57 degrees of freedom
# Null hypothesis probability =   2.073166e-03

Energy  Fluence     90% Error
[keV]   [erg/cm2]   [erg/cm2]
15- 25  1.173e-08   3.843e-09
25- 50  4.068e-08   1.153e-08
50-150  4.419e-08   1.810e-08
15-150  9.660e-08   2.641e-08
Thermal bremsstrahlung (OTTB)
Spectral model: thermal bremsstrahlung
------------------------------------------------------------
Parameters  : value         Lower 90%    Upper 90%
kT [keV]    : 200.000       (      )
Norm        : 0.776845       (-0.128762     0.128755)
------------------------------------------------------------
#Fit statistic : Chi-Squared =          87.17 using 59 PHA bins.
# Reduced chi-squared =          1.529 for     57 degrees of freedom
# Null hypothesis probability =   6.197190e-03

Energy  Fluence     90% Error
[keV]   [erg/cm2]   [erg/cm2]
15- 25  1.780e-08   1.032e-08
25- 50  3.424e-08   1.931e-08
50-150  7.508e-08   4.253e-08
15-150  1.271e-07   7.199e-08
Double BB
Spectral model: bbodyrad<1> + bbodyrad<2>
------------------------------------------------------------
Parameters  : value         Lower 90%    Upper 90%
kT1 [keV]   : 9.76910        (-1.70566      1.75427)
R1^2/D10^2  : 8.23857E-02        (-0.0398982      0.0843185)
kT2 [keV]   : 198.888        (-142.977      -198.957)
R2^2/D10^2  : 3.37032E-05    (-1.17807e-05   0.000264844)
------------------------------------------------------------
#Fit statistic : Chi-Squared =          74.58 using 59 PHA bins.
# Reduced chi-squared =          1.356 for     55 degrees of freedom
# Null hypothesis probability =   4.057583e-02

Energy  Fluence     90% Error
[keV]   [erg/cm2]   [erg/cm2]
15- 25  1.500e-08   7.887e-09
25- 50  3.849e-08   2.049e-08
50-150  9.897e-08   4.026e-08
15-150  1.525e-07   4.661e-08
Peak spectrum fit
Power-law model
Time interval is from    3.300 sec. to    4.300 sec.

Spectral model in power-law:
------------------------------------------------------------
Parameters  : value       lower 90%   higher 90%
Photon index: 1.22973     ( -0.477737   0.460646 )
Norm@50keV  : 2.93011E-03    ( -0.000811603   0.000810468 )
------------------------------------------------------------
#Fit statistic : Chi-Squared =          74.47 using 59 PHA bins.
# Reduced chi-squared =          1.306 for     57 degrees of freedom
# Null hypothesis probability =   6.001742e-02

Photon flux (15-150 keV)    in 1 sec: 0.345444 ( -0.0967994  0.097199 ) ph/cm2/s
Energy fluence (15-150 keV)             : 2.94824e-08 ( -8.97426e-09  9.26265e-09 ) ergs/cm2
Cutoff power-law model
Time interval is from    3.300 sec. to    4.300 sec.
Spectral model in the cutoff power-law:
------------------------------------------------------------
Parameters  : value       lower 90%   higher 90%
Photon index: 7.34194E-02     ( -3.36366   1.51065 )
Epeak [keV] : 81.9517      (   )
Norm@50keV  : 1.13727E-02    (     )
------------------------------------------------------------
#Fit statistic : Chi-Squared =          73.41 using 59 PHA bins.
# Reduced chi-squared =          1.311 for     56 degrees of freedom
# Null hypothesis probability =   5.918275e-02

Photon flux (15-150 keV)    in 1 sec: 0.329500 ( -0.100594  0.051202 ) ph/cm2/s
Energy fluence (15-150 keV)             : 2.65904e-08 ( -9.8219e-09  1.04763e-08 ) ergs/cm2
Band function
Time interval is from    3.300 sec. to    4.300 sec.

Spectral model in the Band function:
------------------------------------------------------------
Parameters  : value       lower 90%   higher 90%
alpha       : 4.91618   ( -6.32551   -4.91618 )
beta        : -1.54797    ( -0.95225   0.609878 )
Epeak [keV] : 32.5657      ( -32.5657 14.7903 )
Norm@50keV   : 50.6134    ( -13.616   1.04747e+06 )
------------------------------------------------------------
#Fit statistic : Chi-Squared =          72.56 using 59 PHA bins.
# Reduced chi-squared =          1.319 for     55 degrees of freedom
# Null hypothesis probability =   5.645864e-02

Photon flux (15-150 keV)    in 1 sec:  (    ) ph/cm2/s
Energy fluence (15-150 keV)             : 2.81768e-08 ( 0  0 ) ergs/cm2
Single BB
Spectral model blackbody:
------------------------------------------------------------
Parameters  : value    Lower 90%  Upper 90%
kT [keV]    : 16.2098  (-4.56105  7.41843)
R^2/D10^2   : 3.23248E-02  (-0.0323248   0.0678401)
(R is the radius in km and D10 is the distance to the source in units of 10 kpc)
------------------------------------------------------------
#Fit statistic : Chi-Squared =          74.32 using 59 PHA bins.
# Reduced chi-squared =          1.304 for     57 degrees of freedom
# Null hypothesis probability =   6.139259e-02

Energy  Fluence     90% Error
[keV]   [erg/cm2]   [erg/cm2]
15- 25  1.751e-09   1.096e-09
25- 50  7.450e-09   4.465e-09
50-150  1.375e-08   8.608e-09
15-150  2.295e-08   1.287e-08
Thermal bremsstrahlung (OTTB)
Spectral model: thermal bremsstrahlung
------------------------------------------------------------
Parameters  : value         Lower 90%    Upper 90%
kT [keV]    : 199.361       (-108.044      -199.362)
Norm        : 1.42568       (-0.39767     0.398561)
------------------------------------------------------------
#Fit statistic : Chi-Squared =          75.22 using 59 PHA bins.
# Reduced chi-squared =          1.320 for     57 degrees of freedom
# Null hypothesis probability =   5.329636e-02

Energy  Fluence     90% Error
[keV]   [erg/cm2]   [erg/cm2]
15- 25  3.550e-09   2.170e-09
25- 50  6.829e-09   4.120e-09
50-150  1.498e-08   9.070e-09
15-150  2.536e-08   1.541e-08
Double BB
Spectral model: bbodyrad<1> + bbodyrad<2>
------------------------------------------------------------
Parameters  : value         Lower 90%    Upper 90%
kT1 [keV]   : 11.1452        (-11.1457      5.0925)
R1^2/D10^2  : 8.03088E-02        (-0.0803049      -0.0803049)
kT2 [keV]   : 38.0279        (-38.0405      -38.0405)
R2^2/D10^2  : 1.17317E-03    (-0.00117226   0.0730743)
------------------------------------------------------------
#Fit statistic : Chi-Squared =          73.07 using 59 PHA bins.
# Reduced chi-squared =          1.329 for     55 degrees of freedom
# Null hypothesis probability =   5.198244e-02

Energy  Fluence     90% Error
[keV]   [erg/cm2]   [erg/cm2]
15- 25  2.316e-09   1.565e-09
25- 50  7.533e-09   5.760e-09
50-150  1.793e-08   1.031e-08
15-150  2.778e-08   1.612e-08
Pre-slew spectrum (Pre-slew PHA with pre-slew DRM)
Power-law model

Spectral model in power-law:
------------------------------------------------------------
Parameters  : value       lower 90%   higher 90%
Photon index: 1.27154     ( -0.297753   0.285916 )
Norm@50keV  : 1.58473E-03    ( -0.00026055   0.000260241 )
------------------------------------------------------------
#Fit statistic : Chi-Squared =          84.83 using 59 PHA bins.
# Reduced chi-squared =          1.488 for     57 degrees of freedom
# Null hypothesis probability =   9.819137e-03

Photon flux (15-150 keV)    in 9.2 sec: 0.188108 ( -0.0315124  0.0315811 ) ph/cm2/s
Energy fluence (15-150 keV)             : 1.45099e-07 ( -2.66096e-08  2.70821e-08 ) ergs/cm2
Cutoff power-law model
Spectral model in the cutoff power-law:
------------------------------------------------------------
Parameters  : value       lower 90%   higher 90%
Photon index: 1.23611     (     )
Epeak [keV] : 935.324      (   )
Norm@50keV  : 1.66139E-03    (     )
------------------------------------------------------------
#Fit statistic : Chi-Squared =          84.88 using 59 PHA bins.
# Reduced chi-squared =          1.516 for     56 degrees of freedom
# Null hypothesis probability =   7.655574e-03

Photon flux (15-150 keV)    in 9.2 sec: 0.188142 ( -0.031522  0.031488 ) ph/cm2/s
Energy fluence (15-150 keV)             : 1.44758e-07 ( -3.00978e-08  2.70627e-08 ) ergs/cm2
Band function

Spectral model in the Band function:
------------------------------------------------------------
Parameters  : value       lower 90%   higher 90%
alpha       : 5.00000   ( -5.27824   -5 )
beta        : -1.61679    ( -0.562896   0.408454 )
Epeak [keV] : 31.5355      ( -9.43863 7.14068 )
Norm@50keV   : 39.2197    ( -6.25611   274.539 )
------------------------------------------------------------
#Fit statistic : Chi-Squared =          80.39 using 59 PHA bins.
# Reduced chi-squared =          1.462 for     55 degrees of freedom
# Null hypothesis probability =   1.441271e-02

Photon flux (15-150 keV)    in 9.2 sec:  (    ) ph/cm2/s
Energy fluence (15-150 keV)             : 0 ( 0  0 ) ergs/cm2
S(25-50 keV) vs. S(50-100 keV) plot
S(25-50 keV)  = 3.18e-08
S(50-100 keV) = 5.27e-08
T90 vs. Hardness ratio plot
T90                                   = 8.2960000038147 sec.
Hardness ratio (energy fluence ratio) = 1.65723
Color vs. Color plot
Count Ratio  (25-50 keV) / (15-25 keV) = 1.82817
Count Ratio (50-100 keV) / (15-25 keV) = 0.79625
Mask shadow pattern
IMX = -1.716635139722556E-01, IMY = -1.236286553707032E-01
TIME vs. PHA plot around the trigger time
TIME vs. DetID plot around the trigger time
100 us light curve (15-350 keV)
Spacecraft aspect plot
Bright source in the pre-burst/pre-slew/post-slew images
Pre-burst image of 15-350 keV band
Time interval of the image:
-299.304000 -1.592000

# RAcent  DECcent POSerr Theta    Phi  PeakCts   SNR AngSep     Name
#  [deg]    [deg]    ['] [deg]  [deg]                   [']
 93.9767  41.0617    2.7  39.8   95.5   3.2081   4.3 ------	UNKNOWN
 53.7211  53.1709    0.3  34.8  144.5  13.5811  41.3 ------	UNKNOWN
323.1935  56.2820    2.9  44.4 -136.5   1.5351   4.0 ------	UNKNOWN
236.3190  55.2253    3.6  39.9  -66.3   1.8225   3.2 ------	UNKNOWN
Pre-slew background subtracted image of 15-350 keV band
Time interval of the image:
-1.592000 7.608000

# RAcent  DECcent POSerr Theta    Phi  PeakCts   SNR AngSep     Name
#  [deg]    [deg]    ['] [deg]  [deg]                   [']
 79.5505  73.3343    1.1  11.9  144.2   0.2445  10.2 ------	UNKNOWN
Post-slew image of 15-350 keV band
Time interval of the image:
Plot creation:
Thu Jun 25 15:58:59 EDT 2015