Estimated redshift from machine learning (Ukwatta et al. 2016) - may take a few minute to calcaulte
Image
Pre-slew 15.0-350.0 keV image (Event data)

#   RAcent    DECcent   POSerr    Theta     Phi              Peak Cts       SNR   Name
  223.0905    26.7169   0.0221    24.8439  -171.8619         0.3492565      8.709 TRIG_01009679

Foreground time interval of the image:
 -0.440   8.736 (delta_t =   9.176 [sec])
Background time interval of the image:
-239.384  -0.440 (delta_t = 238.944 [sec])
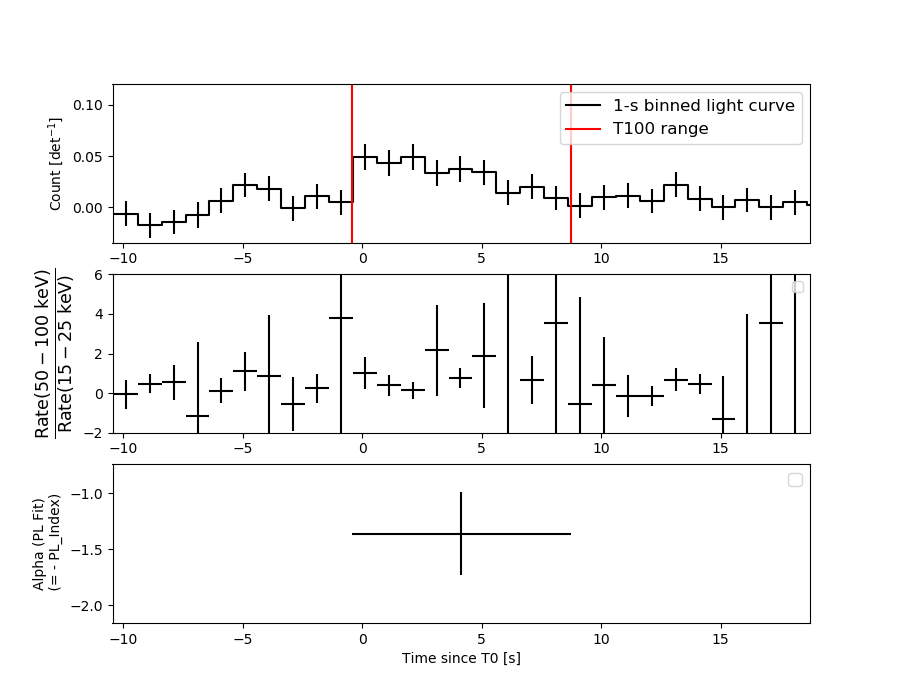
Lightcurves
Notes:
- 1) The mask-weighted light curves are using the flight position.
- 2) Multiple plots of different time binning/intervals are shown to cover all scenarios of short/long GRBs, rate/image triggers, and real/false positives.
- 3) For all the mask-weighted lightcurves, the y-axis units are counts/sec/det where a det is 0.4 x 0.4 = 0.16 sq cm.
- 4) The verticle lines correspond to following: green dotted lines are T50 interval, black dotted lines are T90 interval, blue solid line(s) is a spacecraft slew start time, and orange solid line(s) is a spacecraft slew end time.
- 5) Time of each bin is in the middle of the bin.
1 s binning
From T0-310 s to T0+310 s

From T100_start - 20 s to T100_end + 30 s

Full time interval
64 ms binning
Full time interval
From T100_start to T100_end
From T0-5 sec to T0+5 sec
16 ms binning
From T100_start-5 s to T100_start+5 s

Blue+Cyan dotted lines: Time interval of the scaled map
From 0.000000 to 5.504000
8 ms binning
From T100_start-3 s to T100_start+3 s
Blue+Cyan dotted lines: Time interval of the scaled map
From 0.000000 to 5.504000
2 ms binning
From T100_start-1 s to T100_start+1 s

Blue+Cyan dotted lines: Time interval of the scaled map
From 0.000000 to 5.504000
SN=5 or 10 sec. binning (whichever binning is satisfied first)
SN=5 or 10 sec. binning (T < 200 sec)
Quad-rate summed light curves (from T0-300s to T0+1000s)

Spectral Evolution
Spectra
Notes:
- 1) The fitting includes the systematic errors.
- 2) When the burst includes telescope slew time periods, the fitting uses an average response file made from multiple 5-s response files through out the slew time plus single time preiod for the non-slew times, and weighted by the total counts in the corresponding time period using addrmf. An average response file is needed becuase a spectral fit using the pre-slew DRM will introduce some errors in both a spectral shape and a normalization if the PHA file contains a lot of the slew/post-slew time interval.
- 3) For fits to more complicated models (e.g. a power-law over a cutoff power-law), the BAT team has decided to require a chi-square improvement of more than 6 for each extra dof.
Time averaged spectrum fit using the average DRM
Power-law model

Time interval is from   -0.440 sec. to    8.736 sec.

Spectral model in power-law:
------------------------------------------------------------
Parameters  : value       lower 90%   higher 90%
Photon index: 1.36219     ( -0.372877   0.365421 )
Norm@50keV  : 2.19402E-03    ( -0.000435703   0.000432124 )
------------------------------------------------------------
#Fit statistic  : Chi-Squared                   49.58     using 59 bins.
 Reduced chi-squared = 0.869825
# Null hypothesis probability of 7.47e-01 with 57 degrees of freedom

Photon flux (15-150 keV)    in 9.176 sec: 0.264990 ( -0.052567  0.052732 ) ph/cm2/s
Energy fluence (15-150 keV)             : 1.96125e-07 ( -4.3687e-08  4.45069e-08 ) ergs/cm2
Cutoff power-law model

Time interval is from   -0.440 sec. to    8.736 sec.
Spectral model in the cutoff power-law:
------------------------------------------------------------
Parameters  : value       lower 90%   higher 90%
Photon index: 2.61222     ( -1.79551   1.24416 )
Epeak [keV] : 193.925      (   )
Norm@50keV  : 4.52697E-04    (     )
------------------------------------------------------------
#Fit statistic  : Chi-Squared                   48.61     using 59 bins.
 Reduced chi-squared = 0.868036
# Null hypothesis probability of 7.48e-01 with 56 degrees of freedom

Photon flux (15-150 keV)    in 9.176 sec: 0.264986 ( -0.05266  0.052679 ) ph/cm2/s
Energy fluence (15-150 keV)             : 1.97767e-07 ( -5.68691e-08  5.48973e-08 ) ergs/cm2
Band function

Time interval is from   -0.440 sec. to    8.736 sec.


Spectral model in the Band function:
------------------------------------------------------------
Parameters  : value       lower 90%   higher 90%
alpha       :    (     )
beta        :     (     )
Epeak [keV] :       (   )
Norm@50keV   :     (     )
------------------------------------------------------------

Photon flux (15-150 keV)    in  sec:  (    ) ph/cm2/s
Energy fluence (15-150 keV)             : 0 ( 0  0 ) ergs/cm2
Single BB
Spectral model blackbody:
------------------------------------------------------------
Parameters  : value    Lower 90%  Upper 90%
kT [keV]    : 13.6174  (-3.75711  7.27947)
R^2/D10^2   : 4.07425E-02  (-0.0401695   0.0867627)
(R is the radius in km and D10 is the distance to the source in units of 10 kpc)
------------------------------------------------------------
#Fit statistic  : Chi-Squared                   61.14     using 59 bins.
 Reduced chi-squared =
# Null hypothesis probability of 3.30e-01 with 57 degrees of freedom

Energy  Fluence     90% Error
[keV]   [erg/cm2]   [erg/cm2]
15- 25  1.468e-08   6.548e-09
25- 50  5.308e-08   1.977e-08
50-150  6.387e-08   3.010e-08
15-150  1.316e-07   4.845e-08
Thermal bremsstrahlung (OTTB)
Spectral model: thermal bremsstrahlung
------------------------------------------------------------
Parameters  : value         Lower 90%    Upper 90%
kT [keV]    : 199.362       (-92.3541      -199.363)
Norm        : 1.08689       (-0.213576     0.213572)
------------------------------------------------------------
#Fit statistic  : Chi-Squared                   51.05     using 59 bins.
 Reduced chi-squared =
# Null hypothesis probability of 6.97e-01 with 57 degrees of freedom

Energy  Fluence     90% Error
[keV]   [erg/cm2]   [erg/cm2]
15- 25  2.483e-08   1.459e-08
25- 50  4.777e-08   2.782e-08
50-150  1.048e-07   5.909e-08
15-150  1.774e-07   1.034e-07
Double BB
Spectral model: bbodyrad<1> + bbodyrad<2>
------------------------------------------------------------
Parameters  : value         Lower 90%    Upper 90%
kT1 [keV]   : 8.34120        (-2.37769      2.90437)
R1^2/D10^2  : 0.189075        (-0.121887      0.345376)
kT2 [keV]   : 89.8531        (-94.3108      -94.3111)
R2^2/D10^2  : 1.74049E-04    (-0.000113731   0.00197305)
------------------------------------------------------------
#Fit statistic  : Chi-Squared                   46.10     using 59 bins.
 Reduced chi-squared =
# Null hypothesis probability of 7.98e-01 with 55 degrees of freedom

Energy  Fluence     90% Error
[keV]   [erg/cm2]   [erg/cm2]
15- 25  2.334e-08   1.350e-08
25- 50  4.912e-08   2.939e-08
50-150  1.409e-07   9.497e-08
15-150  2.133e-07   1.414e-07
Peak spectrum fit
Power-law model
Time interval is from    4.208 sec. to    5.208 sec.

Spectral model in power-law:
------------------------------------------------------------
Parameters  : value       lower 90%   higher 90%
Photon index: 1.24895     ( -0.703693   0.627083 )
Norm@50keV  : 3.80841E-03    ( -0.00126052   0.00126038 )
------------------------------------------------------------
#Fit statistic  : Chi-Squared                   45.19     using 59 bins.
 Reduced chi-squared = 0.792807
# Null hypothesis probability of 8.71e-01 with 57 degrees of freedom

Photon flux (15-150 keV)    in 1 sec: 0.450357 ( -0.154871  0.155536 ) ph/cm2/s
Energy fluence (15-150 keV)             : 3.81294e-08 ( -1.39085e-08  1.42536e-08 ) ergs/cm2
Cutoff power-law model

Time interval is from    4.208 sec. to    5.208 sec.
Spectral model in the cutoff power-law:
------------------------------------------------------------
Parameters  : value       lower 90%   higher 90%
Photon index: 2.17547     ( -1.10426   0.615329 )
Epeak [keV] : 62.6657      ( -9999.36 -9999.36 )
Norm@50keV  : 1.04367E-03    ( -0.00103916   0.0154383 )
------------------------------------------------------------
#Fit statistic  : Chi-Squared                   44.93     using 59 bins.
 Reduced chi-squared = 0.802321
# Null hypothesis probability of 8.56e-01 with 56 degrees of freedom

Photon flux (15-150 keV)    in 1 sec: 0.451860 ( -0.157227  0.154811 ) ph/cm2/s
Energy fluence (15-150 keV)             : 3.86322e-08 ( -1.44971e-08  1.38111e-08 ) ergs/cm2
Band function

Time interval is from    4.208 sec. to    5.208 sec.


Spectral model in the Band function:
------------------------------------------------------------
Parameters  : value       lower 90%   higher 90%
alpha       :    (     )
beta        :     (     )
Epeak [keV] :       (   )
Norm@50keV   :     (     )
------------------------------------------------------------

Photon flux (15-150 keV)    in  sec:  (    ) ph/cm2/s
Energy fluence (15-150 keV)             : 0 ( 0  0 ) ergs/cm2
Single BB
Spectral model blackbody:
------------------------------------------------------------
Parameters  : value    Lower 90%  Upper 90%
kT [keV]    : 17.7590  (-9.78546  34.3503)
R^2/D10^2   : 2.80425E-02  (-0.0262894   0.40408)
(R is the radius in km and D10 is the distance to the source in units of 10 kpc)
------------------------------------------------------------
#Fit statistic  : Chi-Squared                   49.94     using 59 bins.
 Reduced chi-squared =
# Null hypothesis probability of 7.35e-01 with 57 degrees of freedom

Energy  Fluence     90% Error
[keV]   [erg/cm2]   [erg/cm2]
15- 25  1.778e-09   1.184e-09
25- 50  8.141e-09   5.035e-09
50-150  1.857e-08   1.324e-08
15-150  2.849e-08   1.779e-08
Thermal bremsstrahlung (OTTB)
Spectral model: thermal bremsstrahlung
------------------------------------------------------------
Parameters  : value         Lower 90%    Upper 90%
kT [keV]    : 199.363       (-199.363      -199.363)
Norm        : 1.86648       (-0.62985     0.629867)
------------------------------------------------------------
#Fit statistic  : Chi-Squared                   46.12     using 59 bins.
 Reduced chi-squared =
# Null hypothesis probability of 8.48e-01 with 57 degrees of freedom

Energy  Fluence     90% Error
[keV]   [erg/cm2]   [erg/cm2]
15- 25  4.648e-09   2.917e-09
25- 50  8.940e-09   5.590e-09
50-150  1.961e-08   1.211e-08
15-150  3.320e-08   2.136e-08
Double BB

Spectral model: bbodyrad<1> + bbodyrad<2>
------------------------------------------------------------
Parameters  : value         Lower 90%    Upper 90%
kT1 [keV]   : 7.66551        (-3.55071      4.05214)
R1^2/D10^2  : 0.422029        (-0.329303      2.5593)
kT2 [keV]   : 70.1574        (-36.3348      -58.8551)
R2^2/D10^2  : 5.32543E-04    (-0.000440536   0.00995797)
------------------------------------------------------------
#Fit statistic  : Chi-Squared                   43.28     using 59 bins.
 Reduced chi-squared =
# Null hypothesis probability of 8.74e-01 with 55 degrees of freedom

Energy  Fluence     90% Error
[keV]   [erg/cm2]   [erg/cm2]
15- 25  4.730e-09   2.871e-09
25- 50  9.154e-09   5.540e-09
50-150  2.753e-08   6.900e-09
15-150  4.141e-08   1.710e-08
Pre-slew spectrum (Pre-slew PHA with pre-slew DRM)
Power-law model
Spectral model in power-law:
------------------------------------------------------------
Parameters  : value       lower 90%   higher 90%
Photon index: 1.36219     ( -0.372877   0.365421 )
Norm@50keV  : 2.19402E-03    ( -0.000435703   0.000432124 )
------------------------------------------------------------
#Fit statistic  : Chi-Squared                   49.58     using 59 bins.
 Reduced chi-squared =
# Null hypothesis probability of 7.47e-01 with 57 degrees of freedom

Photon flux (15-150 keV)    in 9.176 sec: 0.264986 ( -0.0525653  0.0527299 ) ph/cm2/s
Energy fluence (15-150 keV)             : 1.96101e-07 ( -4.36819e-08  4.45419e-08 ) ergs/cm2
Cutoff power-law model
Spectral model in the cutoff power-law:
------------------------------------------------------------
Parameters  : value       lower 90%   higher 90%
Photon index: 1.37365     ( -0.388909   0.354327 )
Epeak [keV] : 9999.32      ( -9999.36 -9999.36 )
Norm@50keV  : 2.19823E-03    ( -0.000430641   0.00318986 )
------------------------------------------------------------
#Fit statistic  : Chi-Squared                   49.59     using 59 bins.
 Reduced chi-squared =
# Null hypothesis probability of 7.14e-01 with 56 degrees of freedom

Photon flux (15-150 keV)    in 9.176 sec: 0.265750 ( -0.053315  0.052012 ) ph/cm2/s
Energy fluence (15-150 keV)             : 1.95653e-07 ( -4.32621e-08  4.48505e-08 ) ergs/cm2
Band function

Spectral model in the Band function:
------------------------------------------------------------
Parameters  : value       lower 90%   higher 90%
alpha       :    (     )
beta        :     (     )
Epeak [keV] :       (   )
Norm@50keV   :     (     )
------------------------------------------------------------

Photon flux (15-150 keV)    in  sec:  (    ) ph/cm2/s
Energy fluence (15-150 keV)             : 0 ( 0  0 ) ergs/cm2
S(25-50 keV) vs. S(50-100 keV) plot
S(25-50 keV)  = 4.51e-08
S(50-100 keV) = 7.03e-08
T90 vs. Hardness ratio plot

T90                                   = 8.52400004863739 sec.
Hardness ratio (energy fluence ratio) = 1.55876
Color vs. Color plot
Count Ratio  (25-50 keV) / (15-25 keV) = 1.43623
Count Ratio (50-100 keV) / (15-25 keV) = 1.01118
Mask shadow pattern
IMX = -4.583320075648246E-01, IMY = 6.554112632781912E-02
TIME vs. PHA plot around the trigger time
Blue+Cyan dotted lines: Time interval of the scaled map
From 0.000000 to 5.504000
TIME vs. DetID plot around the trigger time
Blue+Cyan dotted lines: Time interval of the scaled map
From 0.000000 to 5.504000
100 us light curve (15-350 keV)

Blue+Cyan dotted lines: Time interval of the scaled map
From 0.000000 to 5.504000
Spacecraft aspect plot
Bright source in the pre-burst/pre-slew/post-slew images
Pre-burst image of 15-350 keV band
Time interval of the image:
-239.384000 -0.440000

# RAcent  DECcent POSerr Theta    Phi  PeakCts   SNR AngSep     Name
#  [deg]    [deg]    ['] [deg]  [deg]                   [']
254.3969  35.4237    7.8  52.7 -166.8   1.2139   1.5    5.7	Her X-1
237.9082  16.4702    2.2  34.8 -143.2   1.9068   5.3 ------	UNKNOWN
244.6102  -1.4901    3.5  43.9 -116.3   3.8862   3.3 ------	UNKNOWN
Pre-slew background subtracted image of 15-350 keV band
Time interval of the image:
-0.440000 8.736000

# RAcent  DECcent POSerr Theta    Phi  PeakCts   SNR AngSep     Name
#  [deg]    [deg]    ['] [deg]  [deg]                   [']
254.4786  35.3600    5.2  52.8 -166.7   0.2497   2.2    1.5	Her X-1
223.0906  26.7168    1.3  24.8 -171.9   0.3491   8.7 ------	UNKNOWN
Post-slew image of 15-350 keV band
Time interval of the image:
110.516600 772.716600

# RAcent  DECcent POSerr Theta    Phi  PeakCts   SNR AngSep     Name
#  [deg]    [deg]    ['] [deg]  [deg]                   [']
254.4617  35.3839    1.5  28.1  179.9   4.5749   7.6    2.5	Her X-1
169.7717  28.2831    3.4  47.0   40.6   5.3922   3.4 ------	UNKNOWN
284.7675  30.1457    2.4  53.7 -173.5   8.3215   4.8 ------	UNKNOWN
258.6299  15.7051    3.4  34.7 -143.2   2.4669   3.4 ------	UNKNOWN
282.0323  17.8586    2.9  54.8 -158.1   7.9210   4.0 ------	UNKNOWN
205.7489 -20.5093    2.7  50.1  -42.9   9.9726   4.3 ------	UNKNOWN
214.5962 -19.5393    3.2  46.9  -53.3   7.9843   3.6 ------	UNKNOWN
Plot creation:
Sat Jul 30 07:25:25 EDT 2022