Special notes of this burst
Image
Pre-slew 15.0-350.0 keV image (Event data)
#   RAcent    DECcent   POSerr    Theta     Phi              Peak Cts       SNR   Name
  336.6496     5.0273   0.0053    45.5732  -169.4404         5.8297083     36.063 TRIG_00100970

Foreground time interval of the image:
 -2.736  70.700 (delta_t =  73.436 [sec])
Background time interval of the image:
-299.472  -2.736 (delta_t = 296.736 [sec])
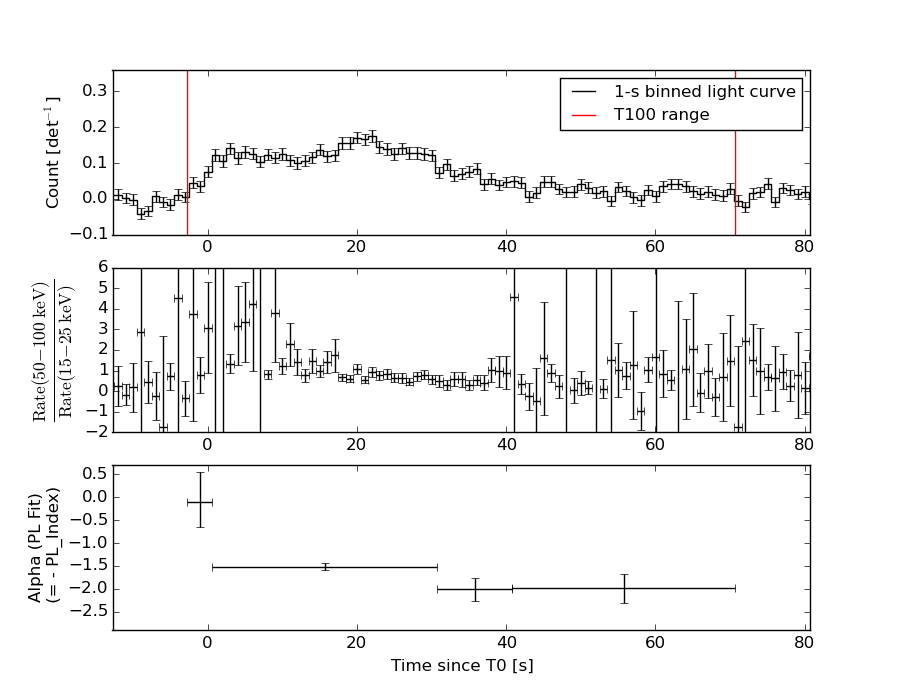
Lightcurves
Notes:
- 1) The mask-weighted light curves are using the flight position.
- 2) Multiple plots of different time binning/intervals are shown to cover all scenarios of short/long GRBs, rate/image triggers, and real/false positives.
- 3) For all the mask-weighted lightcurves, the y-axis units are counts/sec/det where a det is 0.4 x 0.4 = 0.16 sq cm.
- 4) The verticle lines correspond to following: green dotted lines are T50 interval, black dotted lines are T90 interval, blue solid line(s) is a spacecraft slew start time, and orange solid line(s) is a spacecraft slew end time.
- 5) Time of each bin is in the middle of the bin.
1 s binning
From T0-310 s to T0+310 s
From T100_start - 20 s to T100_end + 30 s
Full time interval
64 ms binning
Full time interval
From T100_start to T100_end
From T0-5 sec to T0+5 sec
16 ms binning
From T100_start-5 s to T100_start+5 s
8 ms binning
From T100_start-3 s to T100_start+3 s
2 ms binning
From T100_start-1 s to T100_start+1 s
SN=5 or 10 sec. binning (whichever binning is satisfied first)
SN=5 or 10 sec. binning (T < 200 sec)
Quad-rate summed light curves (from T0-300s to T0+1000s)

Spectral Evolution
Spectra
Notes:
- 1) The fitting includes the systematic errors.
- 2) When the burst includes telescope slew time periods, the fitting uses an average response file made from multiple 5-s response files through out the slew time plus single time preiod for the non-slew times, and weighted by the total counts in the corresponding time period using addrmf. An average response file is needed becuase a spectral fit using the pre-slew DRM will introduce some errors in both a spectral shape and a normalization if the PHA file contains a lot of the slew/post-slew time interval.
- 3) For fits to more complicated models (e.g. a power-law over a cutoff power-law), the BAT team has decided to require a chi-square improvement of more than 6 for each extra dof.
Time averaged spectrum fit using the average DRM
Power-law model
Time interval is from   -2.736 sec. to   70.700 sec.

Spectral model in power-law:
------------------------------------------------------------
Parameters  : value       lower 90%   higher 90%
Photon index: 1.58832     ( -0.0787535   0.0787919 )
Norm@50keV  : 5.17769E-03    ( -0.000214594   0.000214501 )
------------------------------------------------------------
#Fit statistic : Chi-Squared =          63.60 using 59 PHA bins.
# Reduced chi-squared =          1.116 for     57 degrees of freedom
# Null hypothesis probability =   2.553776e-01

Photon flux (15-150 keV)    in 73.44 sec: 0.662972 ( -0.0306428  0.0307748 ) ph/cm2/s
Energy fluence (15-150 keV)             : 3.5613e-06 ( -1.5401e-07  1.54489e-07 ) ergs/cm2
Cutoff power-law model

Time interval is from   -2.736 sec. to   70.700 sec.
Spectral model in the cutoff power-law:
------------------------------------------------------------
Parameters  : value       lower 90%   higher 90%
Photon index: 1.58591     ( -0.146139   0.0794957 )
Epeak [keV] : 9999.34      ( -9999.36 -9999.36 )
Norm@50keV  : 5.18325E-03    ( -0.000214989   0.000981791 )
------------------------------------------------------------
#Fit statistic : Chi-Squared =          63.63 using 59 PHA bins.
# Reduced chi-squared =          1.136 for     56 degrees of freedom
# Null hypothesis probability =   2.257267e-01

Photon flux (15-150 keV)    in 73.44 sec: 0.664332 ( -0.03238  0.029253 ) ph/cm2/s
Energy fluence (15-150 keV)             : 3.55956e-06 ( -1.51903e-07  1.51734e-07 ) ergs/cm2
Band function

Time interval is from   -2.736 sec. to   70.700 sec.

Spectral model in the Band function:
------------------------------------------------------------
Parameters  : value       lower 90%   higher 90%
alpha       : -1.34810   ( 1.3481   1.3481 )
beta        : -1.58832    ( -0.0788114   0.0786222 )
Epeak [keV] : 16.1530      ( -16.153 -16.153 )
Norm@50keV   : 1.09773E-02    ( -0.0044572   13.7315 )
------------------------------------------------------------
#Fit statistic : Chi-Squared =          63.60 using 59 PHA bins.
# Reduced chi-squared =          1.156 for     55 degrees of freedom
# Null hypothesis probability =   1.994575e-01

Photon flux (15-150 keV)    in 73.44 sec:  (    ) ph/cm2/s
Energy fluence (15-150 keV)             : 0 ( 0  0 ) ergs/cm2
Single BB
Spectral model blackbody:
------------------------------------------------------------
Parameters  : value    Lower 90%  Upper 90%
kT [keV]    : 16.2183  (  )
R^2/D10^2   : 5.34807E-02  (   )
(R is the radius in km and D10 is the distance to the source in units of 10 kpc)
------------------------------------------------------------
#Fit statistic : Chi-Squared =         233.75 using 59 PHA bins.
# Reduced chi-squared =         4.1009 for     57 degrees of freedom
# Null hypothesis probability =   2.884749e-23

Energy  Fluence     90% Error
[keV]   [erg/cm2]   [erg/cm2]
15- 25  2.129e-07   1.865e-08
25- 50  9.065e-07   5.655e-08
50-150  1.675e-06   1.175e-07
15-150  2.794e-06   1.329e-07
Thermal bremsstrahlung (OTTB)
Spectral model: thermal bremsstrahlung
------------------------------------------------------------
Parameters  : value         Lower 90%    Upper 90%
kT [keV]    : 200.000       (      )
Norm        : 2.66278       (-0.110331     0.110284)
------------------------------------------------------------
#Fit statistic : Chi-Squared =          70.52 using 59 PHA bins.
# Reduced chi-squared =          1.237 for     57 degrees of freedom
# Null hypothesis probability =   1.076610e-01

Energy  Fluence     90% Error
[keV]   [erg/cm2]   [erg/cm2]
15- 25  4.871e-07   2.379e-08
25- 50  9.371e-07   4.517e-08
50-150  2.055e-06   1.002e-07
15-150  3.479e-06   1.774e-07
Double BB
Spectral model: bbodyrad<1> + bbodyrad<2>
------------------------------------------------------------
Parameters  : value         Lower 90%    Upper 90%
kT1 [keV]   : 6.90469        (-0.995375      1.1186)
R1^2/D10^2  : 0.784690        (-0.322296      0.628239)
kT2 [keV]   : 28.8527        (-3.97049      6.09789)
R2^2/D10^2  : 5.77986E-03    (-0.00276498   0.0040536)
------------------------------------------------------------
#Fit statistic : Chi-Squared =          74.19 using 59 PHA bins.
# Reduced chi-squared =          1.349 for     55 degrees of freedom
# Null hypothesis probability =   4.331439e-02

Energy  Fluence     90% Error
[keV]   [erg/cm2]   [erg/cm2]
15- 25  4.916e-07   7.612e-08
25- 50  9.236e-07   8.886e-08
50-150  2.140e-06   2.655e-07
15-150  3.555e-06   3.331e-07
Peak spectrum fit
Power-law model
Time interval is from   22.028 sec. to   23.028 sec.

Spectral model in power-law:
------------------------------------------------------------
Parameters  : value       lower 90%   higher 90%
Photon index: 1.70232     ( -0.25856   0.267409 )
Norm@50keV  : 1.21977E-02    ( -0.00187253   0.00184137 )
------------------------------------------------------------
#Fit statistic : Chi-Squared =          48.07 using 59 PHA bins.
# Reduced chi-squared =         0.8433 for     57 degrees of freedom
# Null hypothesis probability =   7.942636e-01

Photon flux (15-150 keV)    in 1 sec: 1.62131 ( -0.243215  0.244423 ) ph/cm2/s
Energy fluence (15-150 keV)             : 1.12916e-07 ( -1.79312e-08  1.80613e-08 ) ergs/cm2
Cutoff power-law model
Time interval is from   22.028 sec. to   23.028 sec.
Spectral model in the cutoff power-law:
------------------------------------------------------------
Parameters  : value       lower 90%   higher 90%
Photon index: 1.70601     ( -0.265039   0.264275 )
Epeak [keV] : 9999.30      ( -9999.34 -9999.35 )
Norm@50keV  : 1.21824E-02    ( -0.00187318   0.015215 )
------------------------------------------------------------
#Fit statistic : Chi-Squared =          48.07 using 59 PHA bins.
# Reduced chi-squared =         0.8584 for     56 degrees of freedom
# Null hypothesis probability =   7.654008e-01

Photon flux (15-150 keV)    in 1 sec: 1.62360 ( -0.24694  0.24206 ) ph/cm2/s
Energy fluence (15-150 keV)             : 1.12651e-07 ( -1.76999e-08  1.8193e-08 ) ergs/cm2
Band function
Time interval is from   22.028 sec. to   23.028 sec.

Spectral model in the Band function:
------------------------------------------------------------
Parameters  : value       lower 90%   higher 90%
alpha       : 4.93898   ( -4.93898   -4.93898 )
beta        : -1.75740    ( -0.306977   0.278287 )
Epeak [keV] : 21.6814      ( -21.6814 5.22422 )
Norm@50keV   : 3403.91    ( -489.439   1.05737e+07 )
------------------------------------------------------------
#Fit statistic : Chi-Squared =          47.38 using 59 PHA bins.
# Reduced chi-squared =         0.8615 for     55 degrees of freedom
# Null hypothesis probability =   7.574943e-01

Photon flux (15-150 keV)    in 1 sec:  (    ) ph/cm2/s
Energy fluence (15-150 keV)             : 0 ( 0  0 ) ergs/cm2
Single BB
Spectral model blackbody:
------------------------------------------------------------
Parameters  : value    Lower 90%  Upper 90%
kT [keV]    : 15.3725  (-3.07893  3.72176)
R^2/D10^2   : 0.155848  (-0.0838668   0.191884)
(R is the radius in km and D10 is the distance to the source in units of 10 kpc)
------------------------------------------------------------
#Fit statistic : Chi-Squared =          69.31 using 59 PHA bins.
# Reduced chi-squared =          1.216 for     57 degrees of freedom
# Null hypothesis probability =   1.271258e-01

Energy  Fluence     90% Error
[keV]   [erg/cm2]   [erg/cm2]
15- 25  7.678e-09   2.539e-09
25- 50  3.119e-08   8.020e-09
50-150  5.070e-08   1.582e-08
15-150  8.958e-08   2.067e-08
Thermal bremsstrahlung (OTTB)
Spectral model: thermal bremsstrahlung
------------------------------------------------------------
Parameters  : value         Lower 90%    Upper 90%
kT [keV]    : 156.656       (-72.7498      -156.35)
Norm        : 6.58505       (-1.06685     1.42186)
------------------------------------------------------------
#Fit statistic : Chi-Squared =          49.34 using 59 PHA bins.
# Reduced chi-squared =         0.8655 for     57 degrees of freedom
# Null hypothesis probability =   7.547574e-01

Energy  Fluence     90% Error
[keV]   [erg/cm2]   [erg/cm2]
15- 25  1.685e-08   9.565e-09
25- 50  3.142e-08   1.693e-08
50-150  6.313e-08   3.675e-08
15-150  1.114e-07   6.280e-08
Double BB
Spectral model: bbodyrad<1> + bbodyrad<2>
------------------------------------------------------------
Parameters  : value         Lower 90%    Upper 90%
kT1 [keV]   : 4.85183        (-1.21467      1.72755)
R1^2/D10^2  : 8.81468        (-6.3854      24.5731)
kT2 [keV]   : 24.5438        (-5.76895      10.2899)
R2^2/D10^2  : 2.49816E-02    (-0.017278   0.0281494)
------------------------------------------------------------
#Fit statistic : Chi-Squared =          44.92 using 59 PHA bins.
# Reduced chi-squared =         0.8167 for     55 degrees of freedom
# Null hypothesis probability =   8.321000e-01

Energy  Fluence     90% Error
[keV]   [erg/cm2]   [erg/cm2]
15- 25  2.162e-08   1.146e-08
25- 50  2.633e-08   1.076e-08
50-150  6.683e-08   3.832e-08
15-150  1.148e-07   4.814e-08
Pre-slew spectrum (Pre-slew PHA with pre-slew DRM)
Power-law model

Spectral model in power-law:
------------------------------------------------------------
Parameters  : value       lower 90%   higher 90%
Photon index: 1.58832     ( -0.0787535   0.0787919 )
Norm@50keV  : 5.17769E-03    ( -0.000214594   0.000214501 )
------------------------------------------------------------
#Fit statistic : Chi-Squared =          63.60 using 59 PHA bins.
# Reduced chi-squared =          1.116 for     57 degrees of freedom
# Null hypothesis probability =   2.553776e-01

Photon flux (15-150 keV)    in 73.44 sec: 0.662972 ( -0.0306428  0.0307748 ) ph/cm2/s
Energy fluence (15-150 keV)             : 3.5613e-06 ( -1.5401e-07  1.54489e-07 ) ergs/cm2
Cutoff power-law model

Spectral model in the cutoff power-law:
------------------------------------------------------------
Parameters  : value       lower 90%   higher 90%
Photon index: 1.58591     ( -0.146139   0.0794957 )
Epeak [keV] : 9999.34      ( -9999.36 -9999.36 )
Norm@50keV  : 5.18325E-03    ( -0.000214989   0.000981791 )
------------------------------------------------------------
#Fit statistic : Chi-Squared =          63.63 using 59 PHA bins.
# Reduced chi-squared =          1.136 for     56 degrees of freedom
# Null hypothesis probability =   2.257267e-01

Photon flux (15-150 keV)    in 73.44 sec: 0.664332 ( -0.03238  0.029253 ) ph/cm2/s
Energy fluence (15-150 keV)             : 3.55956e-06 ( -1.51903e-07  1.51734e-07 ) ergs/cm2
Band function

Spectral model in the Band function:
------------------------------------------------------------
Parameters  : value       lower 90%   higher 90%
alpha       : -1.34810   ( 1.3481   1.3481 )
beta        : -1.58832    ( -0.0788114   0.0786222 )
Epeak [keV] : 16.1530      ( -16.153 -16.153 )
Norm@50keV   : 1.09773E-02    ( -0.00601352   1342.43 )
------------------------------------------------------------
#Fit statistic : Chi-Squared =          63.60 using 59 PHA bins.
# Reduced chi-squared =          1.156 for     55 degrees of freedom
# Null hypothesis probability =   1.994575e-01

Photon flux (15-150 keV)    in 73.44 sec:  (    ) ph/cm2/s
Energy fluence (15-150 keV)             : 0 ( 0  0 ) ergs/cm2
S(25-50 keV) vs. S(50-100 keV) plot
S(25-50 keV)  = 9.18e-07
S(50-100 keV) = 1.22e-06
T90 vs. Hardness ratio plot
T90                                   = 56.3000000119209 sec.
Hardness ratio (energy fluence ratio) = 1.32898
Color vs. Color plot
Count Ratio  (25-50 keV) / (15-25 keV) = 1.27586
Count Ratio (50-100 keV) / (15-25 keV) = 1.01021
Mask shadow pattern
IMX = -1.002932845507641E+00, IMY = 1.869627766153752E-01
TIME vs. PHA plot around the trigger time
TIME vs. DetID plot around the trigger time
100 us light curve (15-350 keV)

Spacecraft aspect plot
Bright source in the pre-burst/pre-slew/post-slew images
Pre-burst image of 15-350 keV band
Time interval of the image:
-299.472000 -2.736000

# RAcent  DECcent POSerr Theta    Phi  PeakCts   SNR AngSep     Name
#  [deg]    [deg]    ['] [deg]  [deg]                   [']
254.4278  35.3371    1.1  36.5   -8.5   2.4872  10.6    1.5	Her X-1
288.9045  11.0692    4.7  26.0  -87.7   0.6259   2.5    9.7	GRS 1915+105
299.5891  35.2019    0.3   0.0 -173.6   7.3392  42.1    0.1	Cyg X-1
308.0488  40.9555    1.2   8.8  114.4   1.7059   9.5    2.8	Cyg X-3
326.0411  38.4291    5.3  21.4  141.3   0.4447   2.2    8.9	Cyg X-2
352.5816  53.7612    2.7  40.9  113.9   3.0892   4.4 ------	UNKNOWN
238.8738  55.2426    2.8  45.4   23.5   1.7006   4.2 ------	UNKNOWN
245.1100  27.6905    2.5  46.5  -15.6   1.5248   4.6 ------	UNKNOWN
269.1387  11.9819    2.3  36.0  -54.8   1.4170   4.9 ------	UNKNOWN
Pre-slew background subtracted image of 15-350 keV band
Time interval of the image:
-2.736000 70.700000

# RAcent  DECcent POSerr Theta    Phi  PeakCts   SNR AngSep     Name
#  [deg]    [deg]    ['] [deg]  [deg]                   [']
254.2945  35.2148    4.0  36.7   -8.7  -0.3577  -2.9   11.1	Her X-1
288.9571  10.9910   24.3  26.1  -87.9  -0.0578  -0.5    9.7	GRS 1915+105
299.5671  35.1501    4.4   0.1  -99.2   0.2265   2.6    3.3	Cyg X-1
308.1317  40.9570 1040.3   8.8  114.7   0.0010   0.0    1.0	Cyg X-3
326.1161  38.5089    7.5  21.4  141.0  -0.1539  -1.5   11.5	Cyg X-2
336.3077  44.5708    2.1  29.4  128.0   0.7199   5.5 ------	UNKNOWN
312.9670  36.3946    2.6  10.9  147.6   0.3862   4.4 ------	UNKNOWN
333.6013  20.8822    2.6  33.0  174.3   0.4952   4.5 ------	UNKNOWN
342.9183   6.1677    2.0  49.2 -176.5   1.1387   5.7 ------	UNKNOWN
336.6496   5.0273    0.3  45.6 -169.4   5.8294  36.1 ------	UNKNOWN
Post-slew image of 15-350 keV band
Time interval of the image:
-299.472000 302.601300

# RAcent  DECcent POSerr Theta    Phi  PeakCts   SNR AngSep     Name
#  [deg]    [deg]    ['] [deg]  [deg]                   [']
254.4364  35.3609    1.0  36.5   -8.5   4.5508  11.0    1.5	Her X-1
288.9138  11.0663    3.9  26.0  -87.7   1.2570   3.0    9.9	GRS 1915+105
299.5888  35.2001    0.2   0.0 -159.7  15.4375  52.4    0.1	Cyg X-1
308.0990  40.9499    0.9   8.8  114.6   3.6541  12.2    0.5	Cyg X-3
326.1398  38.3613    3.7  21.4  141.4   1.0158   3.1    2.8	Cyg X-2
276.2867  65.5462    2.7  33.3   50.4   2.0204   4.3 ------	UNKNOWN
308.1311  37.6061    1.9   7.3  136.0   1.8487   6.1 ------	UNKNOWN
344.6697  11.2783    2.7  47.3  176.8   2.7520   4.2 ------	UNKNOWN
336.6689   5.0418    0.9  45.6 -169.5   6.7335  12.6 ------	UNKNOWN
288.5513   9.8278    2.0  27.3  -87.9   2.5169   5.7 ------	UNKNOWN
269.1397  11.9665    2.4  36.0  -54.8   2.4347   4.8 ------	UNKNOWN
Plot creation:
Sun May 31 17:46:18 EDT 2015