Special notes of this burst
Image
Pre-slew 15.0-350.0 keV image (Event data)

#   RAcent    DECcent   POSerr    Theta     Phi              Peak Cts       SNR   Name
   38.0548   -26.5053   0.0161    16.7346  -129.5056         0.5769580     11.896 TRIG_01010946

Foreground time interval of the image:
 -2.732  12.840 (delta_t =  15.572 [sec])
Background time interval of the image:
-239.248  -2.732 (delta_t = 236.516 [sec])
Lightcurves
Notes:
- 1) The mask-weighted light curves are using the flight position.
- 2) Multiple plots of different time binning/intervals are shown to cover all scenarios of short/long GRBs, rate/image triggers, and real/false positives.
- 3) For all the mask-weighted lightcurves, the y-axis units are counts/sec/det where a det is 0.4 x 0.4 = 0.16 sq cm.
- 4) The verticle lines correspond to following: green dotted lines are T50 interval, black dotted lines are T90 interval, blue solid line(s) is a spacecraft slew start time, and orange solid line(s) is a spacecraft slew end time.
- 5) Time of each bin is in the middle of the bin.
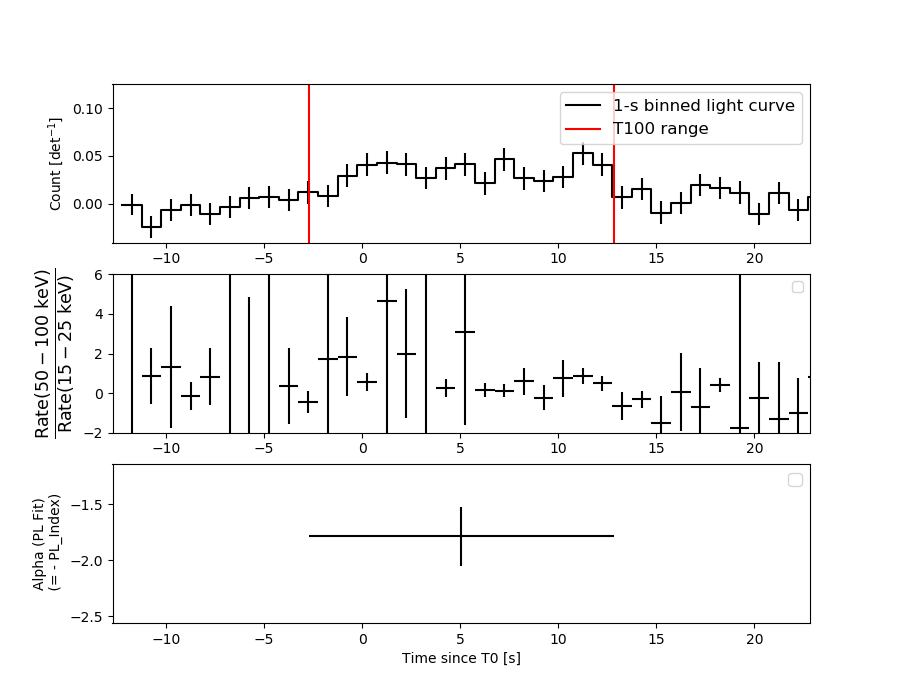
1 s binning
From T0-310 s to T0+310 s
From T100_start - 20 s to T100_end + 30 s

Full time interval
64 ms binning
Full time interval
From T100_start to T100_end
From T0-5 sec to T0+5 sec
16 ms binning
From T100_start-5 s to T100_start+5 s
Blue+Cyan dotted lines: Time interval of the scaled map
From 0.000000 to 12.160000
8 ms binning
From T100_start-3 s to T100_start+3 s
Blue+Cyan dotted lines: Time interval of the scaled map
From 0.000000 to 12.160000
2 ms binning
From T100_start-1 s to T100_start+1 s
Blue+Cyan dotted lines: Time interval of the scaled map
From 0.000000 to 12.160000
SN=5 or 10 sec. binning (whichever binning is satisfied first)

SN=5 or 10 sec. binning (T < 200 sec)

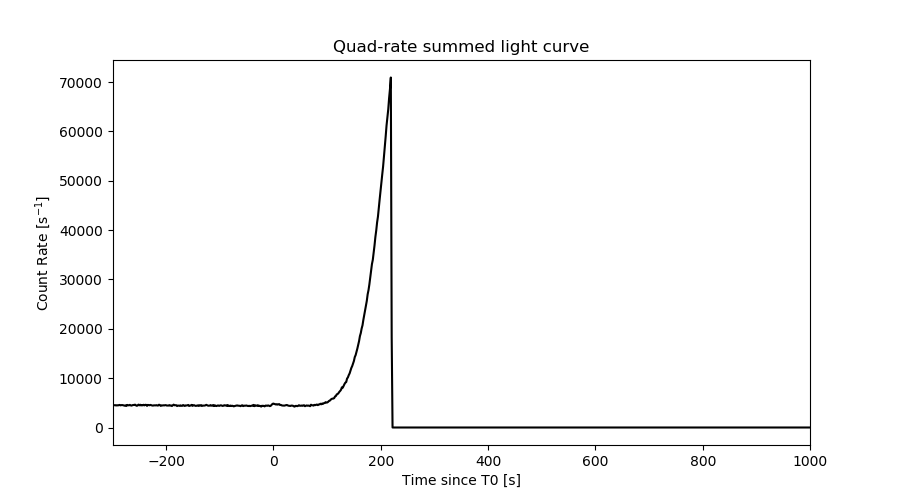
Quad-rate summed light curves (from T0-300s to T0+1000s)
Spectral Evolution
Spectra
Notes:
- 1) The fitting includes the systematic errors.
- 2) When the burst includes telescope slew time periods, the fitting uses an average response file made from multiple 5-s response files through out the slew time plus single time preiod for the non-slew times, and weighted by the total counts in the corresponding time period using addrmf. An average response file is needed becuase a spectral fit using the pre-slew DRM will introduce some errors in both a spectral shape and a normalization if the PHA file contains a lot of the slew/post-slew time interval.
- 3) For fits to more complicated models (e.g. a power-law over a cutoff power-law), the BAT team has decided to require a chi-square improvement of more than 6 for each extra dof.
Time averaged spectrum fit using the average DRM
Power-law model

Time interval is from   -2.732 sec. to   12.840 sec.

Spectral model in power-law:
------------------------------------------------------------
Parameters  : value       lower 90%   higher 90%
Photon index: 1.78051     ( -0.251486   0.266671 )
Norm@50keV  : 1.99429E-03    ( -0.000342221   0.000332643 )
------------------------------------------------------------
#Fit statistic  : Chi-Squared                   69.65     using 59 bins.
 Reduced chi-squared = 1.22193
# Null hypothesis probability of 1.21e-01 with 57 degrees of freedom

Photon flux (15-150 keV)    in 15.57 sec: 0.272775 ( -0.038544  0.038546 ) ph/cm2/s
Energy fluence (15-150 keV)             : 2.86121e-07 ( -4.93877e-08  5.08009e-08 ) ergs/cm2
Cutoff power-law model

Time interval is from   -2.732 sec. to   12.840 sec.
Spectral model in the cutoff power-law:
------------------------------------------------------------
Parameters  : value       lower 90%   higher 90%
Photon index: 1.17164     ( -1.44735   1.0391 )
Epeak [keV] : 58.0590      ( -21.6605 -58.0544 )
Norm@50keV  : 4.44138E-03    ( -0.00444236   0.0261281 )
------------------------------------------------------------
#Fit statistic  : Chi-Squared                   68.78     using 59 bins.
 Reduced chi-squared = 1.22821
# Null hypothesis probability of 1.17e-01 with 56 degrees of freedom

Photon flux (15-150 keV)    in 15.57 sec: 0.266653 ( -0.040148  0.040045 ) ph/cm2/s
Energy fluence (15-150 keV)             : 2.67552e-07 ( -5.63981e-08  6.03914e-08 ) ergs/cm2
Band function

Time interval is from   -2.732 sec. to   12.840 sec.


Spectral model in the Band function:
------------------------------------------------------------
Parameters  : value       lower 90%   higher 90%
alpha       :    (     )
beta        :     (     )
Epeak [keV] :       (   )
Norm@50keV   :     (     )
------------------------------------------------------------

Photon flux (15-150 keV)    in  sec:  (    ) ph/cm2/s
Energy fluence (15-150 keV)             : 0 ( 0  0 ) ergs/cm2
Single BB
Spectral model blackbody:
------------------------------------------------------------
Parameters  : value    Lower 90%  Upper 90%
kT [keV]    : 10.8872  (-1.66911  2.03765)
R^2/D10^2   : 9.54475E-02  (-0.0450295   0.0812429)
(R is the radius in km and D10 is the distance to the source in units of 10 kpc)
------------------------------------------------------------
#Fit statistic  : Chi-Squared                   76.00     using 59 bins.
 Reduced chi-squared =
# Null hypothesis probability of 4.71e-02 with 57 degrees of freedom

Energy  Fluence     90% Error
[keV]   [erg/cm2]   [erg/cm2]
15- 25  3.673e-08   9.435e-09
25- 50  1.025e-07   2.317e-08
50-150  6.807e-08   2.295e-08
15-150  2.073e-07   4.605e-08
Thermal bremsstrahlung (OTTB)

Spectral model: thermal bremsstrahlung
------------------------------------------------------------
Parameters  : value         Lower 90%    Upper 90%
kT [keV]    : 97.2692       (-38.9212      -97.2692)
Norm        : 1.21864       (-0.217659     0.285689)
------------------------------------------------------------
#Fit statistic  : Chi-Squared                   68.80     using 59 bins.
 Reduced chi-squared =
# Null hypothesis probability of 1.36e-01 with 57 degrees of freedom

Energy  Fluence     90% Error
[keV]   [erg/cm2]   [erg/cm2]
15- 25  4.959e-08   9.233e-09
25- 50  8.526e-08   1.791e-08
50-150  1.360e-07   8.036e-08
15-150  2.708e-07   9.443e-08
Double BB
Spectral model: bbodyrad<1> + bbodyrad<2>
------------------------------------------------------------
Parameters  : value         Lower 90%    Upper 90%
kT1 [keV]   : 7.61213        (-6.19507      3.15819)
R1^2/D10^2  : 0.264113        (-0.169492      549.565)
kT2 [keV]   : 25.5515        (-24.3547      -25.7885)
R2^2/D10^2  : 2.48375E-03    (-0.00238594   0.0792279)
------------------------------------------------------------
#Fit statistic  : Chi-Squared                   69.21     using 59 bins.
 Reduced chi-squared =
# Null hypothesis probability of 9.41e-02 with 55 degrees of freedom

Energy  Fluence     90% Error
[keV]   [erg/cm2]   [erg/cm2]
15- 25  4.576e-08   2.559e-08
25- 50  9.124e-08   4.795e-08
50-150  1.347e-07   7.350e-08
15-150  2.717e-07   1.414e-07
Peak spectrum fit
Power-law model
Time interval is from   11.488 sec. to   12.488 sec.

Spectral model in power-law:
------------------------------------------------------------
Parameters  : value       lower 90%   higher 90%
Photon index: 2.00439     ( -0.546461   0.644865 )
Norm@50keV  : 3.31904E-03    ( -0.00139377   0.00132339 )
------------------------------------------------------------
#Fit statistic  : Chi-Squared                   59.14     using 59 bins.
 Reduced chi-squared = 1.03754
# Null hypothesis probability of 3.97e-01 with 57 degrees of freedom

Photon flux (15-150 keV)    in 1 sec: 0.498902 ( -0.147398  0.147469 ) ph/cm2/s
Energy fluence (15-150 keV)             : 3.06203e-08 ( -1.13246e-08  1.2363e-08 ) ergs/cm2
Cutoff power-law model
Time interval is from   11.488 sec. to   12.488 sec.
Spectral model in the cutoff power-law:
------------------------------------------------------------
Parameters  : value       lower 90%   higher 90%
Photon index: 1.96078     ( -1.93694   0.179765 )
Epeak [keV] : 33.7714      ( -34.8736 -34.8852 )
Norm@50keV  : 3.53871E-03    ( -0.0037001   15.801 )
------------------------------------------------------------
#Fit statistic  : Chi-Squared                   59.14     using 59 bins.
 Reduced chi-squared = 1.05607
# Null hypothesis probability of 3.62e-01 with 56 degrees of freedom

Photon flux (15-150 keV)    in 1 sec: 0.498797 ( -0.169263  0.147217 ) ph/cm2/s
Energy fluence (15-150 keV)             : 3.02294e-08 ( -1.64538e-08  1.18956e-08 ) ergs/cm2
Band function

Time interval is from   11.488 sec. to   12.488 sec.


Spectral model in the Band function:
------------------------------------------------------------
Parameters  : value       lower 90%   higher 90%
alpha       :    (     )
beta        :     (     )
Epeak [keV] :       (   )
Norm@50keV   :     (     )
------------------------------------------------------------

Photon flux (15-150 keV)    in  sec:  (    ) ph/cm2/s
Energy fluence (15-150 keV)             : 0 ( 0  0 ) ergs/cm2
Single BB
Spectral model blackbody:
------------------------------------------------------------
Parameters  : value    Lower 90%  Upper 90%
kT [keV]    : 7.55928  (-2.00602  2.96086)
R^2/D10^2   : 0.697145  (-0.697118   1.68553)
(R is the radius in km and D10 is the distance to the source in units of 10 kpc)
------------------------------------------------------------
#Fit statistic  : Chi-Squared                   59.98     using 59 bins.
 Reduced chi-squared =
# Null hypothesis probability of 3.68e-01 with 57 degrees of freedom

Energy  Fluence     90% Error
[keV]   [erg/cm2]   [erg/cm2]
15- 25  6.884e-09   4.269e-09
25- 50  1.089e-08   7.100e-09
50-150  2.365e-09   2.055e-09
15-150  2.014e-08   1.264e-08
Thermal bremsstrahlung (OTTB)
Spectral model: thermal bremsstrahlung
------------------------------------------------------------
Parameters  : value         Lower 90%    Upper 90%
kT [keV]    : 56.2543       (-33.5402      -56.2543)
Norm        : 2.69603       (-1.07382     2.29286)
------------------------------------------------------------
#Fit statistic  : Chi-Squared                   59.27     using 59 bins.
 Reduced chi-squared =
# Null hypothesis probability of 3.93e-01 with 57 degrees of freedom

Energy  Fluence     90% Error
[keV]   [erg/cm2]   [erg/cm2]
15- 25  6.700e-09   4.202e-09
25- 50  9.992e-09   6.100e-09
50-150  1.076e-08   8.297e-09
15-150  2.746e-08   1.720e-08
Double BB
Spectral model: bbodyrad<1> + bbodyrad<2>
------------------------------------------------------------
Parameters  : value         Lower 90%    Upper 90%
kT1 [keV]   : 6.51911        (-1.36068      2.66283)
R1^2/D10^2  : 1.12012        (-0.559989      3.77798)
kT2 [keV]   : 44.4006        (-33.9032      -44.403)
R2^2/D10^2  : 8.55178E-04    (-0.00084927   0.102903)
------------------------------------------------------------
#Fit statistic  : Chi-Squared                   56.89     using 59 bins.
 Reduced chi-squared =
# Null hypothesis probability of 4.05e-01 with 55 degrees of freedom

Energy  Fluence     90% Error
[keV]   [erg/cm2]   [erg/cm2]
15- 25  7.261e-09   4.349e-09
25- 50  9.804e-09   5.715e-09
50-150  1.635e-08   9.565e-09
15-150  3.341e-08   1.637e-08
Pre-slew spectrum (Pre-slew PHA with pre-slew DRM)
Power-law model
Spectral model in power-law:
------------------------------------------------------------
Parameters  : value       lower 90%   higher 90%
Photon index: 1.78051     ( -0.251486   0.266671 )
Norm@50keV  : 1.99429E-03    ( -0.000342221   0.000332643 )
------------------------------------------------------------
#Fit statistic  : Chi-Squared                   69.65     using 59 bins.
 Reduced chi-squared =
# Null hypothesis probability of 1.21e-01 with 57 degrees of freedom

Photon flux (15-150 keV)    in 15.57 sec: 0.272761 ( -0.0385417  0.0385438 ) ph/cm2/s
Energy fluence (15-150 keV)             : 2.8608e-07 ( -4.93585e-08  5.08166e-08 ) ergs/cm2
Cutoff power-law model
Spectral model in the cutoff power-law:
------------------------------------------------------------
Parameters  : value       lower 90%   higher 90%
Photon index: 1.17134     ( -1.44727   1.0405 )
Epeak [keV] : 58.0501      ( -21.6588 -58.0536 )
Norm@50keV  : 4.44317E-03    ( -0.00444241   0.0261275 )
------------------------------------------------------------
#Fit statistic  : Chi-Squared                   68.78     using 59 bins.
 Reduced chi-squared =
# Null hypothesis probability of 1.17e-01 with 56 degrees of freedom

Photon flux (15-150 keV)    in 15.57 sec: 0.266608 ( -0.040126  0.040101 ) ph/cm2/s
Energy fluence (15-150 keV)             : 2.67633e-07 ( -5.64257e-08  6.03011e-08 ) ergs/cm2
Band function
Spectral model in the Band function:
------------------------------------------------------------
Parameters  : value       lower 90%   higher 90%
alpha       :    (     )
beta        :     (     )
Epeak [keV] :       (   )
Norm@50keV   :     (     )
------------------------------------------------------------

Photon flux (15-150 keV)    in  sec:  (    ) ph/cm2/s
Energy fluence (15-150 keV)             : 0 ( 0  0 ) ergs/cm2
S(25-50 keV) vs. S(50-100 keV) plot

S(25-50 keV)  = 8.00e-08
S(50-100 keV) = 9.31e-08
T90 vs. Hardness ratio plot

T90                                   = 12.1840000152588 sec.
Hardness ratio (energy fluence ratio) = 1.16375
Color vs. Color plot

Count Ratio  (25-50 keV) / (15-25 keV) = 1.60556
Count Ratio (50-100 keV) / (15-25 keV) = 0.757148
Mask shadow pattern
IMX = -1.912734942294735E-01, IMY = 2.319874738279152E-01
TIME vs. PHA plot around the trigger time
Blue+Cyan dotted lines: Time interval of the scaled map
From 0.000000 to 12.160000
TIME vs. DetID plot around the trigger time

Blue+Cyan dotted lines: Time interval of the scaled map
From 0.000000 to 12.160000
100 us light curve (15-350 keV)
Blue+Cyan dotted lines: Time interval of the scaled map
From 0.000000 to 12.160000
Spacecraft aspect plot
Bright source in the pre-burst/pre-slew/post-slew images
Pre-burst image of 15-350 keV band
Time interval of the image:
-239.248000 -2.732000

# RAcent  DECcent POSerr Theta    Phi  PeakCts   SNR AngSep     Name
#  [deg]    [deg]    ['] [deg]  [deg]                   [']
 76.6416  11.6244    2.4  40.8   96.6   4.4594   4.9 ------	UNKNOWN
 95.9221 -35.5798    3.1  54.9  164.7   5.3502   3.7 ------	UNKNOWN
  1.1369  33.2398    3.2  58.3   -1.9   5.1521   3.6 ------	UNKNOWN
 12.3856   2.8346    2.4  32.2  -29.6   1.3886   4.9 ------	UNKNOWN
357.1987  11.3766    2.9  49.5  -27.2   2.3843   3.9 ------	UNKNOWN
Pre-slew background subtracted image of 15-350 keV band
Time interval of the image:
-2.732000 12.840000

# RAcent  DECcent POSerr Theta    Phi  PeakCts   SNR AngSep     Name
#  [deg]    [deg]    ['] [deg]  [deg]                   [']
 65.3732  23.3064    3.8  40.6   72.2   0.5185   3.0 ------	UNKNOWN
 21.3285  15.6321    2.2  33.0   -0.6   0.2868   5.1 ------	UNKNOWN
 38.0548 -26.5054    1.0  16.7 -129.5   0.5773  11.9 ------	UNKNOWN
  4.0892  14.2548    2.1  44.8  -19.5   0.4343   5.5 ------	UNKNOWN
Post-slew image of 15-350 keV band
Time interval of the image:
103.652600 242.832000

# RAcent  DECcent POSerr Theta    Phi  PeakCts   SNR AngSep     Name
#  [deg]    [deg]    ['] [deg]  [deg]                   [']
103.4159 -35.1755    2.5  55.8  170.8   2.7319   4.7 ------	UNKNOWN
104.5366 -42.2535    2.2  55.6  179.4   2.6341   5.2 ------	UNKNOWN
358.9291   4.9963    2.5  49.3   -1.3   0.8419   4.6  306.6	UNKNOWN
  4.4735  -1.5666    2.4  40.8   -3.1   0.6289   4.7  284.4	UNKNOWN
343.0172 -10.5836    2.6  54.1  -29.1   1.8212   4.3 ------	UNKNOWN
340.6823 -12.4658    2.5  55.4  -32.4   2.8170   4.6 ------	UNKNOWN
Plot creation:
Sun Nov 13 12:04:14 EST 2022