Estimated redshift from machine learning (Ukwatta et al. 2016) - may take a few minute to calcaulte
Image
Pre-slew 15.0-350.0 keV image (Event data)
#   RAcent    DECcent   POSerr    Theta     Phi              Peak Cts       SNR   Name
  214.4879   -45.4057   0.0127    40.3634   -33.9395         2.7520213     15.135 TRIG_01013852

Foreground time interval of the image:
 -7.632  41.712 (delta_t =  49.344 [sec])
Background time interval of the image:
-239.616  -7.632 (delta_t = 231.984 [sec])
Lightcurves
Notes:
- 1) The mask-weighted light curves are using the flight position.
- 2) Multiple plots of different time binning/intervals are shown to cover all scenarios of short/long GRBs, rate/image triggers, and real/false positives.
- 3) For all the mask-weighted lightcurves, the y-axis units are counts/sec/det where a det is 0.4 x 0.4 = 0.16 sq cm.
- 4) The verticle lines correspond to following: green dotted lines are T50 interval, black dotted lines are T90 interval, blue solid line(s) is a spacecraft slew start time, and orange solid line(s) is a spacecraft slew end time.
- 5) Time of each bin is in the middle of the bin.
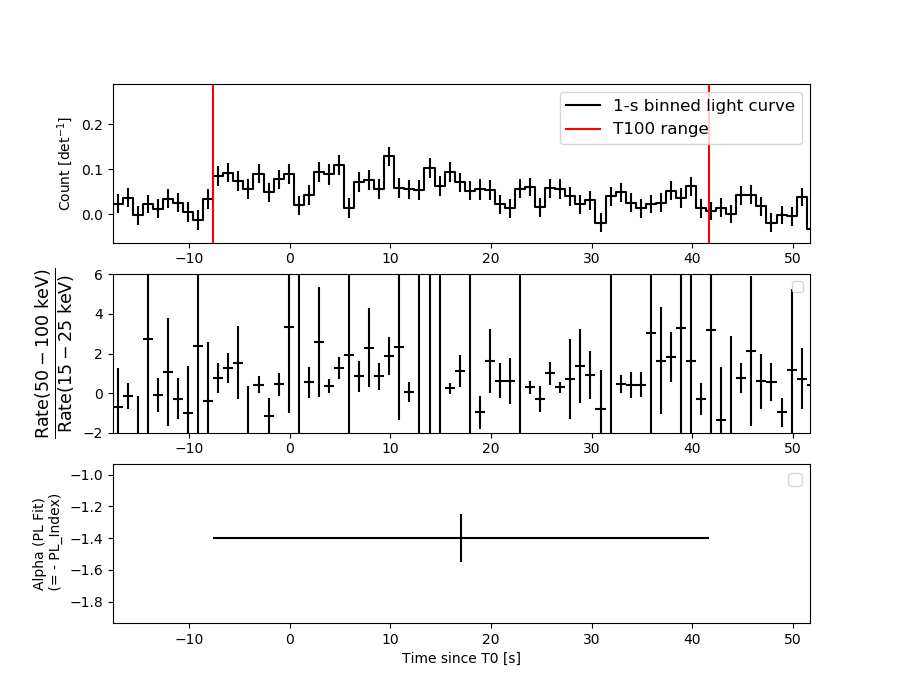
1 s binning
From T0-310 s to T0+310 s
From T100_start - 20 s to T100_end + 30 s
Full time interval
64 ms binning
Full time interval
From T100_start to T100_end
From T0-5 sec to T0+5 sec
16 ms binning
From T100_start-5 s to T100_start+5 s
Blue+Cyan dotted lines: Time interval of the scaled map
From 0.000000 to 8.192000
8 ms binning
From T100_start-3 s to T100_start+3 s

Blue+Cyan dotted lines: Time interval of the scaled map
From 0.000000 to 8.192000
2 ms binning
From T100_start-1 s to T100_start+1 s
Blue+Cyan dotted lines: Time interval of the scaled map
From 0.000000 to 8.192000
SN=5 or 10 sec. binning (whichever binning is satisfied first)

SN=5 or 10 sec. binning (T < 200 sec)
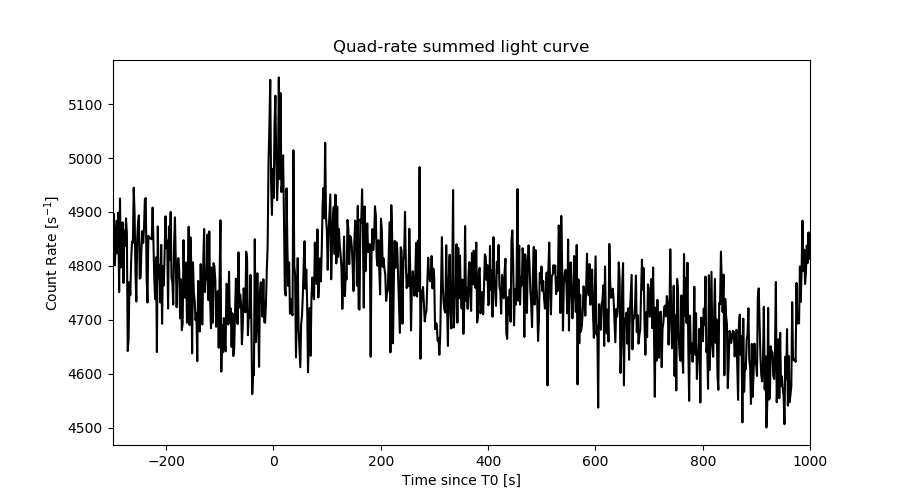
Quad-rate summed light curves (from T0-300s to T0+1000s)
Spectral Evolution
Spectra
Notes:
- 1) The fitting includes the systematic errors.
- 2) When the burst includes telescope slew time periods, the fitting uses an average response file made from multiple 5-s response files through out the slew time plus single time preiod for the non-slew times, and weighted by the total counts in the corresponding time period using addrmf. An average response file is needed becuase a spectral fit using the pre-slew DRM will introduce some errors in both a spectral shape and a normalization if the PHA file contains a lot of the slew/post-slew time interval.
- 3) For fits to more complicated models (e.g. a power-law over a cutoff power-law), the BAT team has decided to require a chi-square improvement of more than 6 for each extra dof.
Time averaged spectrum fit using the average DRM
Power-law model
Time interval is from   -7.632 sec. to   41.712 sec.

Spectral model in power-law:
------------------------------------------------------------
Parameters  : value       lower 90%   higher 90%
Photon index: 1.39782     ( -0.149704   0.149105 )
Norm@50keV  : 4.03079E-03    ( -0.000343888   0.000343714 )
------------------------------------------------------------
#Fit statistic  : Chi-Squared                   45.43     using 59 bins.
 Reduced chi-squared = 0.797018
# Null hypothesis probability of 8.65e-01 with 57 degrees of freedom

Photon flux (15-150 keV)    in 49.34 sec: 0.490641 ( -0.044052  0.044211 ) ph/cm2/s
Energy fluence (15-150 keV)             : 1.92278e-06 ( -1.76398e-07  1.77606e-07 ) ergs/cm2
Cutoff power-law model
Time interval is from   -7.632 sec. to   41.712 sec.
Spectral model in the cutoff power-law:
------------------------------------------------------------
Parameters  : value       lower 90%   higher 90%
Photon index: 0.858418     ( -0.698003   0.588795 )
Epeak [keV] : 113.077      ( -36.511 -113.077 )
Norm@50keV  : 7.26757E-03    ( -0.00335477   0.007893 )
------------------------------------------------------------
#Fit statistic  : Chi-Squared                   43.11     using 59 bins.
 Reduced chi-squared = 0.769821
# Null hypothesis probability of 8.96e-01 with 56 degrees of freedom

Photon flux (15-150 keV)    in 49.34 sec: 0.477099 ( -0.046622  0.046694 ) ph/cm2/s
Energy fluence (15-150 keV)             : 1.8599e-06 ( -1.92844e-07  1.92018e-07 ) ergs/cm2
Band function

Time interval is from   -7.632 sec. to   41.712 sec.


Spectral model in the Band function:
------------------------------------------------------------
Parameters  : value       lower 90%   higher 90%
alpha       :    (     )
beta        :     (     )
Epeak [keV] :       (   )
Norm@50keV   :     (     )
------------------------------------------------------------

Photon flux (15-150 keV)    in  sec:  (    ) ph/cm2/s
Energy fluence (15-150 keV)             : 0 ( 0  0 ) ergs/cm2
Single BB

Spectral model blackbody:
------------------------------------------------------------
Parameters  : value    Lower 90%  Upper 90%
kT [keV]    : 17.0913  (-1.73156  1.97681)
R^2/D10^2   : 3.62594E-02  (-0.0114815   0.0163638)
(R is the radius in km and D10 is the distance to the source in units of 10 kpc)
------------------------------------------------------------
#Fit statistic  : Chi-Squared                   63.92     using 59 bins.
 Reduced chi-squared =
# Null hypothesis probability of 2.46e-01 with 57 degrees of freedom

Energy  Fluence     90% Error
[keV]   [erg/cm2]   [erg/cm2]
15- 25  1.063e-07   1.764e-08
25- 50  4.722e-07   5.842e-08
50-150  9.866e-07   1.522e-07
15-150  1.565e-06   1.695e-07
Thermal bremsstrahlung (OTTB)

Spectral model: thermal bremsstrahlung
------------------------------------------------------------
Parameters  : value         Lower 90%    Upper 90%
kT [keV]    : 200.000       (-35.4508      -200)
Norm        : 2.04532       (-0.174586     0.174586)
------------------------------------------------------------
#Fit statistic  : Chi-Squared                   47.12     using 59 bins.
 Reduced chi-squared =
# Null hypothesis probability of 8.22e-01 with 57 degrees of freedom

Energy  Fluence     90% Error
[keV]   [erg/cm2]   [erg/cm2]
15- 25  2.514e-07   2.931e-08
25- 50  4.835e-07   9.814e-08
50-150  1.060e-06   4.221e-07
15-150  1.795e-06   5.854e-07
Double BB

Spectral model: bbodyrad<1> + bbodyrad<2>
------------------------------------------------------------
Parameters  : value         Lower 90%    Upper 90%
kT1 [keV]   : 6.95253        (-2.50893      3.39276)
R1^2/D10^2  : 0.413843        (-0.287147      1.74662)
kT2 [keV]   : 24.4729        (-4.92503      12.4744)
R2^2/D10^2  : 8.76043E-03    (-0.0068215   0.0118793)
------------------------------------------------------------
#Fit statistic  : Chi-Squared                   43.54     using 59 bins.
 Reduced chi-squared =
# Null hypothesis probability of 8.68e-01 with 55 degrees of freedom

Energy  Fluence     90% Error
[keV]   [erg/cm2]   [erg/cm2]
15- 25  2.029e-07   1.051e-07
25- 50  4.680e-07   2.005e-07
50-150  1.171e-06   4.536e-07
15-150  1.842e-06   7.132e-07
Peak spectrum fit
Power-law model
Time interval is from    4.156 sec. to    5.156 sec.

Spectral model in power-law:
------------------------------------------------------------
Parameters  : value       lower 90%   higher 90%
Photon index: 1.45072     ( -0.494696   0.501076 )
Norm@50keV  : 8.19293E-03    ( -0.0023827   0.00237448 )
------------------------------------------------------------
#Fit statistic  : Chi-Squared                   71.48     using 59 bins.
 Reduced chi-squared = 1.25404
# Null hypothesis probability of 9.38e-02 with 57 degrees of freedom

Photon flux (15-150 keV)    in 1 sec: 1.00987 ( -0.301973  0.30417 ) ph/cm2/s
Energy fluence (15-150 keV)             : 7.84007e-08 ( -2.43016e-08  2.46498e-08 ) ergs/cm2
Cutoff power-law model

Time interval is from    4.156 sec. to    5.156 sec.
Spectral model in the cutoff power-law:
------------------------------------------------------------
Parameters  : value       lower 90%   higher 90%
Photon index: 0.534940     ( -5.21643   1.75804 )
Epeak [keV] : 83.4294      ( -36.4004 -83.0804 )
Norm@50keV  : 2.28770E-02    ( -0.0231729   5.33866 )
------------------------------------------------------------
#Fit statistic  : Chi-Squared                   71.07     using 59 bins.
 Reduced chi-squared = 1.26911
# Null hypothesis probability of 8.45e-02 with 56 degrees of freedom

Photon flux (15-150 keV)    in 1 sec: 0.972587 ( -0.340205  0.320223 ) ph/cm2/s
Energy fluence (15-150 keV)             : 7.45659e-08 ( -2.71483e-08  2.66853e-08 ) ergs/cm2
Band function

Time interval is from    4.156 sec. to    5.156 sec.


Spectral model in the Band function:
------------------------------------------------------------
Parameters  : value       lower 90%   higher 90%
alpha       :    (     )
beta        :     (     )
Epeak [keV] :       (   )
Norm@50keV   :     (     )
------------------------------------------------------------

Photon flux (15-150 keV)    in  sec:  (    ) ph/cm2/s
Energy fluence (15-150 keV)             : 0 ( 0  0 ) ergs/cm2
Single BB
Spectral model blackbody:
------------------------------------------------------------
Parameters  : value    Lower 90%  Upper 90%
kT [keV]    : 15.8497  (-4.17079  6.3178)
R^2/D10^2   : 9.97217E-02  (-0.0997216   0.190646)
(R is the radius in km and D10 is the distance to the source in units of 10 kpc)
------------------------------------------------------------
#Fit statistic  : Chi-Squared                   71.86     using 59 bins.
 Reduced chi-squared =
# Null hypothesis probability of 8.89e-02 with 57 degrees of freedom

Energy  Fluence     90% Error
[keV]   [erg/cm2]   [erg/cm2]
15- 25  5.190e-09   3.276e-09
25- 50  2.166e-08   1.339e-08
50-150  3.790e-08   2.399e-08
15-150  6.476e-08   3.751e-08
Thermal bremsstrahlung (OTTB)
Spectral model: thermal bremsstrahlung
------------------------------------------------------------
Parameters  : value         Lower 90%    Upper 90%
kT [keV]    : 199.362       (-125.683      -199.363)
Norm        : 4.19643       (-1.20755     1.20992)
------------------------------------------------------------
#Fit statistic  : Chi-Squared                   71.41     using 59 bins.
 Reduced chi-squared =
# Null hypothesis probability of 9.49e-02 with 57 degrees of freedom

Energy  Fluence     90% Error
[keV]   [erg/cm2]   [erg/cm2]
15- 25  1.045e-08   6.340e-09
25- 50  2.010e-08   1.243e-08
50-150  4.409e-08   2.690e-08
15-150  7.464e-08   4.605e-08
Double BB
Spectral model: bbodyrad<1> + bbodyrad<2>
------------------------------------------------------------
Parameters  : value         Lower 90%    Upper 90%
kT1 [keV]   : 3.35358        (-3.31697      -3.31697)
R1^2/D10^2  : 14.1873        (-19.0128      -19.0128)
kT2 [keV]   : 17.6533        (-5.11496      -17.5616)
R2^2/D10^2  : 6.43324E-02    (-0.066431   0.161148)
------------------------------------------------------------
#Fit statistic  : Chi-Squared                   70.59     using 59 bins.
 Reduced chi-squared =
# Null hypothesis probability of 7.67e-02 with 55 degrees of freedom

Energy  Fluence     90% Error
[keV]   [erg/cm2]   [erg/cm2]
15- 25  9.169e-09   5.210e-09
25- 50  1.949e-08   1.134e-08
50-150  4.142e-08   2.685e-08
15-150  7.008e-08   4.056e-08
Pre-slew spectrum (Pre-slew PHA with pre-slew DRM)
Power-law model

Spectral model in power-law:
------------------------------------------------------------
Parameters  : value       lower 90%   higher 90%
Photon index: 1.39782     ( -0.149704   0.149105 )
Norm@50keV  : 4.03079E-03    ( -0.000343888   0.000343714 )
------------------------------------------------------------
#Fit statistic  : Chi-Squared                   45.43     using 59 bins.
 Reduced chi-squared =
# Null hypothesis probability of 8.65e-01 with 57 degrees of freedom

Photon flux (15-150 keV)    in 49.34 sec: 0.490632 ( -0.0440488  0.0442083 ) ph/cm2/s
Energy fluence (15-150 keV)             : 1.92256e-06 ( -1.76667e-07  1.77595e-07 ) ergs/cm2
Cutoff power-law model

Spectral model in the cutoff power-law:
------------------------------------------------------------
Parameters  : value       lower 90%   higher 90%
Photon index: 0.858419     ( -0.698004   0.588494 )
Epeak [keV] : 113.077      ( -36.5124 -113.077 )
Norm@50keV  : 7.26756E-03    ( -0.00335476   0.00789301 )
------------------------------------------------------------
#Fit statistic  : Chi-Squared                   43.11     using 59 bins.
 Reduced chi-squared =
# Null hypothesis probability of 8.96e-01 with 56 degrees of freedom

Photon flux (15-150 keV)    in 49.34 sec: 0.477058 ( -0.046611  0.046679 ) ph/cm2/s
Energy fluence (15-150 keV)             : 1.86067e-06 ( -1.92599e-07  1.921e-07 ) ergs/cm2
Band function
Spectral model in the Band function:
------------------------------------------------------------
Parameters  : value       lower 90%   higher 90%
alpha       :    (     )
beta        :     (     )
Epeak [keV] :       (   )
Norm@50keV   :     (     )
------------------------------------------------------------

Photon flux (15-150 keV)    in  sec:  (    ) ph/cm2/s
Energy fluence (15-150 keV)             : 0 ( 0  0 ) ergs/cm2
S(25-50 keV) vs. S(50-100 keV) plot

S(25-50 keV)  = 4.51e-07
S(50-100 keV) = 6.86e-07
T90 vs. Hardness ratio plot

T90                                   = 44.3159999847412 sec.
Hardness ratio (energy fluence ratio) = 1.52106
Color vs. Color plot
Count Ratio  (25-50 keV) / (15-25 keV) = 1.64914
Count Ratio (50-100 keV) / (15-25 keV) = 1.42401
Mask shadow pattern
IMX = 7.051549895753279E-01, IMY = 4.745496656977984E-01
TIME vs. PHA plot around the trigger time
Blue+Cyan dotted lines: Time interval of the scaled map
From 0.000000 to 8.192000
TIME vs. DetID plot around the trigger time
Blue+Cyan dotted lines: Time interval of the scaled map
From 0.000000 to 8.192000
100 us light curve (15-350 keV)
Blue+Cyan dotted lines: Time interval of the scaled map
From 0.000000 to 8.192000
Spacecraft aspect plot
Bright source in the pre-burst/pre-slew/post-slew images
Pre-burst image of 15-350 keV band
Time interval of the image:
-239.616000 -7.632000

# RAcent  DECcent POSerr Theta    Phi  PeakCts   SNR AngSep     Name
#  [deg]    [deg]    ['] [deg]  [deg]                   [']
244.9577 -15.6492    0.5  34.2 -100.5  13.3615  23.8    1.4	Sco X-1
254.3970  35.4194   17.6  56.9 -169.9   1.0452   0.7    5.5	Her X-1
188.2992  30.1111    3.0  41.8  117.8   3.8162   3.9 ------	UNKNOWN
246.4504  42.4332    2.7  57.0  179.0   7.2706   4.2 ------	UNKNOWN
197.5491 -37.9360    2.3  35.3  -11.4   1.6702   5.1 ------	UNKNOWN
254.3155  18.1751    2.9  47.9 -151.2   2.7828   4.0 ------	UNKNOWN
Pre-slew background subtracted image of 15-350 keV band
Time interval of the image:
-7.632000 41.712000

# RAcent  DECcent POSerr Theta    Phi  PeakCts   SNR AngSep     Name
#  [deg]    [deg]    ['] [deg]  [deg]                   [']
245.0724 -15.5975    6.3  34.3 -100.7  -0.4095  -1.8    5.9	Sco X-1
254.4891  35.2321    5.2  56.9 -169.6   1.2260   2.2    6.8	Her X-1
189.0096 -46.7639    2.4  46.1   -9.4   0.8988   4.8 ------	UNKNOWN
239.9932  10.3339    2.4  32.0 -149.9   0.5942   4.7 ------	UNKNOWN
214.4876 -45.4054    0.8  40.4  -33.9   2.7388  15.1 ------	UNKNOWN
Post-slew image of 15-350 keV band
Time interval of the image:
120.084600 951.384610

# RAcent  DECcent POSerr Theta    Phi  PeakCts   SNR AngSep     Name
#  [deg]    [deg]    ['] [deg]  [deg]                   [']
170.6820 -60.5744    0.0  29.6   50.6  -0.7624  -0.6   11.2	Cen X-3
186.6535 -62.7709    3.1  23.5   39.6   3.1442   3.8    0.1	GX 301-2
244.9761 -15.6435    0.5  39.2 -122.3  40.4090  23.6    0.3	Sco X-1
255.9653 -37.8646    1.2  31.5  -81.9  12.1733   9.4    1.6	4U 1700-377
256.4597 -36.3979    4.6  32.6  -83.9   3.5949   2.5    1.9	GX 349+2
264.7411 -44.4509 1528.5  35.0  -66.0  -0.0118  -0.0    0.1	4U 1735-44
263.2118 -33.8289    0.0  38.6  -82.9   3.8072   1.5   11.1	GX 354-0
163.9289 -32.3641    3.8  40.7   97.7  10.1380   3.0 ------	UNKNOWN
172.4107 -32.0404    4.3  35.0  104.7   3.9767   2.7 ------	UNKNOWN
179.1092 -23.0811    3.0  36.3  123.1   6.7430   3.8 ------	UNKNOWN
182.4226 -20.4071    3.6  36.3  130.0   5.4854   3.3 ------	UNKNOWN
189.9889  -0.2400    3.0  50.1  154.4  11.3220   3.8 ------	UNKNOWN
194.0958   5.6132    2.8  54.2  161.8  17.1033   4.1 ------	UNKNOWN
132.1761 -77.9977    4.1  44.2   24.3   3.9458   2.8 ------	UNKNOWN
186.7030 -34.7618    2.2  23.6  114.2   4.5676   5.2 ------	UNKNOWN
166.4236 -71.4070    2.9  34.4   31.9   4.6452   3.9 ------	UNKNOWN
197.9509 -34.9793    3.1  16.4  131.1   3.2540   3.7 ------	UNKNOWN
 48.7055 -84.4700    3.1  49.9    8.9   6.1776   3.8 ------	UNKNOWN
217.5099 -73.9650    3.2  28.6    5.4   2.9270   3.6 ------	UNKNOWN
207.5327  11.1885    2.8  57.0  179.0  17.4076   4.1 ------	UNKNOWN
235.0587 -15.6022    3.4  34.5 -136.2   4.0074   3.4 ------	UNKNOWN
Plot creation:
Sat Jul 30 07:23:12 EDT 2022