Estimated redshift from machine learning (Ukwatta et al. 2016) - may take a few minute to calcaulte
Image
Pre-slew 15.0-350.0 keV image (Event data)
#   RAcent    DECcent   POSerr    Theta     Phi              Peak Cts       SNR   Name
  210.6920    48.2092   0.0250    41.3006   -47.6301         1.8500243      7.711 TRIG_01015088

Foreground time interval of the image:
-44.432  13.616 (delta_t =  58.048 [sec])
Background time interval of the image:
-239.184 -44.432 (delta_t = 194.752 [sec])
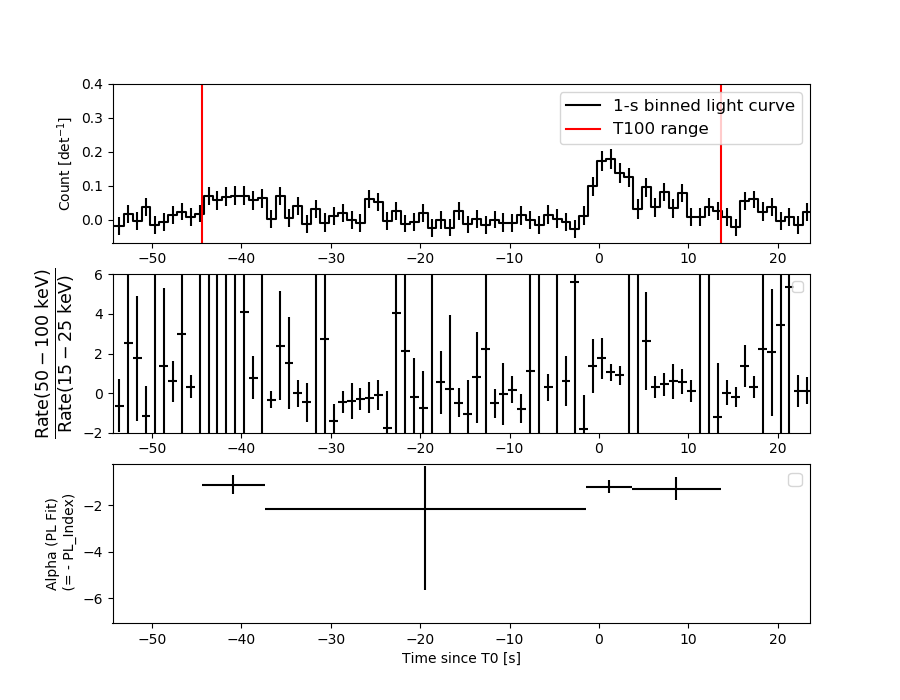
Lightcurves
Notes:
- 1) The mask-weighted light curves are using the flight position.
- 2) Multiple plots of different time binning/intervals are shown to cover all scenarios of short/long GRBs, rate/image triggers, and real/false positives.
- 3) For all the mask-weighted lightcurves, the y-axis units are counts/sec/det where a det is 0.4 x 0.4 = 0.16 sq cm.
- 4) The verticle lines correspond to following: green dotted lines are T50 interval, black dotted lines are T90 interval, blue solid line(s) is a spacecraft slew start time, and orange solid line(s) is a spacecraft slew end time.
- 5) Time of each bin is in the middle of the bin.
1 s binning
From T0-310 s to T0+310 s
From T100_start - 20 s to T100_end + 30 s
Full time interval
64 ms binning
Full time interval

From T100_start to T100_end

From T0-5 sec to T0+5 sec

16 ms binning
From T100_start-5 s to T100_start+5 s

Blue+Cyan dotted lines: Time interval of the scaled map
From 0.000000 to 4.096000
8 ms binning
From T100_start-3 s to T100_start+3 s
Blue+Cyan dotted lines: Time interval of the scaled map
From 0.000000 to 4.096000
2 ms binning
From T100_start-1 s to T100_start+1 s

Blue+Cyan dotted lines: Time interval of the scaled map
From 0.000000 to 4.096000
SN=5 or 10 sec. binning (whichever binning is satisfied first)
SN=5 or 10 sec. binning (T < 200 sec)
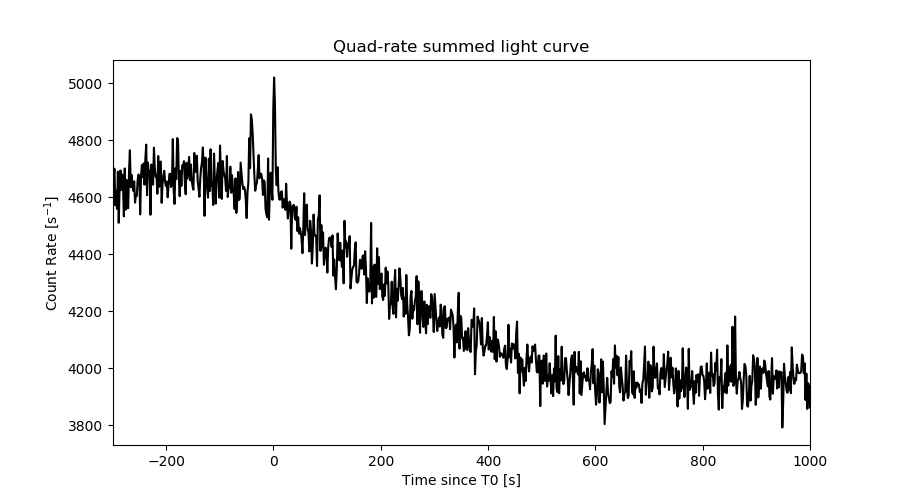
Quad-rate summed light curves (from T0-300s to T0+1000s)
Spectral Evolution
Spectra
Notes:
- 1) The fitting includes the systematic errors.
- 2) When the burst includes telescope slew time periods, the fitting uses an average response file made from multiple 5-s response files through out the slew time plus single time preiod for the non-slew times, and weighted by the total counts in the corresponding time period using addrmf. An average response file is needed becuase a spectral fit using the pre-slew DRM will introduce some errors in both a spectral shape and a normalization if the PHA file contains a lot of the slew/post-slew time interval.
- 3) For fits to more complicated models (e.g. a power-law over a cutoff power-law), the BAT team has decided to require a chi-square improvement of more than 6 for each extra dof.
Time averaged spectrum fit using the average DRM
Power-law model
Time interval is from  -44.432 sec. to   13.616 sec.

Spectral model in power-law:
------------------------------------------------------------
Parameters  : value       lower 90%   higher 90%
Photon index: 1.39779     ( -0.289722   0.287202 )
Norm@50keV  : 2.24462E-03    ( -0.000395816   0.00039519 )
------------------------------------------------------------
#Fit statistic  : Chi-Squared                   56.15     using 59 bins.
 Reduced chi-squared = 0.985088
# Null hypothesis probability of 5.07e-01 with 57 degrees of freedom

Photon flux (15-150 keV)    in 58.05 sec: 0.273221 ( -0.049403  0.049618 ) ph/cm2/s
Energy fluence (15-150 keV)             : 1.25977e-06 ( -2.39133e-07  2.41925e-07 ) ergs/cm2
Cutoff power-law model
Time interval is from  -44.432 sec. to   13.616 sec.
Spectral model in the cutoff power-law:
------------------------------------------------------------
Parameters  : value       lower 90%   higher 90%
Photon index: 0.140129     ( -1.89508   1.30002 )
Epeak [keV] : 73.9019      ( -20.6072 -73.9018 )
Norm@50keV  : 9.61273E-03    ( -0.00961279   0.0712921 )
------------------------------------------------------------
#Fit statistic  : Chi-Squared                   53.47     using 59 bins.
 Reduced chi-squared = 0.954821
# Null hypothesis probability of 5.71e-01 with 56 degrees of freedom

Photon flux (15-150 keV)    in 58.05 sec: 0.260139 ( -0.051644  0.051674 ) ph/cm2/s
Energy fluence (15-150 keV)             : 1.15431e-06 ( -2.5937e-07  2.68258e-07 ) ergs/cm2
Band function

Time interval is from  -44.432 sec. to   13.616 sec.


Spectral model in the Band function:
------------------------------------------------------------
Parameters  : value       lower 90%   higher 90%
alpha       :    (     )
beta        :     (     )
Epeak [keV] :       (   )
Norm@50keV   :     (     )
------------------------------------------------------------

Photon flux (15-150 keV)    in  sec:  (    ) ph/cm2/s
Energy fluence (15-150 keV)             : 0 ( 0  0 ) ergs/cm2
Single BB
Spectral model blackbody:
------------------------------------------------------------
Parameters  : value    Lower 90%  Upper 90%
kT [keV]    : 15.5604  (-2.72673  3.5148)
R^2/D10^2   : 2.89958E-02  (-0.014946   0.0282161)
(R is the radius in km and D10 is the distance to the source in units of 10 kpc)
------------------------------------------------------------
#Fit statistic  : Chi-Squared                   55.65     using 59 bins.
 Reduced chi-squared =
# Null hypothesis probability of 5.26e-01 with 57 degrees of freedom

Energy  Fluence     90% Error
[keV]   [erg/cm2]   [erg/cm2]
15- 25  8.476e-08   3.151e-08
25- 50  3.481e-07   9.442e-08
50-150  5.827e-07   2.183e-07
15-150  1.016e-06   2.575e-07
Thermal bremsstrahlung (OTTB)

Spectral model: thermal bremsstrahlung
------------------------------------------------------------
Parameters  : value         Lower 90%    Upper 90%
kT [keV]    : 199.363       (-86.0648      -199.363)
Norm        : 1.14064       (-0.199489     0.199481)
------------------------------------------------------------
#Fit statistic  : Chi-Squared                   55.75     using 59 bins.
 Reduced chi-squared =
# Null hypothesis probability of 5.22e-01 with 57 degrees of freedom

Energy  Fluence     90% Error
[keV]   [erg/cm2]   [erg/cm2]
15- 25  1.649e-07   9.358e-08
25- 50  3.172e-07   1.802e-07
50-150  6.956e-07   3.915e-07
15-150  1.178e-06   6.687e-07
Double BB
Spectral model: bbodyrad<1> + bbodyrad<2>
------------------------------------------------------------
Parameters  : value         Lower 90%    Upper 90%
kT1 [keV]   : 41.3574        (-40.2782      -40.2782)
R1^2/D10^2  : 5.39989E-04        (-0.000634801      0.0362969)
kT2 [keV]   : 11.7858        (-11.6097      5.37218)
R2^2/D10^2  : 5.87800E-02    (-0.0610306   -0.0610306)
------------------------------------------------------------
#Fit statistic  : Chi-Squared                   53.29     using 59 bins.
 Reduced chi-squared =
# Null hypothesis probability of 5.40e-01 with 55 degrees of freedom

Energy  Fluence     90% Error
[keV]   [erg/cm2]   [erg/cm2]
15- 25  1.137e-07   7.181e-08
25- 50  3.483e-07   2.034e-07
50-150  7.089e-07   3.971e-07
15-150  1.171e-06   6.264e-07
Peak spectrum fit
Power-law model

Time interval is from    0.412 sec. to    1.412 sec.

Spectral model in power-law:
------------------------------------------------------------
Parameters  : value       lower 90%   higher 90%
Photon index: 1.29081     ( -0.384326   0.373185 )
Norm@50keV  : 1.42338E-02    ( -0.0031852   0.00318007 )
------------------------------------------------------------
#Fit statistic  : Chi-Squared                   68.18     using 59 bins.
 Reduced chi-squared = 1.19614
# Null hypothesis probability of 1.48e-01 with 57 degrees of freedom

Photon flux (15-150 keV)    in 1 sec: 1.69531 ( -0.40186  0.40539 ) ph/cm2/s
Energy fluence (15-150 keV)             : 1.40991e-07 ( -3.29621e-08  3.30935e-08 ) ergs/cm2
Cutoff power-law model

Time interval is from    0.412 sec. to    1.412 sec.
Spectral model in the cutoff power-law:
------------------------------------------------------------
Parameters  : value       lower 90%   higher 90%
Photon index: 0.635939     ( -2.3029   0.912899 )
Epeak [keV] : 116.556      ( -116.546 -116.546 )
Norm@50keV  : 2.84916E-02    ( -0.0170574   0.255268 )
------------------------------------------------------------
#Fit statistic  : Chi-Squared                   67.76     using 59 bins.
 Reduced chi-squared = 1.21
# Null hypothesis probability of 1.35e-01 with 56 degrees of freedom

Photon flux (15-150 keV)    in 1 sec: 1.65476 ( -0.4099  0.41883 ) ph/cm2/s
Energy fluence (15-150 keV)             : 1.37749e-07 ( -2.05403e-08  3.44339e-08 ) ergs/cm2
Band function

Time interval is from    0.412 sec. to    1.412 sec.


Spectral model in the Band function:
------------------------------------------------------------
Parameters  : value       lower 90%   higher 90%
alpha       :    (     )
beta        :     (     )
Epeak [keV] :       (   )
Norm@50keV   :     (     )
------------------------------------------------------------

Photon flux (15-150 keV)    in  sec:  (    ) ph/cm2/s
Energy fluence (15-150 keV)             : 0 ( 0  0 ) ergs/cm2
Single BB
Spectral model blackbody:
------------------------------------------------------------
Parameters  : value    Lower 90%  Upper 90%
kT [keV]    : 18.6087  (-4.27219  5.89817)
R^2/D10^2   : 0.100423  (-0.0617344   0.143894)
(R is the radius in km and D10 is the distance to the source in units of 10 kpc)
------------------------------------------------------------
#Fit statistic  : Chi-Squared                   70.12     using 59 bins.
 Reduced chi-squared =
# Null hypothesis probability of 1.14e-01 with 57 degrees of freedom

Energy  Fluence     90% Error
[keV]   [erg/cm2]   [erg/cm2]
15- 25  6.886e-09   3.144e-09
25- 50  3.263e-08   1.357e-08
50-150  8.268e-08   3.472e-08
15-150  1.222e-07   4.244e-08
Thermal bremsstrahlung (OTTB)

Spectral model: thermal bremsstrahlung
------------------------------------------------------------
Parameters  : value         Lower 90%    Upper 90%
kT [keV]    : 199.363       (-84.2888      -199.363)
Norm        : 7.19576       (-1.62272     1.62279)
------------------------------------------------------------
#Fit statistic  : Chi-Squared                   69.48     using 59 bins.
 Reduced chi-squared =
# Null hypothesis probability of 1.24e-01 with 57 degrees of freedom

Energy  Fluence     90% Error
[keV]   [erg/cm2]   [erg/cm2]
15- 25  1.792e-08   1.063e-08
25- 50  3.447e-08   2.024e-08
50-150  7.559e-08   4.440e-08
15-150  1.280e-07   7.475e-08
Double BB
Spectral model: bbodyrad<1> + bbodyrad<2>
------------------------------------------------------------
Parameters  : value         Lower 90%    Upper 90%
kT1 [keV]   : 200.000        (-200      -200)
R1^2/D10^2  : 1.76065E-04        (-0.000176114      -0.000176114)
kT2 [keV]   : 13.8239        (-2.76651      6.55428)
R2^2/D10^2  : 0.227586    (-0.151013   0.125179)
------------------------------------------------------------
#Fit statistic  : Chi-Squared                   67.53     using 59 bins.
 Reduced chi-squared =
# Null hypothesis probability of 1.20e-01 with 55 degrees of freedom

Energy  Fluence     90% Error
[keV]   [erg/cm2]   [erg/cm2]
15- 25  1.024e-08   3.704e-09
25- 50  3.084e-08   1.386e-08
50-150  8.493e-08   4.046e-08
15-150  1.260e-07   5.172e-08
Pre-slew spectrum (Pre-slew PHA with pre-slew DRM)
Power-law model

Spectral model in power-law:
------------------------------------------------------------
Parameters  : value       lower 90%   higher 90%
Photon index: 1.39779     ( -0.289722   0.287202 )
Norm@50keV  : 2.24462E-03    ( -0.000395816   0.00039519 )
------------------------------------------------------------
#Fit statistic  : Chi-Squared                   56.15     using 59 bins.
 Reduced chi-squared =
# Null hypothesis probability of 5.07e-01 with 57 degrees of freedom

Photon flux (15-150 keV)    in 58.05 sec: 0.273216 ( -0.0494007  0.0496156 ) ph/cm2/s
Energy fluence (15-150 keV)             : 1.25957e-06 ( -2.39028e-07  2.42147e-07 ) ergs/cm2
Cutoff power-law model

Spectral model in the cutoff power-law:
------------------------------------------------------------
Parameters  : value       lower 90%   higher 90%
Photon index: 0.140130     ( -1.89508   1.30002 )
Epeak [keV] : 73.9020      ( -20.6072 -73.9018 )
Norm@50keV  : 9.61272E-03    ( -0.00961279   0.0712922 )
------------------------------------------------------------
#Fit statistic  : Chi-Squared                   53.47     using 59 bins.
 Reduced chi-squared =
# Null hypothesis probability of 5.71e-01 with 56 degrees of freedom

Photon flux (15-150 keV)    in 58.05 sec: 0.260121 ( -0.051636  0.051663 ) ph/cm2/s
Energy fluence (15-150 keV)             : 1.15474e-06 ( -2.59472e-07  2.68522e-07 ) ergs/cm2
Band function
Spectral model in the Band function:
------------------------------------------------------------
Parameters  : value       lower 90%   higher 90%
alpha       :    (     )
beta        :     (     )
Epeak [keV] :       (   )
Norm@50keV   :     (     )
------------------------------------------------------------

Photon flux (15-150 keV)    in  sec:  (    ) ph/cm2/s
Energy fluence (15-150 keV)             : 0 ( 0  0 ) ergs/cm2
S(25-50 keV) vs. S(50-100 keV) plot

S(25-50 keV)  = 2.95e-07
S(50-100 keV) = 4.49e-07
T90 vs. Hardness ratio plot

T90                                   = 53.2479999065399 sec.
Hardness ratio (energy fluence ratio) = 1.52203
Color vs. Color plot
Count Ratio  (25-50 keV) / (15-25 keV) = 2.1094
Count Ratio (50-100 keV) / (15-25 keV) = 1.41523
Mask shadow pattern
IMX = 5.920610100434884E-01, IMY = 6.490742208579083E-01
TIME vs. PHA plot around the trigger time

Blue+Cyan dotted lines: Time interval of the scaled map
From 0.000000 to 4.096000
TIME vs. DetID plot around the trigger time
Blue+Cyan dotted lines: Time interval of the scaled map
From 0.000000 to 4.096000
100 us light curve (15-350 keV)
Blue+Cyan dotted lines: Time interval of the scaled map
From 0.000000 to 4.096000
Spacecraft aspect plot
Bright source in the pre-burst/pre-slew/post-slew images
Pre-burst image of 15-350 keV band
Time interval of the image:
-239.184000 -44.432000

# RAcent  DECcent POSerr Theta    Phi  PeakCts   SNR AngSep     Name
#  [deg]    [deg]    ['] [deg]  [deg]                   [']
159.8449  22.2857    3.0  51.3   19.3   3.0455   3.9 ------	UNKNOWN
192.6608  25.3320    4.0  56.5  -17.7   3.4236   2.9 ------	UNKNOWN
Pre-slew background subtracted image of 15-350 keV band
Time interval of the image:
-44.432000 13.616000

# RAcent  DECcent POSerr Theta    Phi  PeakCts   SNR AngSep     Name
#  [deg]    [deg]    ['] [deg]  [deg]                   [']
160.5954  19.4793    2.3  54.2   19.1   2.5707   5.0 ------	UNKNOWN
210.6920  48.2092    1.5  41.3  -47.6   1.8491   7.7 ------	UNKNOWN
Post-slew image of 15-350 keV band
Time interval of the image:
95.516600 962.894500

# RAcent  DECcent POSerr Theta    Phi  PeakCts   SNR AngSep     Name
#  [deg]    [deg]    ['] [deg]  [deg]                   [']
254.4358  35.2926    2.1  34.6 -115.5   7.3135   5.4    3.2	Her X-1
132.3667  69.3607    2.6  41.8  117.9  13.5011   4.4 ------	UNKNOWN
157.7173  41.2733    3.1  37.5   68.7   6.3926   3.8 ------	UNKNOWN
 36.0669  82.7957    2.6  49.0  148.1  15.0519   4.5 ------	UNKNOWN
168.9617  58.8728    3.9  26.4   98.5   3.0770   3.0 ------	UNKNOWN
182.8603  -3.0509    3.1  56.7    2.9  11.7661   3.7 ------	UNKNOWN
323.7940  62.9450    2.9  57.0  179.0  17.0544   4.0 ------	UNKNOWN
213.1260  30.2339    2.4  18.1  -37.8   3.8033   4.9 ------	UNKNOWN
219.9443  -2.1461    3.2  51.0  -42.9  11.6879   3.7 ------	UNKNOWN
277.4819  36.4337    3.5  49.2 -133.1  12.0660   3.3 ------	UNKNOWN
Plot creation:
Sat Jul 30 07:21:36 EDT 2022