Estimated redshift from machine learning (Ukwatta et al. 2016) - may take a few minute to calcaulte
Image
Pre-slew 15.0-350.0 keV image (Event data)
#   RAcent    DECcent   POSerr    Theta     Phi              Peak Cts       SNR   Name
  235.7457   -37.2326   0.0055    30.1407  -151.6118         7.0614982     34.876 TRIG_01015728

Foreground time interval of the image:
 -2.068  97.364 (delta_t =  99.432 [sec])
Background time interval of the image:
-239.632  -2.068 (delta_t = 237.564 [sec])
Lightcurves
Notes:
- 1) The mask-weighted light curves are using the flight position.
- 2) Multiple plots of different time binning/intervals are shown to cover all scenarios of short/long GRBs, rate/image triggers, and real/false positives.
- 3) For all the mask-weighted lightcurves, the y-axis units are counts/sec/det where a det is 0.4 x 0.4 = 0.16 sq cm.
- 4) The verticle lines correspond to following: green dotted lines are T50 interval, black dotted lines are T90 interval, blue solid line(s) is a spacecraft slew start time, and orange solid line(s) is a spacecraft slew end time.
- 5) Time of each bin is in the middle of the bin.
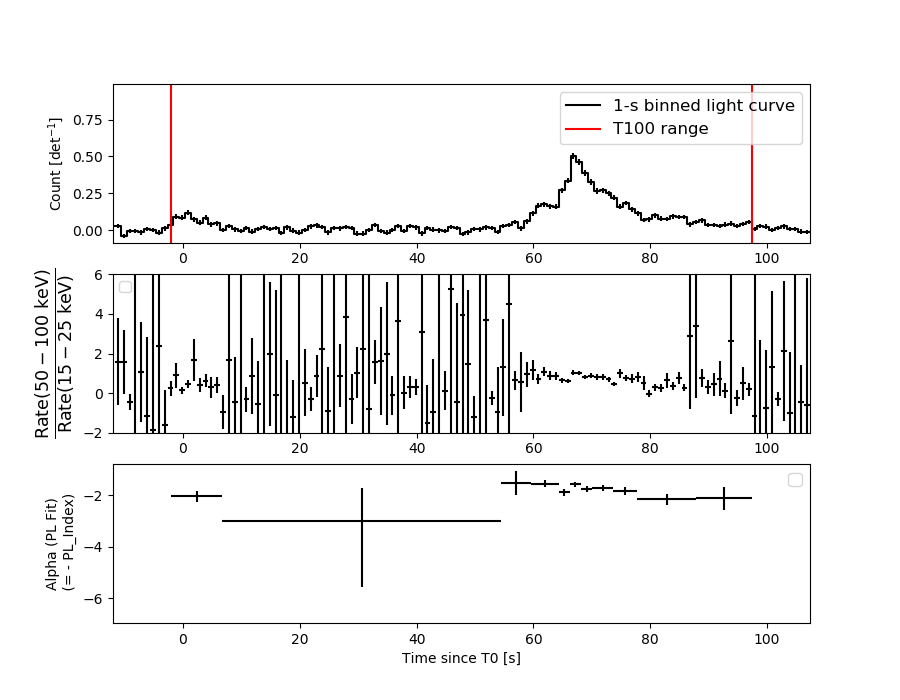
1 s binning
From T0-310 s to T0+310 s
From T100_start - 20 s to T100_end + 30 s
Full time interval
64 ms binning
Full time interval
From T100_start to T100_end
From T0-5 sec to T0+5 sec
16 ms binning
From T100_start-5 s to T100_start+5 s
Blue+Cyan dotted lines: Time interval of the scaled map
From 0.000000 to 1.024000
8 ms binning
From T100_start-3 s to T100_start+3 s
Blue+Cyan dotted lines: Time interval of the scaled map
From 0.000000 to 1.024000
2 ms binning
From T100_start-1 s to T100_start+1 s
Blue+Cyan dotted lines: Time interval of the scaled map
From 0.000000 to 1.024000
SN=5 or 10 sec. binning (whichever binning is satisfied first)
SN=5 or 10 sec. binning (T < 200 sec)
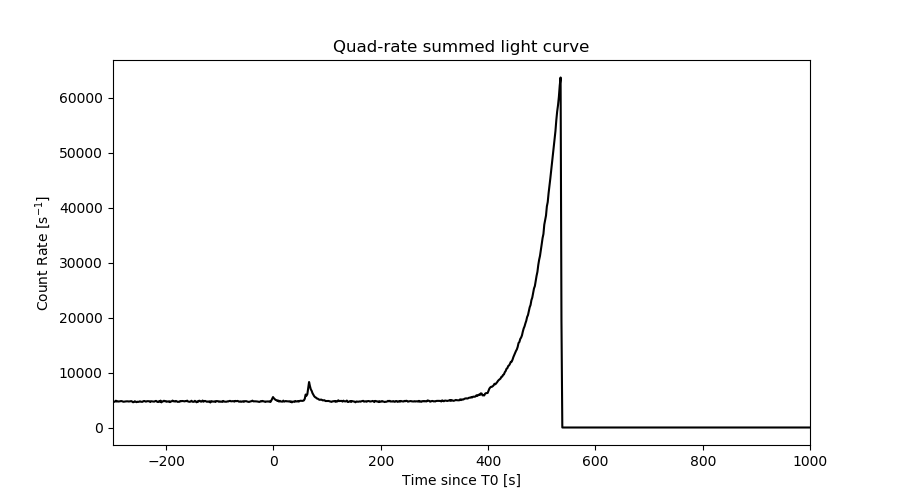
Quad-rate summed light curves (from T0-300s to T0+1000s)
Spectral Evolution
Spectra
Notes:
- 1) The fitting includes the systematic errors.
- 2) When the burst includes telescope slew time periods, the fitting uses an average response file made from multiple 5-s response files through out the slew time plus single time preiod for the non-slew times, and weighted by the total counts in the corresponding time period using addrmf. An average response file is needed becuase a spectral fit using the pre-slew DRM will introduce some errors in both a spectral shape and a normalization if the PHA file contains a lot of the slew/post-slew time interval.
- 3) For fits to more complicated models (e.g. a power-law over a cutoff power-law), the BAT team has decided to require a chi-square improvement of more than 6 for each extra dof.
Time averaged spectrum fit using the average DRM
Power-law model

Time interval is from   -2.068 sec. to   97.364 sec.

Spectral model in power-law:
------------------------------------------------------------
Parameters  : value       lower 90%   higher 90%
Photon index: 1.87756     ( -0.0811261   0.0821029 )
Norm@50keV  : 4.26524E-03    ( -0.000193647   0.000192383 )
------------------------------------------------------------
#Fit statistic  : Chi-Squared                   47.02     using 59 bins.
 Reduced chi-squared = 0.824912
# Null hypothesis probability of 8.24e-01 with 57 degrees of freedom

Photon flux (15-150 keV)    in 99.43 sec: 0.606395 ( -0.026342  0.026414 ) ph/cm2/s
Energy fluence (15-150 keV)             : 3.89931e-06 ( -1.76097e-07  1.77005e-07 ) ergs/cm2
Cutoff power-law model
Time interval is from   -2.068 sec. to   97.364 sec.
Spectral model in the cutoff power-law:
------------------------------------------------------------
Parameters  : value       lower 90%   higher 90%
Photon index: 1.72688     ( -0.324039   0.311201 )
Epeak [keV] : 84.7894      ( -26.0645 -84.79 )
Norm@50keV  : 5.11729E-03    ( -0.00153225   0.00239426 )
------------------------------------------------------------
#Fit statistic  : Chi-Squared                   46.31     using 59 bins.
 Reduced chi-squared = 0.826964
# Null hypothesis probability of 8.19e-01 with 56 degrees of freedom

Photon flux (15-150 keV)    in 99.43 sec: 0.600161 ( -0.029039  0.029078 ) ph/cm2/s
Energy fluence (15-150 keV)             : 3.83979e-06 ( -2.12205e-07  2.10422e-07 ) ergs/cm2
Band function

Time interval is from   -2.068 sec. to   97.364 sec.


Spectral model in the Band function:
------------------------------------------------------------
Parameters  : value       lower 90%   higher 90%
alpha       :    (     )
beta        :     (     )
Epeak [keV] :       (   )
Norm@50keV   :     (     )
------------------------------------------------------------

Photon flux (15-150 keV)    in  sec:  (    ) ph/cm2/s
Energy fluence (15-150 keV)             : 0 ( 0  0 ) ergs/cm2
Single BB
Spectral model blackbody:
------------------------------------------------------------
Parameters  : value    Lower 90%  Upper 90%
kT [keV]    : 11.6057  (  )
R^2/D10^2   : 0.153392  (   )
(R is the radius in km and D10 is the distance to the source in units of 10 kpc)
------------------------------------------------------------
#Fit statistic  : Chi-Squared                  183.33     using 59 bins.
 Reduced chi-squared =
# Null hypothesis probability of 3.51e-15 with 57 degrees of freedom

Energy  Fluence     90% Error
[keV]   [erg/cm2]   [erg/cm2]
15- 25  4.330e-07   3.251e-08
25- 50  1.309e-06   6.562e-08
50-150  1.036e-06   1.058e-07
15-150  2.778e-06   1.293e-07
Thermal bremsstrahlung (OTTB)
Spectral model: thermal bremsstrahlung
------------------------------------------------------------
Parameters  : value         Lower 90%    Upper 90%
kT [keV]    : 91.9205       (-13.5764      17.6962)
Norm        : 2.67459       (-0.176765     0.195157)
------------------------------------------------------------
#Fit statistic  : Chi-Squared                   50.73     using 59 bins.
 Reduced chi-squared =
# Null hypothesis probability of 7.08e-01 with 57 degrees of freedom

Energy  Fluence     90% Error
[keV]   [erg/cm2]   [erg/cm2]
15- 25  6.943e-07   5.200e-08
25- 50  1.180e-06   5.568e-08
50-150  1.820e-06   4.927e-07
15-150  3.694e-06   4.847e-07
Double BB
Spectral model: bbodyrad<1> + bbodyrad<2>
------------------------------------------------------------
Parameters  : value         Lower 90%    Upper 90%
kT1 [keV]   : 6.86366        (-0.775291      0.7961)
R1^2/D10^2  : 0.837417        (-0.268366      0.45511)
kT2 [keV]   : 25.8884        (-4.12145      6.07786)
R2^2/D10^2  : 5.64405E-03    (-0.00294519   0.00519597)
------------------------------------------------------------
#Fit statistic  : Chi-Squared                   45.97     using 59 bins.
 Reduced chi-squared =
# Null hypothesis probability of 8.02e-01 with 55 degrees of freedom

Energy  Fluence     90% Error
[keV]   [erg/cm2]   [erg/cm2]
15- 25  6.813e-07   8.069e-08
25- 50  1.183e-06   1.039e-07
50-150  1.954e-06   4.335e-07
15-150  3.819e-06   5.573e-07
Peak spectrum fit
Power-law model

Time interval is from   66.712 sec. to   67.712 sec.

Spectral model in power-law:
------------------------------------------------------------
Parameters  : value       lower 90%   higher 90%
Photon index: 1.59460     ( -0.111434   0.112768 )
Norm@50keV  : 3.44685E-02    ( -0.00238807   0.00237525 )
------------------------------------------------------------
#Fit statistic  : Chi-Squared                   42.82     using 59 bins.
 Reduced chi-squared = 0.751228
# Null hypothesis probability of 9.18e-01 with 57 degrees of freedom

Photon flux (15-150 keV)    in 1 sec: 4.42213 ( -0.29566  0.2959 ) ph/cm2/s
Energy fluence (15-150 keV)             : 3.22612e-07 ( -2.395e-08  2.41249e-08 ) ergs/cm2
Cutoff power-law model
Time interval is from   66.712 sec. to   67.712 sec.
Spectral model in the cutoff power-law:
------------------------------------------------------------
Parameters  : value       lower 90%   higher 90%
Photon index: 0.939289     ( -0.516183   0.4603 )
Epeak [keV] : 77.5780      ( -16.3598 67.7537 )
Norm@50keV  : 7.60060E-02    ( -0.0317919   0.0640536 )
------------------------------------------------------------
#Fit statistic  : Chi-Squared                   36.65     using 59 bins.
 Reduced chi-squared = 0.654464
# Null hypothesis probability of 9.79e-01 with 56 degrees of freedom

Photon flux (15-150 keV)    in 1 sec: 4.31080 ( -0.30595  0.30585 ) ph/cm2/s
Energy fluence (15-150 keV)             : 3.06606e-07 ( -2.63854e-08  2.65748e-08 ) ergs/cm2
Band function

Time interval is from   66.712 sec. to   67.712 sec.


Spectral model in the Band function:
------------------------------------------------------------
Parameters  : value       lower 90%   higher 90%
alpha       :    (     )
beta        :     (     )
Epeak [keV] :       (   )
Norm@50keV   :     (     )
------------------------------------------------------------

Photon flux (15-150 keV)    in  sec:  (    ) ph/cm2/s
Energy fluence (15-150 keV)             : 0 ( 0  0 ) ergs/cm2
Single BB
Spectral model blackbody:
------------------------------------------------------------
Parameters  : value    Lower 90%  Upper 90%
kT [keV]    : 13.6663  (-1.06696  1.17089)
R^2/D10^2   : 0.694753  (-0.178485   0.236826)
(R is the radius in km and D10 is the distance to the source in units of 10 kpc)
------------------------------------------------------------
#Fit statistic  : Chi-Squared                   76.33     using 59 bins.
 Reduced chi-squared =
# Null hypothesis probability of 4.46e-02 with 57 degrees of freedom

Energy  Fluence     90% Error
[keV]   [erg/cm2]   [erg/cm2]
15- 25  2.746e-08   3.555e-09
25- 50  9.969e-08   8.160e-09
50-150  1.210e-07   1.690e-08
15-150  2.482e-07   1.940e-08
Thermal bremsstrahlung (OTTB)

Spectral model: thermal bremsstrahlung
------------------------------------------------------------
Parameters  : value         Lower 90%    Upper 90%
kT [keV]    : 165.632       (-45.0331      -166.13)
Norm        : 18.2180       (-1.31185     1.44402)
------------------------------------------------------------
#Fit statistic  : Chi-Squared                   37.93     using 59 bins.
 Reduced chi-squared =
# Null hypothesis probability of 9.76e-01 with 57 degrees of freedom

Energy  Fluence     90% Error
[keV]   [erg/cm2]   [erg/cm2]
15- 25  4.636e-08   4.230e-09
25- 50  8.713e-08   1.720e-08
50-150  1.789e-07   7.581e-08
15-150  3.124e-07   9.665e-08
Double BB

Spectral model: bbodyrad<1> + bbodyrad<2>
------------------------------------------------------------
Parameters  : value         Lower 90%    Upper 90%
kT1 [keV]   : 6.96327        (-1.47689      1.71834)
R1^2/D10^2  : 4.60310        (-2.2611      5.56912)
kT2 [keV]   : 22.9331        (-4.19611      7.60144)
R2^2/D10^2  : 8.12206E-02    (-0.0540057   0.0565388)
------------------------------------------------------------
#Fit statistic  : Chi-Squared                   35.21     using 59 bins.
 Reduced chi-squared =
# Null hypothesis probability of 9.83e-01 with 55 degrees of freedom

Energy  Fluence     90% Error
[keV]   [erg/cm2]   [erg/cm2]
15- 25  4.341e-08   1.372e-08
25- 50  9.033e-08   1.867e-08
50-150  1.728e-07   6.832e-08
15-150  3.066e-07   9.265e-08
Pre-slew spectrum (Pre-slew PHA with pre-slew DRM)
Power-law model
Spectral model in power-law:
------------------------------------------------------------
Parameters  : value       lower 90%   higher 90%
Photon index: 1.87756     ( -0.0811261   0.0821029 )
Norm@50keV  : 4.26524E-03    ( -0.000193647   0.000192383 )
------------------------------------------------------------
#Fit statistic  : Chi-Squared                   47.02     using 59 bins.
 Reduced chi-squared =
# Null hypothesis probability of 8.24e-01 with 57 degrees of freedom

Photon flux (15-150 keV)    in 99.43 sec: 0.606359 ( -0.0263382  0.02641 ) ph/cm2/s
Energy fluence (15-150 keV)             : 3.89866e-06 ( -1.76104e-07  1.77025e-07 ) ergs/cm2
Cutoff power-law model

Spectral model in the cutoff power-law:
------------------------------------------------------------
Parameters  : value       lower 90%   higher 90%
Photon index: 1.72688     ( -0.324039   0.311201 )
Epeak [keV] : 84.7889      ( -26.0598 -84.79 )
Norm@50keV  : 5.11729E-03    ( -0.00153225   0.00239426 )
------------------------------------------------------------
#Fit statistic  : Chi-Squared                   46.31     using 59 bins.
 Reduced chi-squared =
# Null hypothesis probability of 8.19e-01 with 56 degrees of freedom

Photon flux (15-150 keV)    in 99.43 sec: 0.600030 ( -0.02902  0.028938 ) ph/cm2/s
Energy fluence (15-150 keV)             : 3.84084e-06 ( -2.12273e-07  2.11159e-07 ) ergs/cm2
Band function
Spectral model in the Band function:
------------------------------------------------------------
Parameters  : value       lower 90%   higher 90%
alpha       :    (     )
beta        :     (     )
Epeak [keV] :       (   )
Norm@50keV   :     (     )
------------------------------------------------------------

Photon flux (15-150 keV)    in  sec:  (    ) ph/cm2/s
Energy fluence (15-150 keV)             : 0 ( 0  0 ) ergs/cm2
S(25-50 keV) vs. S(50-100 keV) plot
S(25-50 keV)  = 1.13e-06
S(50-100 keV) = 1.23e-06
T90 vs. Hardness ratio plot
T90                                   = 87.231999874115 sec.
Hardness ratio (energy fluence ratio) = 1.0885
Color vs. Color plot
Count Ratio  (25-50 keV) / (15-25 keV) = 1.17821
Count Ratio (50-100 keV) / (15-25 keV) = 0.650196
Mask shadow pattern
IMX = -5.108070927266599E-01, IMY = 2.760563595252863E-01
TIME vs. PHA plot around the trigger time
Blue+Cyan dotted lines: Time interval of the scaled map
From 0.000000 to 1.024000
TIME vs. DetID plot around the trigger time
Blue+Cyan dotted lines: Time interval of the scaled map
From 0.000000 to 1.024000
100 us light curve (15-350 keV)
Blue+Cyan dotted lines: Time interval of the scaled map
From 0.000000 to 1.024000
Spacecraft aspect plot
Bright source in the pre-burst/pre-slew/post-slew images
Pre-burst image of 15-350 keV band
Time interval of the image:
-239.632000 -2.068000

# RAcent  DECcent POSerr Theta    Phi  PeakCts   SNR AngSep     Name
#  [deg]    [deg]    ['] [deg]  [deg]                   [']
170.4615 -60.5101   11.6  27.3   98.6   0.4773   1.0    8.0	Cen X-3
186.7243 -62.6972    6.9  19.9  106.1   0.6108   1.7    4.8	GX 301-2
245.0279 -15.6776    3.3  52.2 -141.0   4.8995   3.5    3.6	Sco X-1
255.9692 -38.0278    0.0  31.9 -120.4   0.2004   0.4   11.0	4U 1700-377
256.3666 -36.4495   19.4  33.5 -120.7   0.2662   0.6    3.7	GX 349+2
264.6077 -44.3578    4.8  28.2 -103.8   1.0087   2.4    8.0	4U 1735-44
262.9445 -33.8608  115.6  37.5 -113.1   0.0710   0.1    2.7	GX 354-0
206.4748 -67.7876    2.4  10.3  100.2   1.3694   4.9 ------	UNKNOWN
208.3508 -24.4514    2.3  45.7  172.1   3.4312   4.9 ------	UNKNOWN
235.6190 -44.8199    3.0  22.6 -151.3   1.1267   3.9 ------	UNKNOWN
241.8985 -12.3998    3.8  55.2 -145.1   5.0738   3.0 ------	UNKNOWN
Pre-slew background subtracted image of 15-350 keV band
Time interval of the image:
-2.068000 97.364000

# RAcent  DECcent POSerr Theta    Phi  PeakCts   SNR AngSep     Name
#  [deg]    [deg]    ['] [deg]  [deg]                   [']
170.4606 -60.5098    4.0  27.3   98.6  -0.7512  -2.9    8.0	Cen X-3
186.3867 -62.7817    8.0  19.9  105.6   0.2917   1.4    7.4	GX 301-2
244.9855 -15.6618   19.1  52.2 -141.1  -0.4606  -0.6    1.3	Sco X-1
255.8953 -37.7308   11.1  32.1 -120.7   0.2750   1.0    8.1	4U 1700-377
256.3052 -36.4147    6.7  33.5 -120.8  -0.4774  -1.7    6.3	GX 349+2
265.0192 -44.4224   34.4  28.2 -103.2   0.0859   0.3   12.0	4U 1735-44
262.7847 -33.8249    9.0  37.5 -113.3   0.5169   1.3   10.2	GX 354-0
235.7458 -37.2326    0.3  30.1 -151.6   7.0618  34.9 ------	UNKNOWN
Post-slew image of 15-350 keV band
Time interval of the image:
495.768630 542.538000

# RAcent  DECcent POSerr Theta    Phi  PeakCts   SNR AngSep     Name
#  [deg]    [deg]    ['] [deg]  [deg]                   [']
350.6208  19.9527    2.5  50.1   15.0  23.4856   4.5 ------	UNKNOWN
286.4815 -58.1544    2.9  49.2 -133.1  41.6602   3.9 ------	UNKNOWN
Plot creation:
Sat Jul 30 07:21:03 EDT 2022