Estimated redshift from machine learning (Ukwatta et al. 2016) - may take a few minute to calcaulte
Image
Pre-slew 15.0-350.0 keV image (Event data)
#   RAcent    DECcent   POSerr    Theta     Phi              Peak Cts       SNR   Name
  103.7710    64.6747   0.0036    20.0461   -49.8385         3.6084321     54.018 TRIG_01015873

Foreground time interval of the image:
 -1.000   9.925 (delta_t =  10.924 [sec])
Background time interval of the image:
-239.376  -1.000 (delta_t = 238.376 [sec])
Lightcurves
Notes:
- 1) The mask-weighted light curves are using the flight position.
- 2) Multiple plots of different time binning/intervals are shown to cover all scenarios of short/long GRBs, rate/image triggers, and real/false positives.
- 3) For all the mask-weighted lightcurves, the y-axis units are counts/sec/det where a det is 0.4 x 0.4 = 0.16 sq cm.
- 4) The verticle lines correspond to following: green dotted lines are T50 interval, black dotted lines are T90 interval, blue solid line(s) is a spacecraft slew start time, and orange solid line(s) is a spacecraft slew end time.
- 5) Time of each bin is in the middle of the bin.
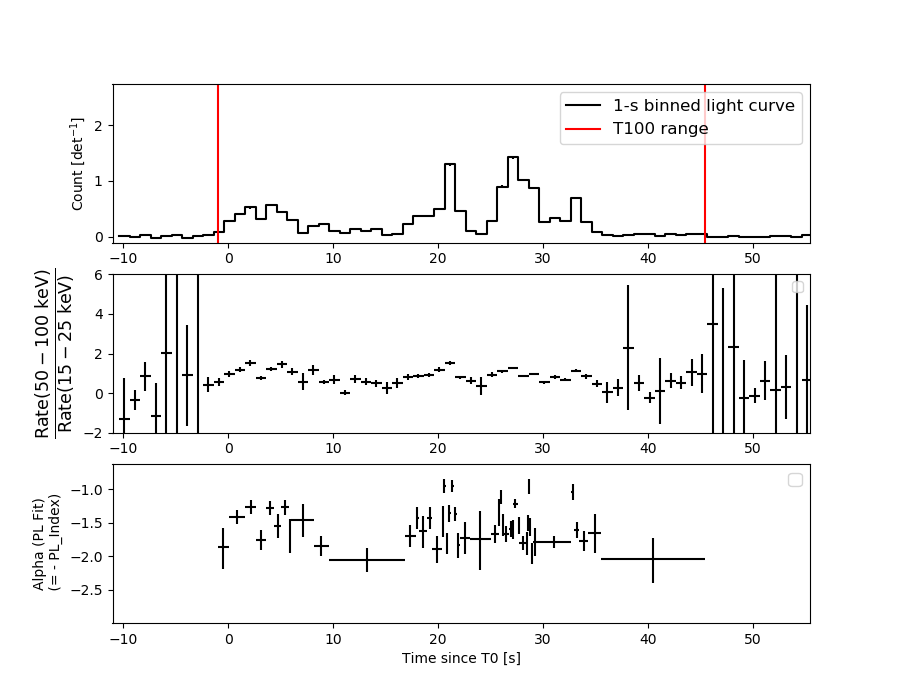
1 s binning
From T0-310 s to T0+310 s

From T100_start - 20 s to T100_end + 30 s
Full time interval
64 ms binning
Full time interval
From T100_start to T100_end
From T0-5 sec to T0+5 sec

16 ms binning
From T100_start-5 s to T100_start+5 s
Blue+Cyan dotted lines: Time interval of the scaled map
From 0.000000 to 0.512000
8 ms binning
From T100_start-3 s to T100_start+3 s
Blue+Cyan dotted lines: Time interval of the scaled map
From 0.000000 to 0.512000
2 ms binning
From T100_start-1 s to T100_start+1 s
Blue+Cyan dotted lines: Time interval of the scaled map
From 0.000000 to 0.512000
SN=5 or 10 sec. binning (whichever binning is satisfied first)
SN=5 or 10 sec. binning (T < 200 sec)
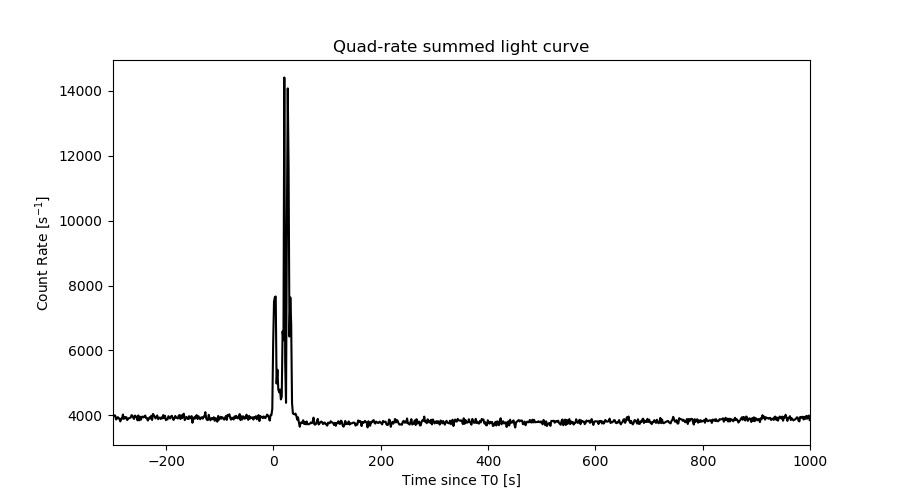
Quad-rate summed light curves (from T0-300s to T0+1000s)
Spectral Evolution
Spectra
Notes:
- 1) The fitting includes the systematic errors.
- 2) When the burst includes telescope slew time periods, the fitting uses an average response file made from multiple 5-s response files through out the slew time plus single time preiod for the non-slew times, and weighted by the total counts in the corresponding time period using addrmf. An average response file is needed becuase a spectral fit using the pre-slew DRM will introduce some errors in both a spectral shape and a normalization if the PHA file contains a lot of the slew/post-slew time interval.
- 3) For fits to more complicated models (e.g. a power-law over a cutoff power-law), the BAT team has decided to require a chi-square improvement of more than 6 for each extra dof.
Time averaged spectrum fit using the average DRM
Power-law model
Time interval is from   -1.000 sec. to   45.404 sec.

Spectral model in power-law:
------------------------------------------------------------
Parameters  : value       lower 90%   higher 90%
Photon index: 1.53107     ( -0.0351021   0.0350865 )
Norm@50keV  : 1.97015E-02    ( -0.00035265   0.000352528 )
------------------------------------------------------------
#Fit statistic  : Chi-Squared                   41.15     using 59 bins.
 Reduced chi-squared = 0.72193
# Null hypothesis probability of 9.44e-01 with 57 degrees of freedom

Photon flux (15-150 keV)    in 46.4 sec: 2.48072 ( -0.05296  0.05318 ) ph/cm2/s
Energy fluence (15-150 keV)             : 8.63096e-06 ( -1.5599e-07  1.5599e-07 ) ergs/cm2
Cutoff power-law model

Time interval is from   -1.000 sec. to   45.404 sec.
Spectral model in the cutoff power-law:
------------------------------------------------------------
Parameters  : value       lower 90%   higher 90%
Photon index: 1.45493     ( -0.141735   0.103675 )
Epeak [keV] : 413.608      ( -413.836 -413.836 )
Norm@50keV  : 2.12571E-02    ( -0.0020298   0.00314021 )
------------------------------------------------------------
#Fit statistic  : Chi-Squared                   40.28     using 59 bins.
 Reduced chi-squared = 0.719286
# Null hypothesis probability of 9.44e-01 with 56 degrees of freedom

Photon flux (15-150 keV)    in 46.4 sec: 2.46323 ( -0.061  0.05837 ) ph/cm2/s
Energy fluence (15-150 keV)             : 8.58952e-06 ( -1.72703e-07  1.62895e-07 ) ergs/cm2
Band function

Time interval is from   -1.000 sec. to   45.404 sec.


Spectral model in the Band function:
------------------------------------------------------------
Parameters  : value       lower 90%   higher 90%
alpha       :    (     )
beta        :     (     )
Epeak [keV] :       (   )
Norm@50keV   :     (     )
------------------------------------------------------------

Photon flux (15-150 keV)    in  sec:  (    ) ph/cm2/s
Energy fluence (15-150 keV)             : 0 ( 0  0 ) ergs/cm2
Single BB

Spectral model blackbody:
------------------------------------------------------------
Parameters  : value    Lower 90%  Upper 90%
kT [keV]    : 17.5418  (  )
R^2/D10^2   : 0.153182  (   )
(R is the radius in km and D10 is the distance to the source in units of 10 kpc)
------------------------------------------------------------
#Fit statistic  : Chi-Squared                  695.42     using 59 bins.
 Reduced chi-squared =
# Null hypothesis probability of 1.42e-110 with 57 degrees of freedom

Energy  Fluence     90% Error
[keV]   [erg/cm2]   [erg/cm2]
15- 25  4.414e-07   1.633e-08
25- 50  2.002e-06   5.568e-08
50-150  4.440e-06   1.371e-07
15-150  6.883e-06   1.322e-07
Thermal bremsstrahlung (OTTB)
Spectral model: thermal bremsstrahlung
------------------------------------------------------------
Parameters  : value         Lower 90%    Upper 90%
kT [keV]    : 200.000       (-4.95221      -200)
Norm        : 10.1269       (-0.180286     0.180286)
------------------------------------------------------------
#Fit statistic  : Chi-Squared                   60.66     using 59 bins.
 Reduced chi-squared =
# Null hypothesis probability of 3.45e-01 with 57 degrees of freedom

Energy  Fluence     90% Error
[keV]   [erg/cm2]   [erg/cm2]
15- 25  1.170e-06   2.575e-08
25- 50  2.252e-06   4.802e-08
50-150  4.938e-06   1.021e-07
15-150  8.360e-06   1.694e-07
Double BB
Spectral model: bbodyrad<1> + bbodyrad<2>
------------------------------------------------------------
Parameters  : value         Lower 90%    Upper 90%
kT1 [keV]   : 8.34976        (-0.578057      0.60236)
R1^2/D10^2  : 1.39608        (-0.286293      0.386239)
kT2 [keV]   : 31.9374        (-2.49971      3.15117)
R2^2/D10^2  : 1.51346E-02    (-0.00416829   0.00507026)
------------------------------------------------------------
#Fit statistic  : Chi-Squared                   57.22     using 59 bins.
 Reduced chi-squared =
# Null hypothesis probability of 3.93e-01 with 55 degrees of freedom

Energy  Fluence     90% Error
[keV]   [erg/cm2]   [erg/cm2]
15- 25  9.492e-07   6.032e-08
25- 50  2.266e-06   6.960e-08
50-150  5.256e-06   2.111e-07
15-150  8.470e-06   2.714e-07
Peak spectrum fit
Power-law model
Time interval is from   26.776 sec. to   27.776 sec.

Spectral model in power-law:
------------------------------------------------------------
Parameters  : value       lower 90%   higher 90%
Photon index: 1.36153     ( -0.0575079   0.0576387 )
Norm@50keV  : 9.68560E-02    ( -0.00310641   0.00310582 )
------------------------------------------------------------
#Fit statistic  : Chi-Squared                   60.76     using 59 bins.
 Reduced chi-squared = 1.06596
# Null hypothesis probability of 3.42e-01 with 57 degrees of freedom

Photon flux (15-150 keV)    in 1 sec: 11.6966 ( -0.3906  0.391 ) ph/cm2/s
Energy fluence (15-150 keV)             : 9.4367e-07 ( -3.33166e-08  3.33872e-08 ) ergs/cm2
Cutoff power-law model

Time interval is from   26.776 sec. to   27.776 sec.
Spectral model in the cutoff power-law:
------------------------------------------------------------
Parameters  : value       lower 90%   higher 90%
Photon index: 1.04693     ( -0.241444   0.229065 )
Epeak [keV] : 164.371      ( -48.7248 266.659 )
Norm@50keV  : 0.136028    ( -0.0291182   0.0394046 )
------------------------------------------------------------
#Fit statistic  : Chi-Squared                   55.17     using 59 bins.
 Reduced chi-squared = 0.985179
# Null hypothesis probability of 5.06e-01 with 56 degrees of freedom

Photon flux (15-150 keV)    in 1 sec: 11.5002 ( -0.4137  0.4142 ) ph/cm2/s
Energy fluence (15-150 keV)             : 9.25785e-07 ( -3.62153e-08  3.60266e-08 ) ergs/cm2
Band function

Time interval is from   26.776 sec. to   27.776 sec.


Spectral model in the Band function:
------------------------------------------------------------
Parameters  : value       lower 90%   higher 90%
alpha       :    (     )
beta        :     (     )
Epeak [keV] :       (   )
Norm@50keV   :     (     )
------------------------------------------------------------

Photon flux (15-150 keV)    in  sec:  (    ) ph/cm2/s
Energy fluence (15-150 keV)             : 0 ( 0  0 ) ergs/cm2
Single BB
Spectral model blackbody:
------------------------------------------------------------
Parameters  : value    Lower 90%  Upper 90%
kT [keV]    : 17.1111  (  )
R^2/D10^2   : 0.863914  (   )
(R is the radius in km and D10 is the distance to the source in units of 10 kpc)
------------------------------------------------------------
#Fit statistic  : Chi-Squared                  232.25     using 59 bins.
 Reduced chi-squared =
# Null hypothesis probability of 5.13e-23 with 57 degrees of freedom

Energy  Fluence     90% Error
[keV]   [erg/cm2]   [erg/cm2]
15- 25  5.142e-08   3.205e-09
25- 50  2.287e-07   9.950e-09
50-150  4.791e-07   2.780e-08
15-150  7.592e-07   3.000e-08
Thermal bremsstrahlung (OTTB)

Spectral model: thermal bremsstrahlung
------------------------------------------------------------
Parameters  : value         Lower 90%    Upper 90%
kT [keV]    : 200.000       (-6.13587      -200)
Norm        : 48.5583       (-1.56151     1.56151)
------------------------------------------------------------
#Fit statistic  : Chi-Squared                   89.84     using 59 bins.
 Reduced chi-squared =
# Null hypothesis probability of 3.60e-03 with 57 degrees of freedom

Energy  Fluence     90% Error
[keV]   [erg/cm2]   [erg/cm2]
15- 25  1.209e-07   4.100e-09
25- 50  2.327e-07   8.300e-09
50-150  5.102e-07   1.765e-08
15-150  8.638e-07   3.020e-08
Double BB
Spectral model: bbodyrad<1> + bbodyrad<2>
------------------------------------------------------------
Parameters  : value         Lower 90%    Upper 90%
kT1 [keV]   : 8.56688        (-1.08409      1.17776)
R1^2/D10^2  : 5.58881        (-1.72659      2.85375)
kT2 [keV]   : 31.6621        (-4.30871      6.87607)
R2^2/D10^2  : 8.36434E-02    (-0.0402845   0.0572281)
------------------------------------------------------------
#Fit statistic  : Chi-Squared                   57.01     using 59 bins.
 Reduced chi-squared =
# Null hypothesis probability of 4.00e-01 with 55 degrees of freedom

Energy  Fluence     90% Error
[keV]   [erg/cm2]   [erg/cm2]
15- 25  9.036e-08   1.211e-08
25- 50  2.325e-07   1.930e-08
50-150  6.031e-07   8.450e-08
15-150  9.260e-07   1.062e-07
Pre-slew spectrum (Pre-slew PHA with pre-slew DRM)
Power-law model
Spectral model in power-law:
------------------------------------------------------------
Parameters  : value       lower 90%   higher 90%
Photon index: 1.48524     ( -0.0547921   0.054861 )
Norm@50keV  : 2.08252E-02    ( -0.000619214   0.00061911 )
------------------------------------------------------------
#Fit statistic  : Chi-Squared                   49.93     using 59 bins.
 Reduced chi-squared =
# Null hypothesis probability of 7.35e-01 with 57 degrees of freedom

Photon flux (15-150 keV)    in 10.92 sec: 2.58962 ( -0.0829173  0.0831102 ) ph/cm2/s
Energy fluence (15-150 keV)             : 2.16264e-06 ( -6.87118e-08  6.88379e-08 ) ergs/cm2
Cutoff power-law model
Spectral model in the cutoff power-law:
------------------------------------------------------------
Parameters  : value       lower 90%   higher 90%
Photon index: 1.16079     ( -0.228365   0.217088 )
Epeak [keV] : 139.589      ( -36.3838 159.292 )
Norm@50keV  : 2.95254E-02    ( -0.00600271   0.00799166 )
------------------------------------------------------------
#Fit statistic  : Chi-Squared                   43.27     using 59 bins.
 Reduced chi-squared =
# Null hypothesis probability of 8.93e-01 with 56 degrees of freedom

Photon flux (15-150 keV)    in 10.92 sec: 2.53453 ( -0.0898  0.09005 ) ph/cm2/s
Energy fluence (15-150 keV)             : 2.11754e-06 ( -7.59595e-08  7.55336e-08 ) ergs/cm2
Band function
Spectral model in the Band function:
------------------------------------------------------------
Parameters  : value       lower 90%   higher 90%
alpha       :    (     )
beta        :     (     )
Epeak [keV] :       (   )
Norm@50keV   :     (     )
------------------------------------------------------------

Photon flux (15-150 keV)    in  sec:  (    ) ph/cm2/s
Energy fluence (15-150 keV)             : 0 ( 0  0 ) ergs/cm2
S(25-50 keV) vs. S(50-100 keV) plot
S(25-50 keV)  = 2.17e-06
S(50-100 keV) = 3.00e-06
T90 vs. Hardness ratio plot
T90                                   = 32.0479999780655 sec.
Hardness ratio (energy fluence ratio) = 1.38249
Color vs. Color plot
Count Ratio  (25-50 keV) / (15-25 keV) = 1.34316
Count Ratio (50-100 keV) / (15-25 keV) = 0.974642
Mask shadow pattern
IMX = 2.353283031895482E-01, IMY = 2.788536673001462E-01
TIME vs. PHA plot around the trigger time
Blue+Cyan dotted lines: Time interval of the scaled map
From 0.000000 to 0.512000
TIME vs. DetID plot around the trigger time
Blue+Cyan dotted lines: Time interval of the scaled map
From 0.000000 to 0.512000
100 us light curve (15-350 keV)
Blue+Cyan dotted lines: Time interval of the scaled map
From 0.000000 to 0.512000
Spacecraft aspect plot
Bright source in the pre-burst/pre-slew/post-slew images
Pre-burst image of 15-350 keV band
Time interval of the image:
-239.375800 -0.999800

# RAcent  DECcent POSerr Theta    Phi  PeakCts   SNR AngSep     Name
#  [deg]    [deg]    ['] [deg]  [deg]                   [']
 83.6418  22.0126    0.4  24.7  122.4   9.7932  25.7    0.5	Crab
 89.7405  19.1114    2.6  27.3  109.0   1.7268   4.5 ------	UNKNOWN
134.6132  27.1540    2.4  40.8   33.0   2.3177   4.7 ------	UNKNOWN
 54.6974   9.4638    2.7  46.9  160.2   3.5184   4.3 ------	UNKNOWN
108.2758  32.1904    2.5  20.7   57.7   1.3940   4.5 ------	UNKNOWN
 60.3069  28.8526    2.2  28.3  172.8   1.5929   5.2 ------	UNKNOWN
 71.3791  46.6329    3.2  11.9 -151.4   0.9950   3.6 ------	UNKNOWN
182.9525  55.3169    2.1  55.5  -25.3   6.4235   5.4 ------	UNKNOWN
157.6688  76.9791    3.1  40.4  -49.9   2.3320   3.7 ------	UNKNOWN
 16.7136  70.1485    5.7  41.1  -98.2   2.9415   2.0 ------	UNKNOWN
Pre-slew background subtracted image of 15-350 keV band
Time interval of the image:
-0.999800 9.924590

# RAcent  DECcent POSerr Theta    Phi  PeakCts   SNR AngSep     Name
#  [deg]    [deg]    ['] [deg]  [deg]                   [']
 83.5134  21.9330   31.4  24.8  122.7   0.0319   0.4    8.3	Crab
 66.1745   2.4835    2.5  48.1  142.1   1.4188   4.6 ------	UNKNOWN
 88.7798  42.6843    2.1   3.7  110.1   0.3330   5.6 ------	UNKNOWN
 35.9928  16.3656    2.7  52.8 -175.4   0.7700   4.4 ------	UNKNOWN
103.7710  64.6747    0.2  20.0  -49.8   3.6082  54.0 ------	UNKNOWN
 27.5371  36.4179    3.3  45.8 -148.5   0.4202   3.5 ------	UNKNOWN
Post-slew image of 15-350 keV band
Time interval of the image:
51.924600 710.928300
720.624000 962.732400

# RAcent  DECcent POSerr Theta    Phi  PeakCts   SNR AngSep     Name
#  [deg]    [deg]    ['] [deg]  [deg]                   [']
116.0396  28.4714    3.2  37.0   74.6   8.1146   3.6 ------	UNKNOWN
120.1358  28.6414    2.9  37.5   68.7   7.4027   4.0 ------	UNKNOWN
109.1542  29.9787    2.8  34.8   84.5   7.6193   4.1 ------	UNKNOWN
 92.8392  37.6304    2.9  27.8  111.5   4.4954   4.0 ------	UNKNOWN
120.7812  46.0876    3.4  20.8   57.7   3.0235   3.4 ------	UNKNOWN
184.2581  31.1088    4.0  58.2   -3.6  13.1186   2.9 ------	UNKNOWN
 15.6338  36.0196    3.5  57.1 -161.5  13.1808   3.3 ------	UNKNOWN
212.2591  71.9102    3.4  35.3  -56.6   4.5314   3.4 ------	UNKNOWN
207.1719  50.6288    3.0  50.6  -34.2   9.3849   3.8 ------	UNKNOWN
310.5525  73.0241    2.8  41.2  -98.8  16.2609   4.2 ------	UNKNOWN
Plot creation:
Sat Jul 30 07:20:27 EDT 2022