Estimated redshift from machine learning (Ukwatta et al. 2016) - may take a few minute to calcaulte
Image
Pre-slew 15.0-350.0 keV image (Event data)

#   RAcent    DECcent   POSerr    Theta     Phi              Peak Cts       SNR   Name
  219.0055    33.0584   0.0081    24.2678    -1.9162         1.7823304     23.796 TRIG_01016881

Foreground time interval of the image:
-10.440  15.789 (delta_t =  26.229 [sec])
Background time interval of the image:
-239.112 -10.440 (delta_t = 228.672 [sec])
Lightcurves
Notes:
- 1) The mask-weighted light curves are using the flight position.
- 2) Multiple plots of different time binning/intervals are shown to cover all scenarios of short/long GRBs, rate/image triggers, and real/false positives.
- 3) For all the mask-weighted lightcurves, the y-axis units are counts/sec/det where a det is 0.4 x 0.4 = 0.16 sq cm.
- 4) The verticle lines correspond to following: green dotted lines are T50 interval, black dotted lines are T90 interval, blue solid line(s) is a spacecraft slew start time, and orange solid line(s) is a spacecraft slew end time.
- 5) Time of each bin is in the middle of the bin.
1 s binning
From T0-310 s to T0+310 s

From T100_start - 20 s to T100_end + 30 s
Full time interval

64 ms binning
Full time interval

From T100_start to T100_end

From T0-5 sec to T0+5 sec

16 ms binning
From T100_start-5 s to T100_start+5 s

Blue+Cyan dotted lines: Time interval of the scaled map
From 0.000000 to 1.024000
8 ms binning
From T100_start-3 s to T100_start+3 s
Blue+Cyan dotted lines: Time interval of the scaled map
From 0.000000 to 1.024000
2 ms binning
From T100_start-1 s to T100_start+1 s

Blue+Cyan dotted lines: Time interval of the scaled map
From 0.000000 to 1.024000
SN=5 or 10 sec. binning (whichever binning is satisfied first)
SN=5 or 10 sec. binning (T < 200 sec)

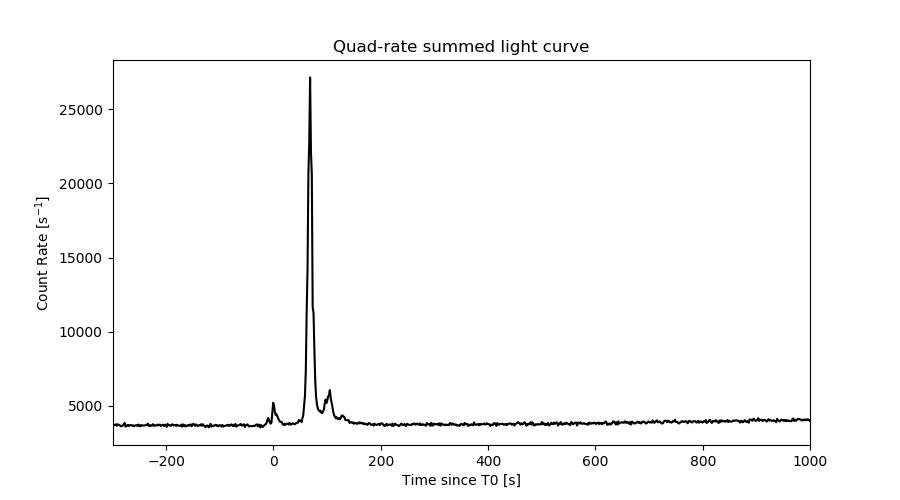
Quad-rate summed light curves (from T0-300s to T0+1000s)
Spectral Evolution

Spectra
Notes:
- 1) The fitting includes the systematic errors.
- 2) When the burst includes telescope slew time periods, the fitting uses an average response file made from multiple 5-s response files through out the slew time plus single time preiod for the non-slew times, and weighted by the total counts in the corresponding time period using addrmf. An average response file is needed becuase a spectral fit using the pre-slew DRM will introduce some errors in both a spectral shape and a normalization if the PHA file contains a lot of the slew/post-slew time interval.
- 3) For fits to more complicated models (e.g. a power-law over a cutoff power-law), the BAT team has decided to require a chi-square improvement of more than 6 for each extra dof.
Time averaged spectrum fit using the average DRM
Power-law model

Time interval is from  -10.440 sec. to  218.472 sec.

Spectral model in power-law:
------------------------------------------------------------
Parameters  : value       lower 90%   higher 90%
Photon index: 1.39934     ( -0.0285561   0.0284721 )
Norm@50keV  : 1.02253E-02    ( -0.000155511   0.000155235 )
------------------------------------------------------------
#Fit statistic  : Chi-Squared                   27.67     using 59 bins.
 Reduced chi-squared = 0.485439
# Null hypothesis probability of 1.00e+00 with 57 degrees of freedom

Photon flux (15-150 keV)    in 228.9 sec: 1.24509 ( -0.02245  0.02252 ) ph/cm2/s
Energy fluence (15-150 keV)             : 2.26223e-05 ( -3.32988e-07  3.32665e-07 ) ergs/cm2
Cutoff power-law model
Time interval is from  -10.440 sec. to  218.472 sec.
Spectral model in the cutoff power-law:
------------------------------------------------------------
Parameters  : value       lower 90%   higher 90%
Photon index: 1.33398     ( -0.115509   0.0867241 )
Epeak [keV] : 621.736      ( -621.79 -621.79 )
Norm@50keV  : 1.08773E-02    ( -0.000397896   0.00122201 )
------------------------------------------------------------
#Fit statistic  : Chi-Squared                   26.71     using 59 bins.
 Reduced chi-squared = 0.476964
# Null hypothesis probability of 1.00e+00 with 56 degrees of freedom

Photon flux (15-150 keV)    in 228.9 sec: 1.23758 ( -0.02563  0.02439 ) ph/cm2/s
Energy fluence (15-150 keV)             : 2.25479e-05 ( -3.55408e-07  3.51604e-07 ) ergs/cm2
Band function

Time interval is from  -10.440 sec. to  218.472 sec.


Spectral model in the Band function:
------------------------------------------------------------
Parameters  : value       lower 90%   higher 90%
alpha       :    (     )
beta        :     (     )
Epeak [keV] :       (   )
Norm@50keV   :     (     )
------------------------------------------------------------

Photon flux (15-150 keV)    in  sec:  (    ) ph/cm2/s
Energy fluence (15-150 keV)             : 0 ( 0  0 ) ergs/cm2
Single BB
Spectral model blackbody:
------------------------------------------------------------
Parameters  : value    Lower 90%  Upper 90%
kT [keV]    : 20.0124  (  )
R^2/D10^2   : 5.14068E-02  (   )
(R is the radius in km and D10 is the distance to the source in units of 10 kpc)
------------------------------------------------------------
#Fit statistic  : Chi-Squared                  954.33     using 59 bins.
 Reduced chi-squared =
# Null hypothesis probability of 5.01e-163 with 57 degrees of freedom

Energy  Fluence     90% Error
[keV]   [erg/cm2]   [erg/cm2]
15- 25  9.083e-07   3.067e-08
25- 50  4.526e-06   1.122e-07
50-150  1.344e-05   2.850e-07
15-150  1.887e-05   2.781e-07
Thermal bremsstrahlung (OTTB)
Spectral model: thermal bremsstrahlung
------------------------------------------------------------
Parameters  : value         Lower 90%    Upper 90%
kT [keV]    : 199.363       (      )
Norm        : 5.31753       (     )
------------------------------------------------------------
#Fit statistic  : Chi-Squared                  193.59     using 59 bins.
 Reduced chi-squared =
# Null hypothesis probability of 9.07e-17 with 57 degrees of freedom

Energy  Fluence     90% Error
[keV]   [erg/cm2]   [erg/cm2]
15- 25  3.031e-06   5.723e-08
25- 50  5.830e-06   1.076e-07
50-150  1.279e-05   2.403e-07
15-150  2.165e-05   3.949e-07
Double BB
Spectral model: bbodyrad<1> + bbodyrad<2>
------------------------------------------------------------
Parameters  : value         Lower 90%    Upper 90%
kT1 [keV]   : 8.41008        (-0.489366      0.511618)
R1^2/D10^2  : 0.635232        (-0.113962      0.14555)
kT2 [keV]   : 32.9816        (-1.87917      2.23796)
R2^2/D10^2  : 7.81589E-03    (-0.00156154   0.00176558)
------------------------------------------------------------
#Fit statistic  : Chi-Squared                   37.68     using 59 bins.
 Reduced chi-squared =
# Null hypothesis probability of 9.64e-01 with 55 degrees of freedom

Energy  Fluence     90% Error
[keV]   [erg/cm2]   [erg/cm2]
15- 25  2.212e-06   1.347e-07
25- 50  5.503e-06   1.614e-07
50-150  1.464e-05   4.052e-07
15-150  2.235e-05   5.207e-07
Peak spectrum fit
Power-law model
Time interval is from   68.864 sec. to   69.864 sec.

Spectral model in power-law:
------------------------------------------------------------
Parameters  : value       lower 90%   higher 90%
Photon index: 1.17878     ( -0.0456232   0.0455613 )
Norm@50keV  : 0.166048    ( -0.00406879   0.00406738 )
------------------------------------------------------------
#Fit statistic  : Chi-Squared                   38.36     using 59 bins.
 Reduced chi-squared = 0.672982
# Null hypothesis probability of 9.73e-01 with 57 degrees of freedom

Photon flux (15-150 keV)    in 1 sec: 1.22138 (    ) ph/cm2/s
Energy fluence (15-150 keV)             : 1.69508e-06 ( -4.53229e-08  4.54039e-08 ) ergs/cm2
Cutoff power-law model
Time interval is from   68.864 sec. to   69.864 sec.
Spectral model in the cutoff power-law:
------------------------------------------------------------
Parameters  : value       lower 90%   higher 90%
Photon index: 1.09671     ( -0.190242   0.0683688 )
Epeak [keV] : 588.514      ( -998.921 -998.921 )
Norm@50keV  : 0.180491    ( -0.0188975   0.0328621 )
------------------------------------------------------------
#Fit statistic  : Chi-Squared                   38.58     using 59 bins.
 Reduced chi-squared = 0.688929
# Null hypothesis probability of 9.63e-01 with 56 degrees of freedom

Photon flux (15-150 keV)    in 1 sec: 19.3885 ( -0.5422  0.5041 ) ph/cm2/s
Energy fluence (15-150 keV)             : 1.69075e-06 ( -4.79678e-08  4.71309e-08 ) ergs/cm2
Band function

Time interval is from   68.864 sec. to   69.864 sec.


Spectral model in the Band function:
------------------------------------------------------------
Parameters  : value       lower 90%   higher 90%
alpha       :    (     )
beta        :     (     )
Epeak [keV] :       (   )
Norm@50keV   :     (     )
------------------------------------------------------------

Photon flux (15-150 keV)    in  sec:  (    ) ph/cm2/s
Energy fluence (15-150 keV)             : 0 ( 0  0 ) ergs/cm2
Single BB

Spectral model blackbody:
------------------------------------------------------------
Parameters  : value    Lower 90%  Upper 90%
kT [keV]    : 20.0948  (  )
R^2/D10^2   : 0.870920  (   )
(R is the radius in km and D10 is the distance to the source in units of 10 kpc)
------------------------------------------------------------
#Fit statistic  : Chi-Squared                  370.65     using 59 bins.
 Reduced chi-squared =
# Null hypothesis probability of 1.56e-47 with 57 degrees of freedom

Energy  Fluence     90% Error
[keV]   [erg/cm2]   [erg/cm2]
15- 25  6.767e-08   3.465e-09
25- 50  3.381e-07   1.180e-08
50-150  1.013e-06   4.335e-08
15-150  1.419e-06   4.400e-08
Thermal bremsstrahlung (OTTB)

Spectral model: thermal bremsstrahlung
------------------------------------------------------------
Parameters  : value         Lower 90%    Upper 90%
kT [keV]    : 199.363       (      )
Norm        : 81.3064       (     )
------------------------------------------------------------
#Fit statistic  : Chi-Squared                  240.34     using 59 bins.
 Reduced chi-squared =
# Null hypothesis probability of 2.28e-24 with 57 degrees of freedom

Energy  Fluence     90% Error
[keV]   [erg/cm2]   [erg/cm2]
15- 25  2.025e-07   5.400e-09
25- 50  3.895e-07   1.055e-08
50-150  8.542e-07   2.180e-08
15-150  1.446e-06   3.950e-08
Double BB
Spectral model: bbodyrad<1> + bbodyrad<2>
------------------------------------------------------------
Parameters  : value         Lower 90%    Upper 90%
kT1 [keV]   : 8.81159        (-0.912524      0.982563)
R1^2/D10^2  : 7.73840        (-2.06405      3.11705)
kT2 [keV]   : 36.8494        (-4.10943      5.92318)
R2^2/D10^2  : 0.104333    (-0.0381513   0.0483207)
------------------------------------------------------------
#Fit statistic  : Chi-Squared                   45.79     using 59 bins.
 Reduced chi-squared =
# Null hypothesis probability of 8.07e-01 with 55 degrees of freedom

Energy  Fluence     90% Error
[keV]   [erg/cm2]   [erg/cm2]
15- 25  1.350e-07   1.235e-08
25- 50  3.666e-07   1.995e-08
50-150  1.193e-06   9.500e-08
15-150  1.695e-06   1.100e-07
Pre-slew spectrum (Pre-slew PHA with pre-slew DRM)
Power-law model
Spectral model in power-law:
------------------------------------------------------------
Parameters  : value       lower 90%   higher 90%
Photon index: 1.28117     ( -0.10057   0.0999212 )
Norm@50keV  : 4.65163E-03    ( -0.000284095   0.000284061 )
------------------------------------------------------------
#Fit statistic  : Chi-Squared                   86.88     using 59 bins.
 Reduced chi-squared =
# Null hypothesis probability of 6.56e-03 with 57 degrees of freedom

Photon flux (15-150 keV)    in 26.23 sec: 0.553072 ( -0.0347298  0.0347796 ) ph/cm2/s
Energy fluence (15-150 keV)             : 1.21134e-06 ( -8.09969e-08  8.13466e-08 ) ergs/cm2
Cutoff power-law model
Spectral model in the cutoff power-law:
------------------------------------------------------------
Parameters  : value       lower 90%   higher 90%
Photon index: 0.155506     ( -0.546594   0.483967 )
Epeak [keV] : 84.6570      ( -12.8098 26.2657 )
Norm@50keV  : 1.64943E-02    ( -0.00679587   0.0134318 )
------------------------------------------------------------
#Fit statistic  : Chi-Squared                   68.73     using 59 bins.
 Reduced chi-squared =
# Null hypothesis probability of 1.18e-01 with 56 degrees of freedom

Photon flux (15-150 keV)    in 26.23 sec: 0.528469 ( -0.036336  0.036326 ) ph/cm2/s
Energy fluence (15-150 keV)             : 1.12317e-06 ( -8.96384e-08  9.01578e-08 ) ergs/cm2
Band function
Spectral model in the Band function:
------------------------------------------------------------
Parameters  : value       lower 90%   higher 90%
alpha       :    (     )
beta        :     (     )
Epeak [keV] :       (   )
Norm@50keV   :     (     )
------------------------------------------------------------

Photon flux (15-150 keV)    in  sec:  (    ) ph/cm2/s
Energy fluence (15-150 keV)             : 0 ( 0  0 ) ergs/cm2
S(25-50 keV) vs. S(50-100 keV) plot

S(25-50 keV)  = 5.31e-06
S(50-100 keV) = 8.06e-06
T90 vs. Hardness ratio plot

T90                                   = 107.599999904633 sec.
Hardness ratio (energy fluence ratio) = 1.51789
Color vs. Color plot

Count Ratio  (25-50 keV) / (15-25 keV) = 1.45069
Count Ratio (50-100 keV) / (15-25 keV) = 1.1845
Mask shadow pattern

IMX = 4.505885202684413E-01, IMY = 1.507483326274372E-02
TIME vs. PHA plot around the trigger time

Blue+Cyan dotted lines: Time interval of the scaled map
From 0.000000 to 1.024000
TIME vs. DetID plot around the trigger time
Blue+Cyan dotted lines: Time interval of the scaled map
From 0.000000 to 1.024000
100 us light curve (15-350 keV)

Blue+Cyan dotted lines: Time interval of the scaled map
From 0.000000 to 1.024000
Spacecraft aspect plot

Bright source in the pre-burst/pre-slew/post-slew images
Pre-burst image of 15-350 keV band
Time interval of the image:
-239.112000 -10.440000

# RAcent  DECcent POSerr Theta    Phi  PeakCts   SNR AngSep     Name
#  [deg]    [deg]    ['] [deg]  [deg]                   [']
254.3068  35.4287    7.7  27.0  -72.7   0.5093   1.5    9.0	Her X-1
197.4932  48.1564    2.7  20.7   57.5   1.2077   4.3 ------	UNKNOWN
323.1135  45.9647    5.2  55.2 -145.1   3.2348   2.2 ------	UNKNOWN
Pre-slew background subtracted image of 15-350 keV band
Time interval of the image:
-10.440000 15.788600

# RAcent  DECcent POSerr Theta    Phi  PeakCts   SNR AngSep     Name
#  [deg]    [deg]    ['] [deg]  [deg]                   [']
254.5318  35.2882   25.6  27.2  -72.9  -0.0446  -0.4    4.9	Her X-1
169.9945  57.5781    2.4  31.2   94.7   0.5649   4.8 ------	UNKNOWN
219.0055  33.0584    0.5  24.3   -1.9   1.7822  23.8 ------	UNKNOWN
247.8556  29.9497    2.1  29.5  -57.3   0.5217   5.6 ------	UNKNOWN
Post-slew image of 15-350 keV band
Time interval of the image:
63.188590 715.982000
720.888000 963.006100

# RAcent  DECcent POSerr Theta    Phi  PeakCts   SNR AngSep     Name
#  [deg]    [deg]    ['] [deg]  [deg]                   [']
254.5415  35.2105   51.0  29.4 -130.2  -0.2971  -0.2    8.9	Her X-1
191.2839 -13.7707    3.3  53.8    8.0   9.1435   3.5 ------	UNKNOWN
219.0020  33.0404    0.3   0.0  -66.7  31.6984  35.8 ------	UNKNOWN
226.1683 -10.8418    2.2  44.4  -36.1   9.1825   5.3 ------	UNKNOWN
289.0790  40.2559    4.2  55.2 -145.1  14.9515   2.8 ------	UNKNOWN
237.4893 -11.5700    3.1  48.0  -50.7  14.9246   3.7 ------	UNKNOWN
Plot creation:
Sat Jul 30 07:19:24 EDT 2022