Click here for the BAT GCN circular template
Image
Pre-slew 15.0-350.0 keV image (Event data)
#   RAcent    DECcent   POSerr    Theta     Phi              Peak Cts       SNR   Name
  358.4903    65.9339   0.0036    25.2695   153.6072         8.2747609     53.778 TRIG_00102861

Foreground time interval of the image:
  4.288 117.709 (delta_t = 113.421 [sec])
Background time interval of the image:
-299.392   4.288 (delta_t = 303.680 [sec])
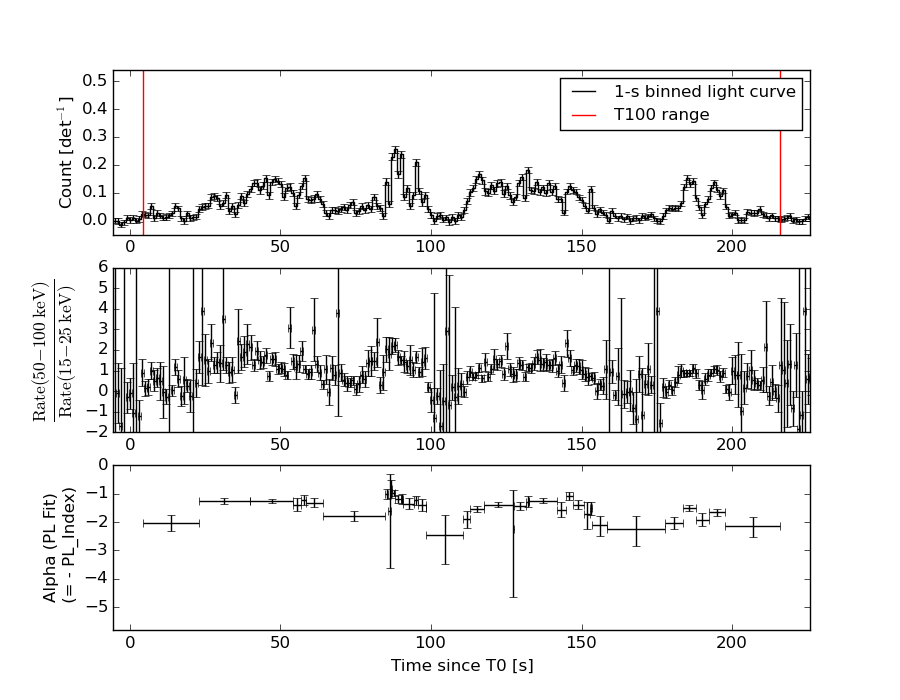
Lightcurves
Notes:
- 1) The mask-weighted light curves are using the flight position.
- 2) Multiple plots of different time binning/intervals are shown to cover all scenarios of short/long GRBs, rate/image triggers, and real/false positives.
- 3) For all the mask-weighted lightcurves, the y-axis units are counts/sec/det where a det is 0.4 x 0.4 = 0.16 sq cm.
- 4) The verticle lines correspond to following: green dotted lines are T50 interval, black dotted lines are T90 interval, blue solid line(s) is a spacecraft slew start time, and orange solid line(s) is a spacecraft slew end time.
- 5) Time of each bin is in the middle of the bin.
1 s binning
From T0-310 s to T0+310 s
From T100_start - 20 s to T100_end + 30 s
Full time interval
64 ms binning
Full time interval
From T100_start to T100_end
From T0-5 sec to T0+5 sec
16 ms binning
From T100_start-5 s to T100_start+5 s
8 ms binning
From T100_start-3 s to T100_start+3 s
2 ms binning
From T100_start-1 s to T100_start+1 s
SN=5 or 10 sec. binning (whichever binning is satisfied first)
SN=5 or 10 sec. binning (T < 200 sec)
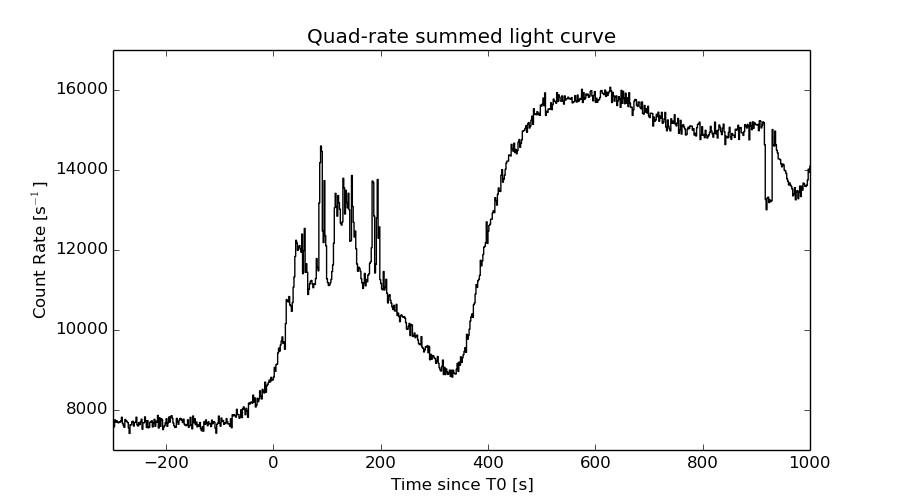
Quad-rate summed light curves (from T0-300s to T0+1000s)
Spectral Evolution
Spectra
Notes:
- 1) The fitting includes the systematic errors.
- 2) When the burst includes telescope slew time periods, the fitting uses an average response file made from multiple 5-s response files through out the slew time plus single time preiod for the non-slew times, and weighted by the total counts in the corresponding time period using addrmf. An average response file is needed becuase a spectral fit using the pre-slew DRM will introduce some errors in both a spectral shape and a normalization if the PHA file contains a lot of the slew/post-slew time interval.
- 3) For fits to more complicated models (e.g. a power-law over a cutoff power-law), the BAT team has decided to require a chi-square improvement of more than 6 for each extra dof.
Time averaged spectrum fit using the average DRM
Power-law model
Time interval is from    4.288 sec. to  215.860 sec.

Spectral model in power-law:
------------------------------------------------------------
Parameters  : value       lower 90%   higher 90%
Photon index: 1.51866     ( -0.0416085   0.0416417 )
Norm@50keV  : 4.44597E-03    ( -9.43075e-05   9.43046e-05 )
------------------------------------------------------------
#Fit statistic : Chi-Squared =          44.49 using 59 PHA bins.
# Reduced chi-squared =         0.7805 for     57 degrees of freedom
# Null hypothesis probability =   8.862311e-01

Photon flux (15-150 keV)    in 211.6 sec: 0.557864 ( -0.0132356  0.0132776 ) ph/cm2/s
Energy fluence (15-150 keV)             : 8.89801e-06 ( -1.99206e-07  1.99484e-07 ) ergs/cm2
Cutoff power-law model

Time interval is from    4.288 sec. to  215.860 sec.
Spectral model in the cutoff power-law:
------------------------------------------------------------
Parameters  : value       lower 90%   higher 90%
Photon index: 1.16954     ( -0.180317   0.173427 )
Epeak [keV] : 129.986      ( -26.3697 71.5235 )
Norm@50keV  : 6.40987E-03    ( -0.00104096   0.00129822 )
------------------------------------------------------------
#Fit statistic : Chi-Squared =          32.29 using 59 PHA bins.
# Reduced chi-squared =         0.5766 for     56 degrees of freedom
# Null hypothesis probability =   9.953821e-01

Photon flux (15-150 keV)    in 211.6 sec: 0.541700 ( -0.015144  0.015223 ) ph/cm2/s
Energy fluence (15-150 keV)             : 8.66627e-06 ( -2.30792e-07  2.30157e-07 ) ergs/cm2
Band function
Time interval is from    4.288 sec. to  215.860 sec.

Spectral model in the Band function:
------------------------------------------------------------
Parameters  : value       lower 90%   higher 90%
alpha       : -1.16952   ( -0.11646   0.140506 )
beta        : -10.00000    ( 10   20 )
Epeak [keV] : 129.963      ( -22.8051 71.4061 )
Norm@50keV   : 6.40923E-03    ( -0.00104088   0.00074904 )
------------------------------------------------------------
#Fit statistic : Chi-Squared =          32.29 using 59 PHA bins.
# Reduced chi-squared =         0.5871 for     55 degrees of freedom
# Null hypothesis probability =   9.937765e-01

Photon flux (15-150 keV)    in 211.6 sec:  (    ) ph/cm2/s
Energy fluence (15-150 keV)             : 0 ( 0  0 ) ergs/cm2
Single BB
Spectral model blackbody:
------------------------------------------------------------
Parameters  : value    Lower 90%  Upper 90%
kT [keV]    : 16.4823  (  )
R^2/D10^2   : 4.34698E-02  (   )
(R is the radius in km and D10 is the distance to the source in units of 10 kpc)
------------------------------------------------------------
#Fit statistic : Chi-Squared =         385.87 using 59 PHA bins.
# Reduced chi-squared =         6.7696 for     57 degrees of freedom
# Null hypothesis probability =   2.323010e-50

Energy  Fluence     90% Error
[keV]   [erg/cm2]   [erg/cm2]
15- 25  5.131e-07   2.201e-08
25- 50  2.214e-06   6.560e-08
50-150  4.249e-06   1.661e-07
15-150  6.976e-06   1.841e-07
Thermal bremsstrahlung (OTTB)

Spectral model: thermal bremsstrahlung
------------------------------------------------------------
Parameters  : value         Lower 90%    Upper 90%
kT [keV]    : 200.000       (      )
Norm        : 2.27458       (-0.0481969     0.048196)
------------------------------------------------------------
#Fit statistic : Chi-Squared =          39.49 using 59 PHA bins.
# Reduced chi-squared =         0.6928 for     57 degrees of freedom
# Null hypothesis probability =   9.626512e-01

Energy  Fluence     90% Error
[keV]   [erg/cm2]   [erg/cm2]
15- 25  1.199e-06   2.888e-08
25- 50  2.306e-06   5.396e-08
50-150  5.057e-06   1.238e-07
15-150  8.561e-06   2.031e-07
Double BB

Spectral model: bbodyrad<1> + bbodyrad<2>
------------------------------------------------------------
Parameters  : value         Lower 90%    Upper 90%
kT1 [keV]   : 7.43998        (-0.690733      0.733057)
R1^2/D10^2  : 0.423422        (-0.113425      0.171247)
kT2 [keV]   : 26.2552        (-2.00532      2.53393)
R2^2/D10^2  : 6.86677E-03    (-0.00198794   0.00240865)
------------------------------------------------------------
#Fit statistic : Chi-Squared =          37.69 using 59 PHA bins.
# Reduced chi-squared =         0.6852 for     55 degrees of freedom
# Null hypothesis probability =   9.640349e-01

Energy  Fluence     90% Error
[keV]   [erg/cm2]   [erg/cm2]
15- 25  1.015e-06   7.406e-08
25- 50  2.284e-06   1.153e-07
50-150  5.258e-06   3.036e-07
15-150  8.556e-06   3.650e-07
Peak spectrum fit
Power-law model

Time interval is from   87.220 sec. to   88.220 sec.

Spectral model in power-law:
------------------------------------------------------------
Parameters  : value       lower 90%   higher 90%
Photon index: 0.994284     ( -0.124159   0.122169 )
Norm@50keV  : 2.01576E-02    ( -0.00142358   0.00142113 )
------------------------------------------------------------
#Fit statistic : Chi-Squared =          57.95 using 59 PHA bins.
# Reduced chi-squared =          1.017 for     57 degrees of freedom
# Null hypothesis probability =   4.400011e-01

Photon flux (15-150 keV)    in 1 sec: 2.32007 ( -0.16571  0.165812 ) ph/cm2/s
Energy fluence (15-150 keV)             : 2.1845e-07 ( -1.71431e-08  1.71737e-08 ) ergs/cm2
Cutoff power-law model

Time interval is from   87.220 sec. to   88.220 sec.
Spectral model in the cutoff power-law:
------------------------------------------------------------
Parameters  : value       lower 90%   higher 90%
Photon index: 0.553816     ( -0.537164   0.472914 )
Epeak [keV] : 184.811      ( -71.959 -184.811 )
Norm@50keV  : 3.19506E-02    ( -0.0120353   0.022774 )
------------------------------------------------------------
#Fit statistic : Chi-Squared =          55.46 using 59 PHA bins.
# Reduced chi-squared =         0.9903 for     56 degrees of freedom
# Null hypothesis probability =   4.953870e-01

Photon flux (15-150 keV)    in 1 sec: 2.27855 ( -0.17206  0.17186 ) ph/cm2/s
Energy fluence (15-150 keV)             : 2.13125e-07 ( -1.847e-08  1.8347e-08 ) ergs/cm2
Band function
Time interval is from   87.220 sec. to   88.220 sec.

Spectral model in the Band function:
------------------------------------------------------------
Parameters  : value       lower 90%   higher 90%
alpha       : 5.00000   ( -5   -5 )
beta        : -1.06792    ( -0.141277   0.13922 )
Epeak [keV] : 28.6534      ( -28.6534 5.43608 )
Norm@50keV   : 623.997    ( -43.6132   2.72593e+06 )
------------------------------------------------------------
#Fit statistic : Chi-Squared =          55.34 using 59 PHA bins.
# Reduced chi-squared =          1.006 for     55 degrees of freedom
# Null hypothesis probability =   4.617255e-01

Photon flux (15-150 keV)    in 1 sec: 2.30252 (    ) ph/cm2/s
Energy fluence (15-150 keV)             : 0 ( 0  0 ) ergs/cm2
Single BB
Spectral model blackbody:
------------------------------------------------------------
Parameters  : value    Lower 90%  Upper 90%
kT [keV]    : 21.5505  (-1.98706  2.2814)
R^2/D10^2   : 8.89365E-02  (-0.0239918   0.0317079)
(R is the radius in km and D10 is the distance to the source in units of 10 kpc)
------------------------------------------------------------
#Fit statistic : Chi-Squared =          80.60 using 59 PHA bins.
# Reduced chi-squared =          1.414 for     57 degrees of freedom
# Null hypothesis probability =   2.150925e-02

Energy  Fluence     90% Error
[keV]   [erg/cm2]   [erg/cm2]
15- 25  7.716e-09   1.153e-09
25- 50  4.030e-08   4.175e-09
50-150  1.397e-07   1.710e-08
15-150  1.877e-07   1.725e-08
Thermal bremsstrahlung (OTTB)
Spectral model: thermal bremsstrahlung
------------------------------------------------------------
Parameters  : value         Lower 90%    Upper 90%
kT [keV]    : 200.000       (      )
Norm        : 9.26832       (-0.682356     0.682326)
------------------------------------------------------------
#Fit statistic : Chi-Squared =         109.75 using 59 PHA bins.
# Reduced chi-squared =         1.9254 for     57 degrees of freedom
# Null hypothesis probability =   3.395341e-05

Energy  Fluence     90% Error
[keV]   [erg/cm2]   [erg/cm2]
15- 25  2.308e-08   2.135e-09
25- 50  4.440e-08   9.175e-09
50-150  9.738e-08   3.260e-08
15-150  1.649e-07   4.477e-08
Double BB
Spectral model: bbodyrad<1> + bbodyrad<2>
------------------------------------------------------------
Parameters  : value         Lower 90%    Upper 90%
kT1 [keV]   : 8.03564        (-2.42259      3.31065)
R1^2/D10^2  : 0.940115        (-0.577958      2.05492)
kT2 [keV]   : 31.5282        (-5.97063      13.2848)
R2^2/D10^2  : 2.34605E-02    (-0.0157524   0.0238014)
------------------------------------------------------------
#Fit statistic : Chi-Squared =          54.40 using 59 PHA bins.
# Reduced chi-squared =         0.9892 for     55 degrees of freedom
# Null hypothesis probability =   4.973439e-01

Energy  Fluence     90% Error
[keV]   [erg/cm2]   [erg/cm2]
15- 25  1.455e-08   6.700e-09
25- 50  4.168e-08   1.399e-08
50-150  1.582e-07   5.759e-08
15-150  2.144e-07   7.806e-08
Pre-slew spectrum (Pre-slew PHA with pre-slew DRM)
Power-law model
Spectral model in power-law:
------------------------------------------------------------
Parameters  : value       lower 90%   higher 90%
Photon index: 1.44014     ( -0.0501887   0.0502052 )
Norm@50keV  : 4.78771E-03    ( -0.000125507   0.000125497 )
------------------------------------------------------------
#Fit statistic : Chi-Squared =          37.27 using 59 PHA bins.
# Reduced chi-squared =         0.6539 for     57 degrees of freedom
# Null hypothesis probability =   9.799728e-01

Photon flux (15-150 keV)    in 113.4 sec: 0.588590 ( -0.0166677  0.0167076 ) ph/cm2/s
Energy fluence (15-150 keV)             : 5.20496e-06 ( -1.47214e-07  1.47524e-07 ) ergs/cm2
Cutoff power-law model
Spectral model in the cutoff power-law:
------------------------------------------------------------
Parameters  : value       lower 90%   higher 90%
Photon index: 1.11209     ( -0.213082   0.203255 )
Epeak [keV] : 146.375      ( -37.0485 140.414 )
Norm@50keV  : 6.78963E-03    ( -0.00129033   0.00168136 )
------------------------------------------------------------
#Fit statistic : Chi-Squared =          29.49 using 59 PHA bins.
# Reduced chi-squared =         0.5267 for     56 degrees of freedom
# Null hypothesis probability =   9.986503e-01

Photon flux (15-150 keV)    in 113.4 sec: 0.574497 ( -0.01856  0.018617 ) ph/cm2/s
Energy fluence (15-150 keV)             : 5.07871e-06 ( -1.67843e-07  1.67288e-07 ) ergs/cm2
Band function

Spectral model in the Band function:
------------------------------------------------------------
Parameters  : value       lower 90%   higher 90%
alpha       : -1.11206   ( -0.354044   2.98711 )
beta        : -3.86070    ( 3.99192   13.9919 )
Epeak [keV] : 146.347      ( -103.975 137.818 )
Norm@50keV   : 6.78907E-03    ( -0.000878773   0.00120318 )
------------------------------------------------------------
#Fit statistic : Chi-Squared =          29.49 using 59 PHA bins.
# Reduced chi-squared =         0.5362 for     55 degrees of freedom
# Null hypothesis probability =   9.981020e-01

Photon flux (15-150 keV)    in 113.4 sec:  (    ) ph/cm2/s
Energy fluence (15-150 keV)             : 0 ( 0  0 ) ergs/cm2
S(25-50 keV) vs. S(50-100 keV) plot
S(25-50 keV)  = 2.22e-06
S(50-100 keV) = 3.10e-06
T90 vs. Hardness ratio plot
T90                                   = 166.648000016809 sec.
Hardness ratio (energy fluence ratio) = 1.3964
Color vs. Color plot
Count Ratio  (25-50 keV) / (15-25 keV) = 1.37577
Count Ratio (50-100 keV) / (15-25 keV) = 1.05133
Mask shadow pattern
IMX = -4.228447235908394E-01, IMY = -2.098357256255445E-01
TIME vs. PHA plot around the trigger time
TIME vs. DetID plot around the trigger time
100 us light curve (15-350 keV)
Spacecraft aspect plot
Bright source in the pre-burst/pre-slew/post-slew images
Pre-burst image of 15-350 keV band
Time interval of the image:
-299.392000 4.288000

# RAcent  DECcent POSerr Theta    Phi  PeakCts   SNR AngSep     Name
#  [deg]    [deg]    ['] [deg]  [deg]                   [']
254.4590  35.3065    3.4  38.2  -26.1   0.8892   3.4    2.2	Her X-1
299.5950  35.2006    0.3  29.9  -92.7  11.7362  39.9    0.2	Cyg X-1
308.2012  40.9257    2.2  25.2 -109.1   1.1847   5.2    4.4	Cyg X-3
326.3468  38.3251    2.9  32.3 -135.0   0.8724   4.0    8.2	Cyg X-2
241.3418  43.9171    2.9  36.0   -4.3   0.8887   4.0 ------	UNKNOWN
278.1359  59.6893    3.0   9.4  -21.6   0.6306   3.9 ------	UNKNOWN
338.4175  24.8380    2.4  48.8 -141.2   2.4543   4.7 ------	UNKNOWN
293.6725  24.0881    2.4  40.9  -83.3   3.4830   4.7 ------	UNKNOWN
270.2844  20.6117    2.9  47.3  -53.0   3.4587   4.1 ------	UNKNOWN
Pre-slew background subtracted image of 15-350 keV band
Time interval of the image:
4.288000 117.708590

# RAcent  DECcent POSerr Theta    Phi  PeakCts   SNR AngSep     Name
#  [deg]    [deg]    ['] [deg]  [deg]                   [']
254.3783  35.4179    5.6  38.1  -25.9  -0.3788  -2.1    6.0	Her X-1
299.6049  35.2033   13.0  29.9  -92.8  -0.1972  -0.9    0.7	Cyg X-1
308.1191  41.0665    6.4  25.1 -109.0  -0.3107  -1.8    6.8	Cyg X-3
326.0874  38.2325    3.7  32.3 -134.6   0.5263   3.1    6.7	Cyg X-2
358.4903  65.9339    0.2  25.3  153.6   8.2749  53.8 ------	UNKNOWN
234.4756  40.7647    3.1  41.5   -0.5   0.7468   3.8 ------	UNKNOWN
306.7369  33.9491    2.6  31.8 -103.8   0.9773   4.5 ------	UNKNOWN
310.0259  24.1834    2.7  41.9 -105.9   2.5199   4.4 ------	UNKNOWN
Post-slew image of 15-350 keV band
Time interval of the image:
162.508600 302.662400

# RAcent  DECcent POSerr Theta    Phi  PeakCts   SNR AngSep     Name
#  [deg]    [deg]    ['] [deg]  [deg]                   [']
308.1802  41.0904    3.8  37.2  -70.3   0.9305   3.0    8.9	Cyg X-3
326.0632  38.1967    6.8  33.3  -93.9  -0.4456  -1.7    9.1	Cyg X-2
157.2989  75.2305    2.5  38.2   44.8   1.3995   4.6 ------	UNKNOWN
 53.7256  53.1764    0.9  29.6  124.5   2.6551  12.1 ------	UNKNOWN
 28.8242  48.8436    3.0  23.3  158.6   0.5898   3.8 ------	UNKNOWN
 30.6657  16.1871    3.6  54.2  177.0   1.7669   3.2 ------	UNKNOWN
358.4589  65.9543    0.7   0.0  107.4   2.2767  17.3 ------	UNKNOWN
 22.8678  30.9563    3.2  38.0 -179.0   0.7488   3.6 ------	UNKNOWN
Plot creation:
Sun May 31 17:44:30 EDT 2015