Estimated redshift from machine learning (Ukwatta et al. 2016) - may take a few minute to calcaulte
Image
Pre-slew 15.0-350.0 keV image (Event data)

#   RAcent    DECcent   POSerr    Theta     Phi              Peak Cts       SNR   Name
  270.6126    53.6991   0.0102    32.9356    17.1308         1.0418809     18.675 TRIG_01031297

Foreground time interval of the image:
 -0.180   9.877 (delta_t =  10.057 [sec])
Background time interval of the image:
-172.323  -0.180 (delta_t = 172.143 [sec])
Lightcurves
Notes:
- 1) The mask-weighted light curves are using the flight position.
- 2) Multiple plots of different time binning/intervals are shown to cover all scenarios of short/long GRBs, rate/image triggers, and real/false positives.
- 3) For all the mask-weighted lightcurves, the y-axis units are counts/sec/det where a det is 0.4 x 0.4 = 0.16 sq cm.
- 4) The verticle lines correspond to following: green dotted lines are T50 interval, black dotted lines are T90 interval, blue solid line(s) is a spacecraft slew start time, and orange solid line(s) is a spacecraft slew end time.
- 5) Time of each bin is in the middle of the bin.
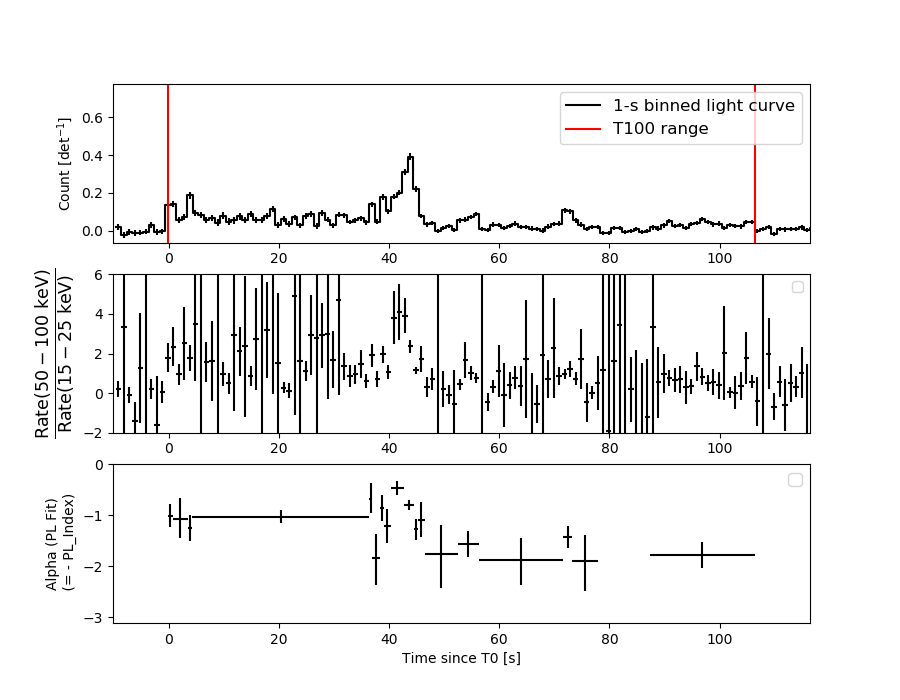
1 s binning
From T0-310 s to T0+310 s

From T100_start - 20 s to T100_end + 30 s

Full time interval

64 ms binning
Full time interval

From T100_start to T100_end

From T0-5 sec to T0+5 sec

16 ms binning
From T100_start-5 s to T100_start+5 s

Blue+Cyan dotted lines: Time interval of the scaled map
From 0.000000 to 0.512000
8 ms binning
From T100_start-3 s to T100_start+3 s
Blue+Cyan dotted lines: Time interval of the scaled map
From 0.000000 to 0.512000
2 ms binning
From T100_start-1 s to T100_start+1 s

Blue+Cyan dotted lines: Time interval of the scaled map
From 0.000000 to 0.512000
SN=5 or 10 sec. binning (whichever binning is satisfied first)

SN=5 or 10 sec. binning (T < 200 sec)

Quad-rate summed light curves (from T0-300s to T0+1000s)

Spectral Evolution
Spectra
Notes:
- 1) The fitting includes the systematic errors.
- 2) When the burst includes telescope slew time periods, the fitting uses an average response file made from multiple 5-s response files through out the slew time plus single time preiod for the non-slew times, and weighted by the total counts in the corresponding time period using addrmf. An average response file is needed becuase a spectral fit using the pre-slew DRM will introduce some errors in both a spectral shape and a normalization if the PHA file contains a lot of the slew/post-slew time interval.
- 3) For fits to more complicated models (e.g. a power-law over a cutoff power-law), the BAT team has decided to require a chi-square improvement of more than 6 for each extra dof.
Time averaged spectrum fit using the average DRM
Power-law model

Time interval is from   -0.180 sec. to  106.404 sec.

Spectral model in power-law:
------------------------------------------------------------
Parameters  : value       lower 90%   higher 90%
Photon index: 1.15137     ( -0.0723534   0.0717559 )
Norm@50keV  : 3.82737E-03    ( -0.00014398   0.000143704 )
------------------------------------------------------------
#Fit statistic  : Chi-Squared                   53.77     using 59 bins.
 Reduced chi-squared = 0.943333
# Null hypothesis probability of 5.97e-01 with 57 degrees of freedom

Photon flux (15-150 keV)    in 106.6 sec: 0.446423 ( -0.017757  0.017845 ) ph/cm2/s
Energy fluence (15-150 keV)             : 4.19882e-06 ( -1.68433e-07  1.68919e-07 ) ergs/cm2
Cutoff power-law model

Time interval is from   -0.180 sec. to  106.404 sec.
Spectral model in the cutoff power-law:
------------------------------------------------------------
Parameters  : value       lower 90%   higher 90%
Photon index: 1.14996     ( -0.134024   0.069541 )
Epeak [keV] : 9999.36      ( -9999.36 -9999.36 )
Norm@50keV  : 3.83356E-03    ( -0.000143509   0.000581442 )
------------------------------------------------------------
#Fit statistic  : Chi-Squared                   53.87     using 59 bins.
 Reduced chi-squared = 0.961964
# Null hypothesis probability of 5.56e-01 with 56 degrees of freedom

Photon flux (15-150 keV)    in 106.6 sec: 0.446291 ( -0.017781  0.017822 ) ph/cm2/s
Energy fluence (15-150 keV)             : 4.2327e-06 ( -2.03888e-07  1.33333e-07 ) ergs/cm2
Band function

Time interval is from   -0.180 sec. to  106.404 sec.


Spectral model in the Band function:
------------------------------------------------------------
Parameters  : value       lower 90%   higher 90%
alpha       :    (     )
beta        :     (     )
Epeak [keV] :       (   )
Norm@50keV   :     (     )
------------------------------------------------------------

Photon flux (15-150 keV)    in  sec:  (    ) ph/cm2/s
Energy fluence (15-150 keV)             : 0 ( 0  0 ) ergs/cm2
Single BB

Spectral model blackbody:
------------------------------------------------------------
Parameters  : value    Lower 90%  Upper 90%
kT [keV]    : 20.8642  (  )
R^2/D10^2   : 1.75299E-02  (   )
(R is the radius in km and D10 is the distance to the source in units of 10 kpc)
------------------------------------------------------------
#Fit statistic  : Chi-Squared                  213.48     using 59 bins.
 Reduced chi-squared =
# Null hypothesis probability of 6.19e-20 with 57 degrees of freedom

Energy  Fluence     90% Error
[keV]   [erg/cm2]   [erg/cm2]
15- 25  1.541e-07   1.215e-08
25- 50  7.889e-07   4.269e-08
50-150  2.558e-06   1.567e-07
15-150  3.501e-06   1.578e-07
Thermal bremsstrahlung (OTTB)

Spectral model: thermal bremsstrahlung
------------------------------------------------------------
Parameters  : value         Lower 90%    Upper 90%
kT [keV]    : 199.362       (      )
Norm        : 1.88751       (     )
------------------------------------------------------------
#Fit statistic  : Chi-Squared                  152.61     using 59 bins.
 Reduced chi-squared =
# Null hypothesis probability of 1.16e-10 with 57 degrees of freedom

Energy  Fluence     90% Error
[keV]   [erg/cm2]   [erg/cm2]
15- 25  5.010e-07   2.169e-08
25- 50  9.638e-07   4.280e-08
50-150  2.114e-06   9.168e-08
15-150  3.579e-06   1.412e-07
Double BB

Spectral model: bbodyrad<1> + bbodyrad<2>
------------------------------------------------------------
Parameters  : value         Lower 90%    Upper 90%
kT1 [keV]   : 8.95309        (-1.32374      1.46558)
R1^2/D10^2  : 0.177367        (-0.064087      0.116391)
kT2 [keV]   : 41.7699        (-7.63368      14.507)
R2^2/D10^2  : 1.73056E-03    (-0.000946228   0.00144043)
------------------------------------------------------------
#Fit statistic  : Chi-Squared                   59.50     using 59 bins.
 Reduced chi-squared =
# Null hypothesis probability of 3.15e-01 with 55 degrees of freedom

Energy  Fluence     90% Error
[keV]   [erg/cm2]   [erg/cm2]
15- 25  3.345e-07   5.378e-08
25- 50  8.983e-07   9.391e-08
50-150  3.032e-06   5.922e-07
15-150  4.265e-06   6.183e-07
Peak spectrum fit
Power-law model

Time interval is from   43.156 sec. to   44.156 sec.

Spectral model in power-law:
------------------------------------------------------------
Parameters  : value       lower 90%   higher 90%
Photon index: 0.731095     ( -0.128652   0.125566 )
Norm@50keV  : 2.58130E-02    ( -0.00178501   0.00177421 )
------------------------------------------------------------
#Fit statistic  : Chi-Squared                   62.14     using 59 bins.
 Reduced chi-squared = 1.09018
# Null hypothesis probability of 2.98e-01 with 57 degrees of freedom

Photon flux (15-150 keV)    in 1 sec: 2.97702 ( -0.19973  0.19989 ) ph/cm2/s
Energy fluence (15-150 keV)             : 3.10771e-07 ( -2.34946e-08  2.3655e-08 ) ergs/cm2
Cutoff power-law model

Time interval is from   43.156 sec. to   44.156 sec.
Spectral model in the cutoff power-law:
------------------------------------------------------------
Parameters  : value       lower 90%   higher 90%
Photon index: 0.724203     ( -0.230774   0.125792 )
Epeak [keV] : 9998.79      ( -9998.96 -9998.96 )
Norm@50keV  : 2.60102E-02    ( -0.00177119   0.0114368 )
------------------------------------------------------------
#Fit statistic  : Chi-Squared                   62.16     using 59 bins.
 Reduced chi-squared = 1.11
# Null hypothesis probability of 2.66e-01 with 56 degrees of freedom

Photon flux (15-150 keV)    in 1 sec: 2.98167 (    ) ph/cm2/s
Energy fluence (15-150 keV)             : 3.12047e-07 ( 0  0 ) ergs/cm2
Band function

Time interval is from   43.156 sec. to   44.156 sec.


Spectral model in the Band function:
------------------------------------------------------------
Parameters  : value       lower 90%   higher 90%
alpha       :    (     )
beta        :     (     )
Epeak [keV] :       (   )
Norm@50keV   :     (     )
------------------------------------------------------------

Photon flux (15-150 keV)    in  sec:  (    ) ph/cm2/s
Energy fluence (15-150 keV)             : 0 ( 0  0 ) ergs/cm2
Single BB

Spectral model blackbody:
------------------------------------------------------------
Parameters  : value    Lower 90%  Upper 90%
kT [keV]    : 26.9605  (-2.8149  3.34558)
R^2/D10^2   : 6.06127E-02  (-0.0169184   0.0224882)
(R is the radius in km and D10 is the distance to the source in units of 10 kpc)
------------------------------------------------------------
#Fit statistic  : Chi-Squared                   97.34     using 59 bins.
 Reduced chi-squared =
# Null hypothesis probability of 6.98e-04 with 57 degrees of freedom

Energy  Fluence     90% Error
[keV]   [erg/cm2]   [erg/cm2]
15- 25  7.343e-09   1.124e-09
25- 50  4.322e-08   4.605e-09
50-150  2.296e-07   2.575e-08
15-150  2.801e-07   2.650e-08
Thermal bremsstrahlung (OTTB)

Spectral model: thermal bremsstrahlung
------------------------------------------------------------
Parameters  : value         Lower 90%    Upper 90%
kT [keV]    : 199.363       (      )
Norm        : 11.0489       (     )
------------------------------------------------------------
#Fit statistic  : Chi-Squared                  171.07     using 59 bins.
 Reduced chi-squared =
# Null hypothesis probability of 2.48e-13 with 57 degrees of freedom

Energy  Fluence     90% Error
[keV]   [erg/cm2]   [erg/cm2]
15- 25  2.751e-08   2.760e-09
25- 50  5.292e-08   9.200e-09
50-150  1.161e-07   4.480e-08
15-150  1.965e-07   6.752e-08
Double BB

Spectral model: bbodyrad<1> + bbodyrad<2>
------------------------------------------------------------
Parameters  : value         Lower 90%    Upper 90%
kT1 [keV]   : 8.19546        (-2.47447      3.59262)
R1^2/D10^2  : 1.03821        (-0.659871      2.36257)
kT2 [keV]   : 42.2790        (-9.16703      25.8642)
R2^2/D10^2  : 1.57071E-02    (-0.0109587   0.018012)
------------------------------------------------------------
#Fit statistic  : Chi-Squared                   62.59     using 59 bins.
 Reduced chi-squared =
# Null hypothesis probability of 2.25e-01 with 55 degrees of freedom

Energy  Fluence     90% Error
[keV]   [erg/cm2]   [erg/cm2]
15- 25  1.631e-08   7.171e-09
25- 50  4.752e-08   1.660e-08
50-150  2.530e-07   9.072e-08
15-150  3.168e-07   8.780e-08
Pre-slew spectrum (Pre-slew PHA with pre-slew DRM)
Power-law model
Spectral model in power-law:
------------------------------------------------------------
Parameters  : value       lower 90%   higher 90%
Photon index: 0.850516     ( -0.17787   0.169178 )
Norm@50keV  : 6.54229E-03    ( -0.000625899   0.00061362 )
------------------------------------------------------------
#Fit statistic  : Chi-Squared                   79.17     using 59 bins.
 Reduced chi-squared =
# Null hypothesis probability of 2.77e-02 with 57 degrees of freedom

Photon flux (15-150 keV)    in 10.06 sec: 0.750995 ( -0.0701619  0.0704679 ) ph/cm2/s
Energy fluence (15-150 keV)             : 7.53259e-07 ( -6.83445e-08  6.86698e-08 ) ergs/cm2
Cutoff power-law model
Spectral model in the cutoff power-law:
------------------------------------------------------------
Parameters  : value       lower 90%   higher 90%
Photon index: 0.853030     ( -0.188536   0.162165 )
Epeak [keV] : 9999.36      ( -9999.36 -9999.36 )
Norm@50keV  : 6.60039E-03    ( -0.000583191   0.00174925 )
------------------------------------------------------------
#Fit statistic  : Chi-Squared                   79.25     using 59 bins.
 Reduced chi-squared =
# Null hypothesis probability of 2.22e-02 with 56 degrees of freedom

Photon flux (15-150 keV)    in 10.06 sec: 0.753192 ( -0.0729  0.068238 ) ph/cm2/s
Energy fluence (15-150 keV)             : 7.50883e-07 ( -6.6391e-08  7.16272e-08 ) ergs/cm2
Band function
Spectral model in the Band function:
------------------------------------------------------------
Parameters  : value       lower 90%   higher 90%
alpha       :    (     )
beta        :     (     )
Epeak [keV] :       (   )
Norm@50keV   :     (     )
------------------------------------------------------------

Photon flux (15-150 keV)    in  sec:  (    ) ph/cm2/s
Energy fluence (15-150 keV)             : 0 ( 0  0 ) ergs/cm2
S(25-50 keV) vs. S(50-100 keV) plot

S(25-50 keV)  = 8.56e-07
S(50-100 keV) = 1.55e-06
T90 vs. Hardness ratio plot

T90                                   = 92.5279998779297 sec.
Hardness ratio (energy fluence ratio) = 1.81075
Color vs. Color plot

Count Ratio  (25-50 keV) / (15-25 keV) = 1.52196
Count Ratio (50-100 keV) / (15-25 keV) = 1.45978
Mask shadow pattern

IMX = 6.190710664771016E-01, IMY = -1.908159232915664E-01
TIME vs. PHA plot around the trigger time
Blue+Cyan dotted lines: Time interval of the scaled map
From 0.000000 to 0.512000
TIME vs. DetID plot around the trigger time

Blue+Cyan dotted lines: Time interval of the scaled map
From 0.000000 to 0.512000
100 us light curve (15-350 keV)

Blue+Cyan dotted lines: Time interval of the scaled map
From 0.000000 to 0.512000
Spacecraft aspect plot
Bright source in the pre-burst/pre-slew/post-slew images
Pre-burst image of 15-350 keV band
Time interval of the image:
-172.323410 -0.180000

# RAcent  DECcent POSerr Theta    Phi  PeakCts   SNR AngSep     Name
#  [deg]    [deg]    ['] [deg]  [deg]                   [']
254.4860  35.2162    5.3  53.2    5.5   1.3532   2.2    7.7	Her X-1
299.5344  35.2546    3.2  28.1  -37.6   0.8248   3.6    4.2	Cyg X-1
308.0770  40.9573    1.8  19.5  -42.4   1.2415   6.4    1.5	Cyg X-3
326.3194  38.3500    4.8  16.6  -88.7   0.5140   2.4    7.2	Cyg X-2
258.9029  24.7013    3.4  58.5   -6.4   4.2918   3.4 ------	UNKNOWN
Pre-slew background subtracted image of 15-350 keV band
Time interval of the image:
-0.180000 9.876590

# RAcent  DECcent POSerr Theta    Phi  PeakCts   SNR AngSep     Name
#  [deg]    [deg]    ['] [deg]  [deg]                   [']
254.4656  35.2288   10.2  53.2    5.5   0.1499   1.1    6.8	Her X-1
299.4507  35.0931    6.7  28.3  -37.7   0.0761   1.7    9.4	Cyg X-1
308.3064  40.9579    8.0  19.4  -42.8  -0.0600  -1.4    8.9	Cyg X-3
326.3618  38.4064  107.3  16.6  -88.8  -0.0047  -0.1   10.3	Cyg X-2
270.6126  53.6990    0.6  32.9   17.1   1.0420  18.7 ------	UNKNOWN
Post-slew image of 15-350 keV band
Time interval of the image:
63.076610 409.576610

# RAcent  DECcent POSerr Theta    Phi  PeakCts   SNR AngSep     Name
#  [deg]    [deg]    ['] [deg]  [deg]                   [']
254.4598  35.3651    2.7  21.5   -2.1   1.5494   4.2    1.4	Her X-1
299.5407  35.3510   15.2  27.3  -99.8   0.3615   0.8    9.3	Cyg X-1
307.9794  40.9762    2.6  27.9 -118.6   1.9086   4.4    6.1	Cyg X-3
326.2394  38.3853    3.0  40.3 -131.3   2.2807   3.9    5.0	Cyg X-2
222.4621  27.3666    3.3  43.8   32.5   2.2948   3.5 ------	UNKNOWN
270.6546  53.6353    2.4   0.0  -83.9   1.4908   4.8 ------	UNKNOWN
Plot creation:
Sat Jul 30 07:17:50 EDT 2022