Estimated redshift from machine learning (Ukwatta et al. 2016) - may take a few minute to calcaulte
Image
Pre-slew 15.0-350.0 keV image (Event data)

#   RAcent    DECcent   POSerr    Theta     Phi              Peak Cts       SNR   Name
  269.4232   -46.2715   0.0121    14.5976   -22.5331         0.7210388     15.866 TRIG_01032024

Foreground time interval of the image:
 -0.700  11.669 (delta_t =  12.369 [sec])
Background time interval of the image:
-239.832  -0.700 (delta_t = 239.132 [sec])
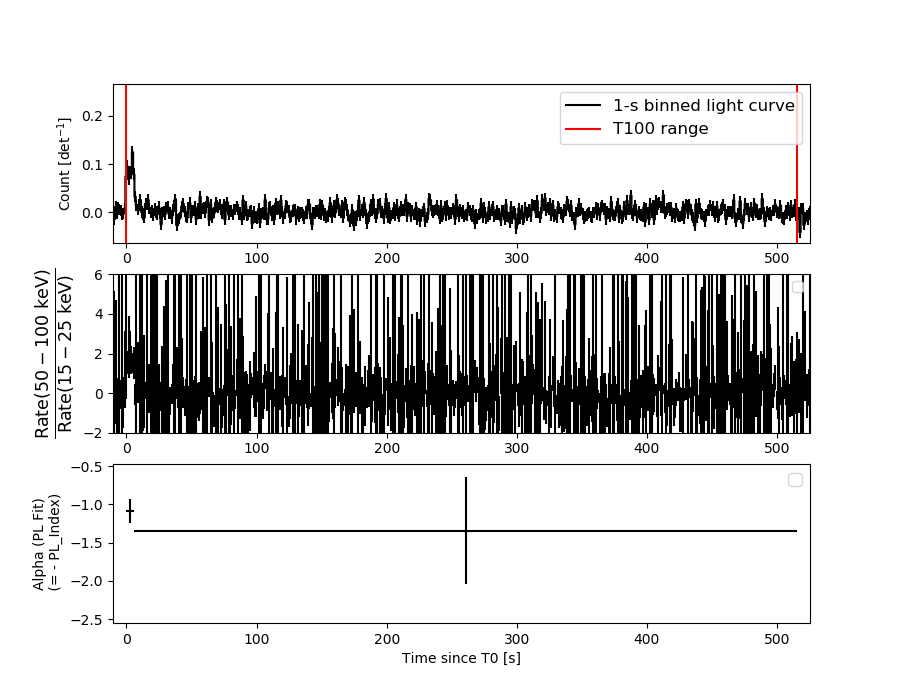
Lightcurves
Notes:
- 1) The mask-weighted light curves are using the flight position.
- 2) Multiple plots of different time binning/intervals are shown to cover all scenarios of short/long GRBs, rate/image triggers, and real/false positives.
- 3) For all the mask-weighted lightcurves, the y-axis units are counts/sec/det where a det is 0.4 x 0.4 = 0.16 sq cm.
- 4) The verticle lines correspond to following: green dotted lines are T50 interval, black dotted lines are T90 interval, blue solid line(s) is a spacecraft slew start time, and orange solid line(s) is a spacecraft slew end time.
- 5) Time of each bin is in the middle of the bin.
1 s binning
From T0-310 s to T0+310 s

From T100_start - 20 s to T100_end + 30 s

Full time interval
64 ms binning
Full time interval
From T100_start to T100_end
From T0-5 sec to T0+5 sec

16 ms binning
From T100_start-5 s to T100_start+5 s

Blue+Cyan dotted lines: Time interval of the scaled map
From 0.000000 to 0.512000
8 ms binning
From T100_start-3 s to T100_start+3 s
Blue+Cyan dotted lines: Time interval of the scaled map
From 0.000000 to 0.512000
2 ms binning
From T100_start-1 s to T100_start+1 s
Blue+Cyan dotted lines: Time interval of the scaled map
From 0.000000 to 0.512000
SN=5 or 10 sec. binning (whichever binning is satisfied first)
SN=5 or 10 sec. binning (T < 200 sec)
Quad-rate summed light curves (from T0-300s to T0+1000s)

Spectral Evolution
Spectra
Notes:
- 1) The fitting includes the systematic errors.
- 2) When the burst includes telescope slew time periods, the fitting uses an average response file made from multiple 5-s response files through out the slew time plus single time preiod for the non-slew times, and weighted by the total counts in the corresponding time period using addrmf. An average response file is needed becuase a spectral fit using the pre-slew DRM will introduce some errors in both a spectral shape and a normalization if the PHA file contains a lot of the slew/post-slew time interval.
- 3) For fits to more complicated models (e.g. a power-law over a cutoff power-law), the BAT team has decided to require a chi-square improvement of more than 6 for each extra dof.
Time averaged spectrum fit using the average DRM
Power-law model
Time interval is from   -0.700 sec. to  515.344 sec.

Spectral model in power-law:
------------------------------------------------------------
Parameters  : value       lower 90%   higher 90%
Photon index: 1.26024     ( -0.447912   0.430438 )
Norm@50keV  : 2.02674E-04    ( -5.16483e-05   5.16477e-05 )
------------------------------------------------------------
#Fit statistic  : Chi-Squared                   75.87     using 59 bins.
 Reduced chi-squared = 1.33105
# Null hypothesis probability of 4.80e-02 with 57 degrees of freedom

Photon flux (15-150 keV)    in 516 sec: 2.40116E-02 ( -0.0063166  0.0063667 ) ph/cm2/s
Energy fluence (15-150 keV)             : 1.04395e-06 ( -2.87101e-07  2.9289e-07 ) ergs/cm2
Cutoff power-law model
Time interval is from   -0.700 sec. to  515.344 sec.
Spectral model in the cutoff power-law:
------------------------------------------------------------
Parameters  : value       lower 90%   higher 90%
Photon index: 6.71053E-03     ( -3.59608   1.11867 )
Epeak [keV] : 83.5282      ( -31.1791 -83.5281 )
Norm@50keV  : 8.03397E-04    ( -0.0008034   0.0286119 )
------------------------------------------------------------
#Fit statistic  : Chi-Squared                   74.68     using 59 bins.
 Reduced chi-squared = 1.33357
# Null hypothesis probability of 4.83e-02 with 56 degrees of freedom

Photon flux (15-150 keV)    in 516 sec: 2.26189E-02 ( -0.0068623  0.0067549 ) ph/cm2/s
Energy fluence (15-150 keV)             : 9.56974e-07 ( -3.07906e-07  3.2394e-07 ) ergs/cm2
Band function

Time interval is from   -0.700 sec. to  515.344 sec.


Spectral model in the Band function:
------------------------------------------------------------
Parameters  : value       lower 90%   higher 90%
alpha       :    (     )
beta        :     (     )
Epeak [keV] :       (   )
Norm@50keV   :     (     )
------------------------------------------------------------

Photon flux (15-150 keV)    in  sec:  (    ) ph/cm2/s
Energy fluence (15-150 keV)             : 0 ( 0  0 ) ergs/cm2
Single BB
Spectral model blackbody:
------------------------------------------------------------
Parameters  : value    Lower 90%  Upper 90%
kT [keV]    : 17.4890  (-4.30072  6.54347)
R^2/D10^2   : 1.73882E-03  (-0.00114891   0.00284128)
(R is the radius in km and D10 is the distance to the source in units of 10 kpc)
------------------------------------------------------------
#Fit statistic  : Chi-Squared                   75.38     using 59 bins.
 Reduced chi-squared =
# Null hypothesis probability of 5.20e-02 with 57 degrees of freedom

Energy  Fluence     90% Error
[keV]   [erg/cm2]   [erg/cm2]
15- 25  5.544e-08   3.121e-08
25- 50  2.508e-07   1.368e-07
50-150  5.525e-07   3.293e-07
15-150  8.588e-07   4.832e-07
Thermal bremsstrahlung (OTTB)
Spectral model: thermal bremsstrahlung
------------------------------------------------------------
Parameters  : value         Lower 90%    Upper 90%
kT [keV]    : 199.360       (-100.263      -199.362)
Norm        : 0.100537       (-0.0258299     0.0259059)
------------------------------------------------------------
#Fit statistic  : Chi-Squared                   76.64     using 59 bins.
 Reduced chi-squared =
# Null hypothesis probability of 4.24e-02 with 57 degrees of freedom

Energy  Fluence     90% Error
[keV]   [erg/cm2]   [erg/cm2]
15- 25  1.292e-07   7.879e-08
25- 50  2.485e-07   1.474e-07
50-150  5.450e-07   3.230e-07
15-150  9.227e-07   5.428e-07
Double BB
Spectral model: bbodyrad<1> + bbodyrad<2>
------------------------------------------------------------
Parameters  : value         Lower 90%    Upper 90%
kT1 [keV]   : 4.84258        (-4.99855      -4.99855)
R1^2/D10^2  : 4.33471E-02        (-0.0424799      -0.0424799)
kT2 [keV]   : 19.7203        (-5.89965      -19.7709)
R2^2/D10^2  : 1.08280E-03    (-0.00107298   0.00277462)
------------------------------------------------------------
#Fit statistic  : Chi-Squared                   74.49     using 59 bins.
 Reduced chi-squared =
# Null hypothesis probability of 4.12e-02 with 55 degrees of freedom

Energy  Fluence     90% Error
[keV]   [erg/cm2]   [erg/cm2]
15- 25  8.990e-08   5.560e-08
25- 50  2.366e-07   1.303e-07
50-150  5.989e-07   3.684e-07
15-150  9.255e-07   5.266e-07
Peak spectrum fit
Power-law model
Time interval is from    4.280 sec. to    5.280 sec.

Spectral model in power-law:
------------------------------------------------------------
Parameters  : value       lower 90%   higher 90%
Photon index: 1.25223     ( -0.281164   0.275718 )
Norm@50keV  : 8.75462E-03    ( -0.00137561   0.00137392 )
------------------------------------------------------------
#Fit statistic  : Chi-Squared                   46.84     using 59 bins.
 Reduced chi-squared = 0.821754
# Null hypothesis probability of 8.29e-01 with 57 degrees of freedom

Photon flux (15-150 keV)    in 1 sec: 1.03582 ( -0.166569  0.16703 ) ph/cm2/s
Energy fluence (15-150 keV)             : 8.7575e-08 ( -1.53013e-08  1.55063e-08 ) ergs/cm2
Cutoff power-law model
Time interval is from    4.280 sec. to    5.280 sec.
Spectral model in the cutoff power-law:
------------------------------------------------------------
Parameters  : value       lower 90%   higher 90%
Photon index: 0.964943     ( -1.30084   1.09469 )
Epeak [keV] : 187.198      ( -187.233 -187.233 )
Norm@50keV  : 1.21137E-02    ( -0.00462884   0.0382054 )
------------------------------------------------------------
#Fit statistic  : Chi-Squared                   46.63     using 59 bins.
 Reduced chi-squared = 0.832679
# Null hypothesis probability of 8.10e-01 with 56 degrees of freedom

Photon flux (15-150 keV)    in 1 sec: 1.02296 ( -0.17406  0.17304 ) ph/cm2/s
Energy fluence (15-150 keV)             : 3.13466e-08 ( -7.69176e-09  8.07915e-09 ) ergs/cm2
Band function

Time interval is from    4.280 sec. to    5.280 sec.


Spectral model in the Band function:
------------------------------------------------------------
Parameters  : value       lower 90%   higher 90%
alpha       :    (     )
beta        :     (     )
Epeak [keV] :       (   )
Norm@50keV   :     (     )
------------------------------------------------------------

Photon flux (15-150 keV)    in  sec:  (    ) ph/cm2/s
Energy fluence (15-150 keV)             : 0 ( 0  0 ) ergs/cm2
Single BB

Spectral model blackbody:
------------------------------------------------------------
Parameters  : value    Lower 90%  Upper 90%
kT [keV]    : 17.3699  (-3.36584  4.48099)
R^2/D10^2   : 7.44371E-02  (-0.0398042   0.0799696)
(R is the radius in km and D10 is the distance to the source in units of 10 kpc)
------------------------------------------------------------
#Fit statistic  : Chi-Squared                   53.94     using 59 bins.
 Reduced chi-squared =
# Null hypothesis probability of 5.91e-01 with 57 degrees of freedom

Energy  Fluence     90% Error
[keV]   [erg/cm2]   [erg/cm2]
15- 25  4.546e-09   1.492e-09
25- 50  2.046e-08   5.265e-09
50-150  4.437e-08   1.424e-08
15-150  6.937e-08   1.843e-08
Thermal bremsstrahlung (OTTB)
Spectral model: thermal bremsstrahlung
------------------------------------------------------------
Parameters  : value         Lower 90%    Upper 90%
kT [keV]    : 200.000       (-61.2475      -200)
Norm        : 4.28473       (-0.680961     0.680961)
------------------------------------------------------------
#Fit statistic  : Chi-Squared                   49.74     using 59 bins.
 Reduced chi-squared =
# Null hypothesis probability of 7.41e-01 with 57 degrees of freedom

Energy  Fluence     90% Error
[keV]   [erg/cm2]   [erg/cm2]
15- 25  1.067e-08   6.080e-09
25- 50  2.053e-08   1.150e-08
50-150  4.501e-08   2.554e-08
15-150  7.621e-08   4.377e-08
Double BB
Spectral model: bbodyrad<1> + bbodyrad<2>
------------------------------------------------------------
Parameters  : value         Lower 90%    Upper 90%
kT1 [keV]   : 9.07206        (-4.69188      5.76869)
R1^2/D10^2  : 0.420342        (-0.307703      3.53902)
kT2 [keV]   : 35.7256        (-16.8334      -37.0054)
R2^2/D10^2  : 5.30480E-03    (-0.0047472   0.0396991)
------------------------------------------------------------
#Fit statistic  : Chi-Squared                   46.42     using 59 bins.
 Reduced chi-squared =
# Null hypothesis probability of 7.88e-01 with 55 degrees of freedom

Energy  Fluence     90% Error
[keV]   [erg/cm2]   [erg/cm2]
15- 25  7.709e-09   4.584e-09
25- 50  2.078e-08   1.120e-08
50-150  5.704e-08   3.152e-08
15-150  8.553e-08   4.404e-08
Pre-slew spectrum (Pre-slew PHA with pre-slew DRM)
Power-law model
Spectral model in power-law:
------------------------------------------------------------
Parameters  : value       lower 90%   higher 90%
Photon index: 1.10052     ( -0.180149   0.174961 )
Norm@50keV  : 3.73266E-03    ( -0.000360701   0.000359596 )
------------------------------------------------------------
#Fit statistic  : Chi-Squared                   54.39     using 59 bins.
 Reduced chi-squared =
# Null hypothesis probability of 5.74e-01 with 57 degrees of freedom

Photon flux (15-150 keV)    in 12.37 sec: 0.432982 ( -0.043512  0.0437579 ) ph/cm2/s
Energy fluence (15-150 keV)             : 4.82674e-07 ( -4.9753e-08  5.00338e-08 ) ergs/cm2
Cutoff power-law model

Spectral model in the cutoff power-law:
------------------------------------------------------------
Parameters  : value       lower 90%   higher 90%
Photon index: 1.09541     ( -0.608265   0.228036 )
Epeak [keV] : 9998.88      ( -9998.9 -9998.9 )
Norm@50keV  : 3.75274E-03    ( -0.00035756   0.00351119 )
------------------------------------------------------------
#Fit statistic  : Chi-Squared                   54.39     using 59 bins.
 Reduced chi-squared =
# Null hypothesis probability of 5.36e-01 with 56 degrees of freedom

Photon flux (15-150 keV)    in 12.37 sec: 0.432930 ( -0.045298  0.043313 ) ph/cm2/s
Energy fluence (15-150 keV)             : 4.82691e-07 ( -5.26133e-08  4.98919e-08 ) ergs/cm2
Band function
Spectral model in the Band function:
------------------------------------------------------------
Parameters  : value       lower 90%   higher 90%
alpha       :    (     )
beta        :     (     )
Epeak [keV] :       (   )
Norm@50keV   :     (     )
------------------------------------------------------------

Photon flux (15-150 keV)    in  sec:  (    ) ph/cm2/s
Energy fluence (15-150 keV)             : 0 ( 0  0 ) ergs/cm2
S(25-50 keV) vs. S(50-100 keV) plot
S(25-50 keV)  = 2.27e-07
S(50-100 keV) = 3.79e-07
T90 vs. Hardness ratio plot
T90                                   = 451.299999952316 sec.
Hardness ratio (energy fluence ratio) = 1.6696
Color vs. Color plot
Count Ratio  (25-50 keV) / (15-25 keV) = 1.41859
Count Ratio (50-100 keV) / (15-25 keV) = 1.20836
Mask shadow pattern

IMX = 2.405527487595046E-01, IMY = 9.980326310323284E-02
TIME vs. PHA plot around the trigger time

Blue+Cyan dotted lines: Time interval of the scaled map
From 0.000000 to 0.512000
TIME vs. DetID plot around the trigger time
Blue+Cyan dotted lines: Time interval of the scaled map
From 0.000000 to 0.512000
100 us light curve (15-350 keV)
Blue+Cyan dotted lines: Time interval of the scaled map
From 0.000000 to 0.512000
Spacecraft aspect plot

Bright source in the pre-burst/pre-slew/post-slew images
Pre-burst image of 15-350 keV band
Time interval of the image:
-239.832000 -0.700000

# RAcent  DECcent POSerr Theta    Phi  PeakCts   SNR AngSep     Name
#  [deg]    [deg]    ['] [deg]  [deg]                   [']
244.9846 -15.6233    0.6  24.0  121.8   7.1978  17.8    1.1	Sco X-1
255.9974 -37.8247    3.7   8.6   40.0   0.8184   3.1    1.3	4U 1700-377
256.2472 -36.4178    4.9   7.7   47.4   0.6514   2.4    9.1	GX 349+2
262.8707 -24.5765    0.0   7.8  164.5   0.2425   0.8   12.6	GX 1+4
264.9737 -44.3190    0.0  12.1  -10.8   0.1694   0.6   12.6	4U 1735-44
268.5005  -1.4228    8.5  31.1 -179.0   0.4791   1.4    8.1	SW J1753.5-0127
270.2886 -25.0874   34.1   9.0 -148.7  -0.0884  -0.3    0.5	GX 5-1
270.3019 -25.7435    3.1   8.5 -146.1   0.9992   4.0    0.0	GRS 1758-258
274.1543 -13.9859   10.5  20.5 -158.5   0.3242   1.1    9.2	GX 17+2
275.8656 -30.4714    3.0  10.2 -104.6   1.0840   3.8    7.0	H1820-303
285.0505 -24.8083 1588.3  19.9 -114.3  -0.0022  -0.0    6.8	HT1900.1-2455
288.9019  11.0061   17.5  49.4 -154.7  -0.4385  -0.7    7.1	GRS 1915+105
263.0050 -33.8424    6.4   1.8   21.1   0.4891   1.8    0.9	GX 354-0
255.7311 -48.7896    1.0  17.7   10.7   3.1557  11.4 ------	UNKNOWN
283.5002   6.8306    2.9  43.3 -158.8   2.1003   4.0 ------	UNKNOWN
311.0660 -68.0109    3.1  44.7  -30.6   1.8400   3.8 ------	UNKNOWN
306.0144 -11.3015    3.0  43.9 -116.5   4.8100   3.8 ------	UNKNOWN
Pre-slew background subtracted image of 15-350 keV band
Time interval of the image:
-0.700000 11.668600

# RAcent  DECcent POSerr Theta    Phi  PeakCts   SNR AngSep     Name
#  [deg]    [deg]    ['] [deg]  [deg]                   [']
245.0939 -15.5213    5.6  24.0  122.1   0.1161   2.1    9.7	Sco X-1
256.1435 -37.9789    7.6   8.6   38.7  -0.0668  -1.5   11.0	4U 1700-377
256.2406 -36.4433    8.1   7.7   47.3  -0.0618  -1.4    9.5	GX 349+2
262.9701 -24.5892    5.2   7.7  165.1  -0.0938  -2.2    9.6	GX 1+4
264.6571 -44.5935    4.7  12.3   -9.7  -0.1037  -2.4    9.4	4U 1735-44
268.3841  -1.3915   10.0  31.1 -179.2  -0.0611  -1.2    3.8	SW J1753.5-0127
270.3035 -24.9306   57.8   9.2 -149.3  -0.0085  -0.2    9.0	GX 5-1
270.1505 -25.5812    0.0   8.6 -147.5   0.0575   1.4   12.7	GRS 1758-258
273.8662 -13.8830    9.8  20.5 -159.3  -0.0547  -1.2   12.3	GX 17+2
276.0145 -30.4992   53.8  10.4 -104.3   0.0095   0.2    9.2	H1820-303
285.0302 -24.9206  120.3  19.8 -114.1   0.0048   0.1    0.3	HT1900.1-2455
288.8204  10.8094   73.6  49.2 -154.7   0.0156   0.2    8.3	GRS 1915+105
262.7980 -33.8842    8.3   1.9   24.9  -0.0613  -1.4   10.0	GX 354-0
269.4232 -46.2715    0.7  14.6  -22.5   0.7207  15.9 ------	UNKNOWN
280.4966 -10.6833    2.0  26.4 -148.9   0.2815   5.6 ------	UNKNOWN
294.6692 -65.3152    2.3  37.9  -27.9   0.3307   5.0 ------	UNKNOWN
Post-slew image of 15-350 keV band
Time interval of the image:
57.268610 584.668590

# RAcent  DECcent POSerr Theta    Phi  PeakCts   SNR AngSep     Name
#  [deg]    [deg]    ['] [deg]  [deg]                   [']
244.9794 -15.6410    0.7  36.8  154.4  14.4922  16.3    0.0	Sco X-1
256.0365 -37.9830    5.3  12.9  141.4   1.0213   2.2    8.7	4U 1700-377
256.4457 -36.3751    2.4  13.9  147.1   2.1722   4.7    2.9	GX 349+2
263.0831 -24.7941    5.2  22.1 -179.4   1.1326   2.2    5.0	GX 1+4
264.5727 -44.5938    3.9   3.8  131.0   1.3756   3.0   11.3	4U 1735-44
268.2212  -1.3769    8.5  44.9 -165.6   1.4565   1.3    9.9	SW J1753.5-0127
270.1291 -25.1024    4.0  21.2 -162.2   1.5073   2.9    8.5	GX 5-1
270.2024 -25.7212    2.6  20.6 -162.0   2.4000   4.6    5.6	GRS 1758-258
274.0791 -13.8658    0.0  32.7 -155.5   0.1352   0.2   11.1	GX 17+2
275.9781 -30.2477    3.6  16.8 -144.1   1.6514   3.2    7.7	H1820-303
285.2184 -24.9227   69.4  24.8 -128.0   0.1050   0.2    9.9	HT1900.1-2455
263.1003 -33.9149    4.1  13.3  172.6   1.4611   2.8    7.3	GX 354-0
236.6940  -8.7460    2.5  46.8  149.0   7.4368   4.7 ------	UNKNOWN
261.2347 -73.9514    2.9  27.9   21.0   2.3237   4.0 ------	UNKNOWN
255.6862 -48.7888    1.1   9.6   86.1   6.0284  10.7 ------	UNKNOWN
 31.7677 -72.5233    3.3  54.6   -2.0   6.1507   3.5 ------	UNKNOWN
353.3590 -76.6537    2.1  43.9   -3.2   4.8055   5.4 ------	UNKNOWN
262.7853   3.2500    3.0  49.9 -172.6   4.6339   3.9 ------	UNKNOWN
  1.6548 -68.4817    3.4  48.5  -13.2   3.6826   3.4 ------	UNKNOWN
Plot creation:
Sat Jul 30 07:16:05 EDT 2022