Estimated redshift from machine learning (Ukwatta et al. 2016) - may take a few minute to calcaulte
Image
Pre-slew 15.0-350.0 keV image (Event data)

#   RAcent    DECcent   POSerr    Theta     Phi              Peak Cts       SNR   Name
   97.5571    68.7133   0.0102    45.6972   174.9711         1.1413343     18.796 TRIG_01033264

Foreground time interval of the image:
 -0.832   3.168 (delta_t =   4.000 [sec])
Background time interval of the image:
-239.832  -0.832 (delta_t = 239.000 [sec])
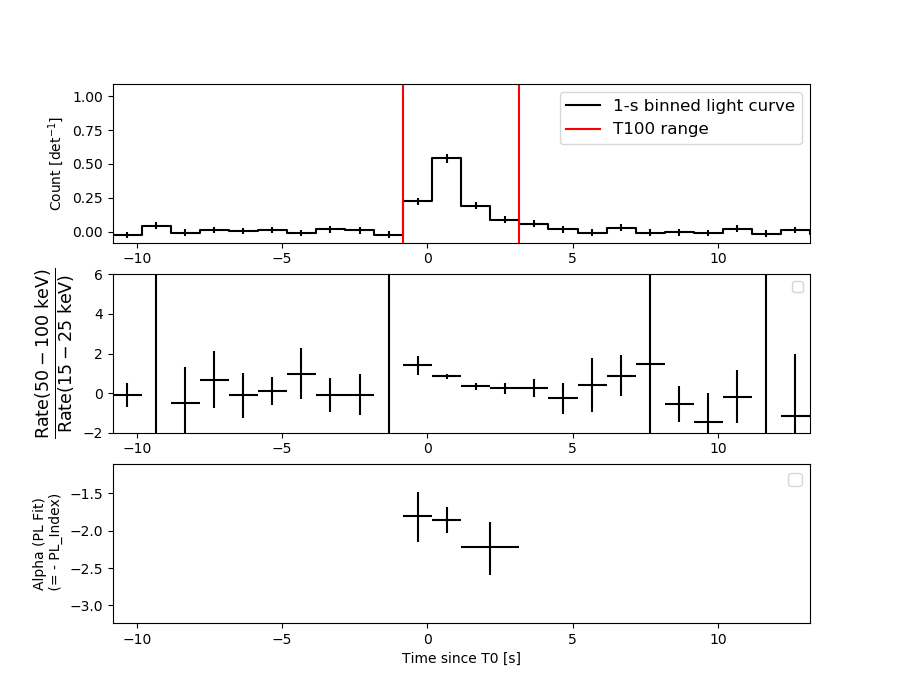
Lightcurves
Notes:
- 1) The mask-weighted light curves are using the flight position.
- 2) Multiple plots of different time binning/intervals are shown to cover all scenarios of short/long GRBs, rate/image triggers, and real/false positives.
- 3) For all the mask-weighted lightcurves, the y-axis units are counts/sec/det where a det is 0.4 x 0.4 = 0.16 sq cm.
- 4) The verticle lines correspond to following: green dotted lines are T50 interval, black dotted lines are T90 interval, blue solid line(s) is a spacecraft slew start time, and orange solid line(s) is a spacecraft slew end time.
- 5) Time of each bin is in the middle of the bin.
1 s binning
From T0-310 s to T0+310 s

From T100_start - 20 s to T100_end + 30 s

Full time interval

64 ms binning
Full time interval
From T100_start to T100_end

From T0-5 sec to T0+5 sec

16 ms binning
From T100_start-5 s to T100_start+5 s

Blue+Cyan dotted lines: Time interval of the scaled map
From 0.000000 to 1.024000
8 ms binning
From T100_start-3 s to T100_start+3 s

Blue+Cyan dotted lines: Time interval of the scaled map
From 0.000000 to 1.024000
2 ms binning
From T100_start-1 s to T100_start+1 s
Blue+Cyan dotted lines: Time interval of the scaled map
From 0.000000 to 1.024000
SN=5 or 10 sec. binning (whichever binning is satisfied first)

SN=5 or 10 sec. binning (T < 200 sec)

Quad-rate summed light curves (from T0-300s to T0+1000s)

Spectral Evolution
Spectra
Notes:
- 1) The fitting includes the systematic errors.
- 2) When the burst includes telescope slew time periods, the fitting uses an average response file made from multiple 5-s response files through out the slew time plus single time preiod for the non-slew times, and weighted by the total counts in the corresponding time period using addrmf. An average response file is needed becuase a spectral fit using the pre-slew DRM will introduce some errors in both a spectral shape and a normalization if the PHA file contains a lot of the slew/post-slew time interval.
- 3) For fits to more complicated models (e.g. a power-law over a cutoff power-law), the BAT team has decided to require a chi-square improvement of more than 6 for each extra dof.
Time averaged spectrum fit using the average DRM
Power-law model

Time interval is from   -0.832 sec. to    3.168 sec.

Spectral model in power-law:
------------------------------------------------------------
Parameters  : value       lower 90%   higher 90%
Photon index: 1.91282     ( -0.154892   0.160385 )
Norm@50keV  : 1.71398E-02    ( -0.00173832   0.00171168 )
------------------------------------------------------------
#Fit statistic  : Chi-Squared                   63.24     using 59 bins.
 Reduced chi-squared = 1.10947
# Null hypothesis probability of 2.65e-01 with 57 degrees of freedom

Photon flux (15-150 keV)    in 4 sec: 2.47340 ( -0.22361  0.22389 ) ph/cm2/s
Energy fluence (15-150 keV)             : 6.30508e-07 ( -6.23488e-08  6.29816e-08 ) ergs/cm2
Cutoff power-law model

Time interval is from   -0.832 sec. to    3.168 sec.
Spectral model in the cutoff power-law:
------------------------------------------------------------
Parameters  : value       lower 90%   higher 90%
Photon index: 1.32999     ( -0.84025   0.674408 )
Epeak [keV] : 51.2799      ( -16.3111 -51.2753 )
Norm@50keV  : 3.60089E-02    ( -0.0194093   0.0694117 )
------------------------------------------------------------
#Fit statistic  : Chi-Squared                   61.14     using 59 bins.
 Reduced chi-squared = 1.09179
# Null hypothesis probability of 2.97e-01 with 56 degrees of freedom

Photon flux (15-150 keV)    in 4 sec: 2.42077 ( -0.23358  0.2327 ) ph/cm2/s
Energy fluence (15-150 keV)             : 6.01588e-07 ( -7.16196e-08  7.1714e-08 ) ergs/cm2
Band function

Time interval is from   -0.832 sec. to    3.168 sec.


Spectral model in the Band function:
------------------------------------------------------------
Parameters  : value       lower 90%   higher 90%
alpha       :    (     )
beta        :     (     )
Epeak [keV] :       (   )
Norm@50keV   :     (     )
------------------------------------------------------------

Photon flux (15-150 keV)    in  sec:  (    ) ph/cm2/s
Energy fluence (15-150 keV)             : 0 ( 0  0 ) ergs/cm2
Single BB

Spectral model blackbody:
------------------------------------------------------------
Parameters  : value    Lower 90%  Upper 90%
kT [keV]    : 11.0076  (-1.03287  1.14816)
R^2/D10^2   : 0.816494  (-0.259823   0.375342)
(R is the radius in km and D10 is the distance to the source in units of 10 kpc)
------------------------------------------------------------
#Fit statistic  : Chi-Squared                   80.69     using 59 bins.
 Reduced chi-squared =
# Null hypothesis probability of 2.12e-02 with 57 degrees of freedom

Energy  Fluence     90% Error
[keV]   [erg/cm2]   [erg/cm2]
15- 25  8.270e-08   1.312e-08
25- 50  2.340e-07   2.488e-08
50-150  1.603e-07   3.330e-08
15-150  4.770e-07   5.140e-08
Thermal bremsstrahlung (OTTB)

Spectral model: thermal bremsstrahlung
------------------------------------------------------------
Parameters  : value         Lower 90%    Upper 90%
kT [keV]    : 80.4223       (-19.7618      31.4995)
Norm        : 11.6122       (-1.52809     1.81394)
------------------------------------------------------------
#Fit statistic  : Chi-Squared                   61.08     using 59 bins.
 Reduced chi-squared =
# Null hypothesis probability of 3.32e-01 with 57 degrees of freedom

Energy  Fluence     90% Error
[keV]   [erg/cm2]   [erg/cm2]
15- 25  1.206e-07   1.640e-08
25- 50  1.987e-07   1.874e-08
50-150  2.815e-07   9.862e-08
15-150  6.008e-07   9.600e-08
Double BB

Spectral model: bbodyrad<1> + bbodyrad<2>
------------------------------------------------------------
Parameters  : value         Lower 90%    Upper 90%
kT1 [keV]   : 8.69571        (-2.73271      1.63958)
R1^2/D10^2  : 1.69605        (-0.736942      3.39818)
kT2 [keV]   : 39.2955        (-22.2061      -39.7437)
R2^2/D10^2  : 4.33926E-03    (-0.00371295   0.0926861)
------------------------------------------------------------
#Fit statistic  : Chi-Squared                   62.11     using 59 bins.
 Reduced chi-squared =
# Null hypothesis probability of 2.38e-01 with 55 degrees of freedom

Energy  Fluence     90% Error
[keV]   [erg/cm2]   [erg/cm2]
15- 25  1.015e-07   2.298e-08
25- 50  2.210e-07   5.186e-08
50-150  2.899e-07   1.423e-07
15-150  6.124e-07   1.934e-07
Peak spectrum fit
Power-law model

Time interval is from    0.168 sec. to    1.168 sec.

Spectral model in power-law:
------------------------------------------------------------
Parameters  : value       lower 90%   higher 90%
Photon index: 1.85343     ( -0.16996   0.177159 )
Norm@50keV  : 3.50346E-02    ( -0.00388038   0.00382008 )
------------------------------------------------------------
#Fit statistic  : Chi-Squared                   58.36     using 59 bins.
 Reduced chi-squared = 1.02386
# Null hypothesis probability of 4.25e-01 with 57 degrees of freedom

Photon flux (15-150 keV)    in 1 sec: 4.93163 ( -0.50404  0.50478 ) ph/cm2/s
Energy fluence (15-150 keV)             : 3.22174e-07 ( -3.55253e-08  3.57493e-08 ) ergs/cm2
Cutoff power-law model

Time interval is from    0.168 sec. to    1.168 sec.
Spectral model in the cutoff power-law:
------------------------------------------------------------
Parameters  : value       lower 90%   higher 90%
Photon index: 1.41964     ( -0.843719   0.8068 )
Epeak [keV] : 63.8578      ( -22.2027 -63.8564 )
Norm@50keV  : 5.95113E-02    ( -0.0261577   0.106872 )
------------------------------------------------------------
#Fit statistic  : Chi-Squared                   57.29     using 59 bins.
 Reduced chi-squared = 1.02304
# Null hypothesis probability of 4.27e-01 with 56 degrees of freedom

Photon flux (15-150 keV)    in 1 sec: 4.86070 ( -0.51885  0.51791 ) ph/cm2/s
Energy fluence (15-150 keV)             : 3.14355e-07 ( -3.84751e-08  3.81376e-08 ) ergs/cm2
Band function

Time interval is from    0.168 sec. to    1.168 sec.


Spectral model in the Band function:
------------------------------------------------------------
Parameters  : value       lower 90%   higher 90%
alpha       :    (     )
beta        :     (     )
Epeak [keV] :       (   )
Norm@50keV   :     (     )
------------------------------------------------------------

Photon flux (15-150 keV)    in  sec:  (    ) ph/cm2/s
Energy fluence (15-150 keV)             : 0 ( 0  0 ) ergs/cm2
Single BB

Spectral model blackbody:
------------------------------------------------------------
Parameters  : value    Lower 90%  Upper 90%
kT [keV]    : 11.8229  (-1.26208  1.43343)
R^2/D10^2   : 1.27010  (-0.448353   0.672709)
(R is the radius in km and D10 is the distance to the source in units of 10 kpc)
------------------------------------------------------------
#Fit statistic  : Chi-Squared                   76.87     using 59 bins.
 Reduced chi-squared =
# Null hypothesis probability of 4.09e-02 with 57 degrees of freedom

Energy  Fluence     90% Error
[keV]   [erg/cm2]   [erg/cm2]
15- 25  3.750e-08   6.665e-09
25- 50  1.160e-07   1.569e-08
50-150  9.648e-08   2.070e-08
15-150  2.499e-07   3.230e-08
Thermal bremsstrahlung (OTTB)

Spectral model: thermal bremsstrahlung
------------------------------------------------------------
Parameters  : value         Lower 90%    Upper 90%
kT [keV]    : 95.6615       (-26.907      47.2873)
Norm        : 22.0560       (-3.0283     3.59508)
------------------------------------------------------------
#Fit statistic  : Chi-Squared                   57.34     using 59 bins.
 Reduced chi-squared =
# Null hypothesis probability of 4.62e-01 with 57 degrees of freedom

Energy  Fluence     90% Error
[keV]   [erg/cm2]   [erg/cm2]
15- 25  5.763e-08   8.670e-09
25- 50  9.875e-08   1.123e-08
50-150  1.560e-07   5.905e-08
15-150  3.124e-07   6.805e-08
Double BB

Spectral model: bbodyrad<1> + bbodyrad<2>
------------------------------------------------------------
Parameters  : value         Lower 90%    Upper 90%
kT1 [keV]   : 8.50150        (-3.1882      2.06807)
R1^2/D10^2  : 3.39083        (-1.67926      11.0578)
kT2 [keV]   : 31.6231        (-14.5021      109.742)
R2^2/D10^2  : 1.95366E-02    (-0.018574   0.173393)
------------------------------------------------------------
#Fit statistic  : Chi-Squared                   59.31     using 59 bins.
 Reduced chi-squared =
# Null hypothesis probability of 3.21e-01 with 55 degrees of freedom

Energy  Fluence     90% Error
[keV]   [erg/cm2]   [erg/cm2]
15- 25  4.915e-08   1.785e-08
25- 50  1.082e-07   3.394e-08
50-150  1.573e-07   7.219e-08
15-150  3.147e-07   1.157e-07
Pre-slew spectrum (Pre-slew PHA with pre-slew DRM)
Power-law model

Spectral model in power-law:
------------------------------------------------------------
Parameters  : value       lower 90%   higher 90%
Photon index: 1.91282     ( -0.154892   0.160385 )
Norm@50keV  : 1.71398E-02    ( -0.00173832   0.00171168 )
------------------------------------------------------------
#Fit statistic  : Chi-Squared                   63.24     using 59 bins.
 Reduced chi-squared =
# Null hypothesis probability of 2.65e-01 with 57 degrees of freedom

Photon flux (15-150 keV)    in 4 sec: 2.47324 ( -0.223581  0.223866 ) ph/cm2/s
Energy fluence (15-150 keV)             : 6.30404e-07 ( -6.24452e-08  6.29908e-08 ) ergs/cm2
Cutoff power-law model

Spectral model in the cutoff power-law:
------------------------------------------------------------
Parameters  : value       lower 90%   higher 90%
Photon index: 1.32921     ( -0.83999   0.674668 )
Epeak [keV] : 51.2661      ( -16.2367 -51.2738 )
Norm@50keV  : 3.60460E-02    ( -0.0195227   0.0694103 )
------------------------------------------------------------
#Fit statistic  : Chi-Squared                   61.14     using 59 bins.
 Reduced chi-squared =
# Null hypothesis probability of 2.97e-01 with 56 degrees of freedom

Photon flux (15-150 keV)    in 4 sec: 2.42026 ( -0.23345  0.23263 ) ph/cm2/s
Energy fluence (15-150 keV)             : 6.01748e-07 ( -7.1708e-08  7.1768e-08 ) ergs/cm2
Band function

Spectral model in the Band function:
------------------------------------------------------------
Parameters  : value       lower 90%   higher 90%
alpha       :    (     )
beta        :     (     )
Epeak [keV] :       (   )
Norm@50keV   :     (     )
------------------------------------------------------------

Photon flux (15-150 keV)    in  sec:  (    ) ph/cm2/s
Energy fluence (15-150 keV)             : 0 ( 0  0 ) ergs/cm2
S(25-50 keV) vs. S(50-100 keV) plot

S(25-50 keV)  = 1.85e-07
S(50-100 keV) = 1.96e-07
T90 vs. Hardness ratio plot

T90                                   = 4 sec.
Hardness ratio (energy fluence ratio) = 1.05946
Color vs. Color plot

Count Ratio  (25-50 keV) / (15-25 keV) = 1.36338
Count Ratio (50-100 keV) / (15-25 keV) = 0.73076
Mask shadow pattern

IMX = -1.020694682050474E+00, IMY = -8.981749307703840E-02
TIME vs. PHA plot around the trigger time
Blue+Cyan dotted lines: Time interval of the scaled map
From 0.000000 to 1.024000
TIME vs. DetID plot around the trigger time

Blue+Cyan dotted lines: Time interval of the scaled map
From 0.000000 to 1.024000
100 us light curve (15-350 keV)

Blue+Cyan dotted lines: Time interval of the scaled map
From 0.000000 to 1.024000
Spacecraft aspect plot

Bright source in the pre-burst/pre-slew/post-slew images
Pre-burst image of 15-350 keV band
Time interval of the image:
-239.832000 -0.832000

# RAcent  DECcent POSerr Theta    Phi  PeakCts   SNR AngSep     Name
#  [deg]    [deg]    ['] [deg]  [deg]                   [']
254.4511  35.4599    7.6  32.8  -39.9  -0.5320  -1.5    7.1	Her X-1
337.2244  64.9205    2.8  47.9 -129.2   5.1747   4.2 ------	UNKNOWN
350.9000  65.0983    3.1  51.0 -135.6   4.7603   3.8 ------	UNKNOWN
Pre-slew background subtracted image of 15-350 keV band
Time interval of the image:
-0.832000 3.168000

# RAcent  DECcent POSerr Theta    Phi  PeakCts   SNR AngSep     Name
#  [deg]    [deg]    ['] [deg]  [deg]                   [']
254.2947  35.3735    5.9  32.8  -39.7   0.0683   1.9    8.2	Her X-1
175.6420  32.4063    2.7  39.1   87.6   0.4736   4.3 ------	UNKNOWN
 97.5571  68.7133    0.6  45.7  175.0   1.1413  18.8 ------	UNKNOWN
345.0177  65.1491    2.1  49.6 -132.9   0.6802   5.5 ------	UNKNOWN
Post-slew image of 15-350 keV band
Time interval of the image:
81.868600 508.168600

# RAcent  DECcent POSerr Theta    Phi  PeakCts   SNR AngSep     Name
#  [deg]    [deg]    ['] [deg]  [deg]                   [']
 83.6587  22.0145    1.5  47.5  167.6   8.0516   7.5    1.4	Crab
188.7156  43.7285    2.4  50.3   39.9   7.7691   4.8 ------	UNKNOWN
194.3322  78.1325    3.7  25.4   -1.7   1.2537   3.1 ------	UNKNOWN
245.0676  50.3562    3.2  58.5   -6.4  10.3493   3.7 ------	UNKNOWN
 56.2236  17.7366    3.0  57.1 -161.5   7.1506   3.8 ------	UNKNOWN
 42.8104  24.0486    3.9  55.2 -144.8   9.3603   3.0 ------	UNKNOWN
Plot creation:
Sat Jul 30 07:14:55 EDT 2022