Estimated redshift from machine learning (Ukwatta et al. 2016) - may take a few minute to calcaulte
Image
Pre-slew 15.0-350.0 keV image (Event data)
#   RAcent    DECcent   POSerr    Theta     Phi              Peak Cts       SNR   Name
  154.6274   -14.9384   0.0175    28.4270    82.7663         0.7991920     10.974 TRIG_01034325

Foreground time interval of the image:
-10.200   2.696 (delta_t =  12.896 [sec])
Background time interval of the image:
-239.832 -10.200 (delta_t = 229.632 [sec])
Lightcurves
Notes:
- 1) The mask-weighted light curves are using the flight position.
- 2) Multiple plots of different time binning/intervals are shown to cover all scenarios of short/long GRBs, rate/image triggers, and real/false positives.
- 3) For all the mask-weighted lightcurves, the y-axis units are counts/sec/det where a det is 0.4 x 0.4 = 0.16 sq cm.
- 4) The verticle lines correspond to following: green dotted lines are T50 interval, black dotted lines are T90 interval, blue solid line(s) is a spacecraft slew start time, and orange solid line(s) is a spacecraft slew end time.
- 5) Time of each bin is in the middle of the bin.
1 s binning
From T0-310 s to T0+310 s

From T100_start - 20 s to T100_end + 30 s
Full time interval
64 ms binning
Full time interval

From T100_start to T100_end

From T0-5 sec to T0+5 sec

16 ms binning
From T100_start-5 s to T100_start+5 s
Blue+Cyan dotted lines: Time interval of the scaled map
From 0.000000 to 2.048000
8 ms binning
From T100_start-3 s to T100_start+3 s

Blue+Cyan dotted lines: Time interval of the scaled map
From 0.000000 to 2.048000
2 ms binning
From T100_start-1 s to T100_start+1 s
Blue+Cyan dotted lines: Time interval of the scaled map
From 0.000000 to 2.048000
SN=5 or 10 sec. binning (whichever binning is satisfied first)
SN=5 or 10 sec. binning (T < 200 sec)
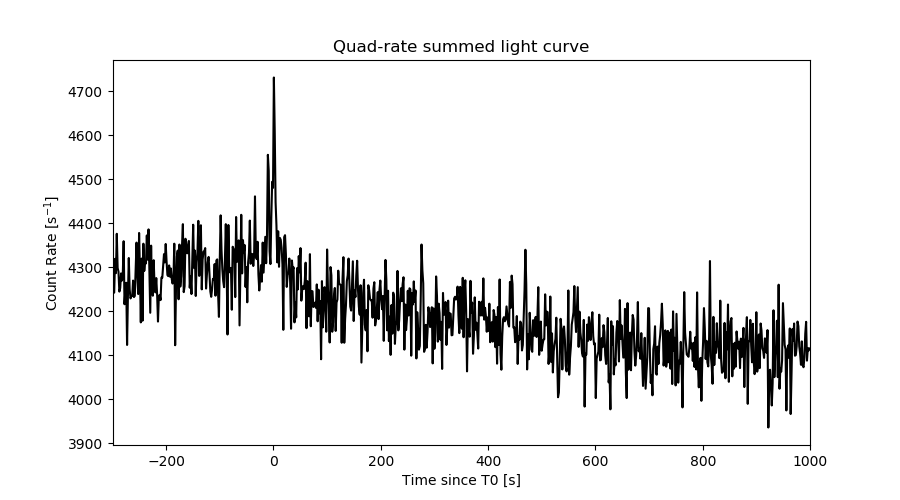
Quad-rate summed light curves (from T0-300s to T0+1000s)
Spectral Evolution

Spectra
Notes:
- 1) The fitting includes the systematic errors.
- 2) When the burst includes telescope slew time periods, the fitting uses an average response file made from multiple 5-s response files through out the slew time plus single time preiod for the non-slew times, and weighted by the total counts in the corresponding time period using addrmf. An average response file is needed becuase a spectral fit using the pre-slew DRM will introduce some errors in both a spectral shape and a normalization if the PHA file contains a lot of the slew/post-slew time interval.
- 3) For fits to more complicated models (e.g. a power-law over a cutoff power-law), the BAT team has decided to require a chi-square improvement of more than 6 for each extra dof.
Time averaged spectrum fit using the average DRM
Power-law model

Time interval is from  -10.200 sec. to    2.696 sec.

Spectral model in power-law:
------------------------------------------------------------
Parameters  : value       lower 90%   higher 90%
Photon index: 2.33938     ( -0.325382   0.369068 )
Norm@50keV  : 2.55523E-03    ( -0.000679985   0.000668126 )
------------------------------------------------------------
#Fit statistic  : Chi-Squared                   62.40     using 59 bins.
 Reduced chi-squared = 1.09474
# Null hypothesis probability of 2.90e-01 with 57 degrees of freedom

Photon flux (15-150 keV)    in 12.9 sec: 0.456596 ( -0.074262  0.074287 ) ph/cm2/s
Energy fluence (15-150 keV)             : 3.1746e-07 ( -6.61905e-08  6.97529e-08 ) ergs/cm2
Cutoff power-law model

Time interval is from  -10.200 sec. to    2.696 sec.
Spectral model in the cutoff power-law:
------------------------------------------------------------
Parameters  : value       lower 90%   higher 90%
Photon index: 1.92834     (     )
Epeak [keV] : 6.17492      (   )
Norm@50keV  : 4.69641E-03    (     )
------------------------------------------------------------
#Fit statistic  : Chi-Squared                   62.39     using 59 bins.
 Reduced chi-squared = 1.11411
# Null hypothesis probability of 2.60e-01 with 56 degrees of freedom

Photon flux (15-150 keV)    in 12.9 sec: 0.451353 ( -0.073159  0.074184 ) ph/cm2/s
Energy fluence (15-150 keV)             : 3.02684e-07 ( -8.05377e-08  7.84339e-08 ) ergs/cm2
Band function

Time interval is from  -10.200 sec. to    2.696 sec.


Spectral model in the Band function:
------------------------------------------------------------
Parameters  : value       lower 90%   higher 90%
alpha       :    (     )
beta        :     (     )
Epeak [keV] :       (   )
Norm@50keV   :     (     )
------------------------------------------------------------

Photon flux (15-150 keV)    in  sec:  (    ) ph/cm2/s
Energy fluence (15-150 keV)             : 0 ( 0  0 ) ergs/cm2
Single BB

Spectral model blackbody:
------------------------------------------------------------
Parameters  : value    Lower 90%  Upper 90%
kT [keV]    : 6.26416  (-0.965163  1.20326)
R^2/D10^2   : 1.37289  (-0.721279   1.44267)
(R is the radius in km and D10 is the distance to the source in units of 10 kpc)
------------------------------------------------------------
#Fit statistic  : Chi-Squared                   65.73     using 59 bins.
 Reduced chi-squared =
# Null hypothesis probability of 2.00e-01 with 57 degrees of freedom

Energy  Fluence     90% Error
[keV]   [erg/cm2]   [erg/cm2]
15- 25  9.798e-08   3.199e-08
25- 50  1.072e-07   3.212e-08
50-150  1.167e-08   7.441e-09
15-150  2.168e-07   5.982e-08
Thermal bremsstrahlung (OTTB)

Spectral model: thermal bremsstrahlung
------------------------------------------------------------
Parameters  : value         Lower 90%    Upper 90%
kT [keV]    : 34.4982       (-12.6062      24.3151)
Norm        : 3.27630       (-1.00341     1.64228)
------------------------------------------------------------
#Fit statistic  : Chi-Squared                   63.04     using 59 bins.
 Reduced chi-squared =
# Null hypothesis probability of 2.71e-01 with 57 degrees of freedom

Energy  Fluence     90% Error
[keV]   [erg/cm2]   [erg/cm2]
15- 25  9.178e-08   2.076e-08
25- 50  1.128e-07   2.877e-08
50-150  7.363e-08   4.160e-08
15-150  2.782e-07   7.243e-08
Double BB

Spectral model: bbodyrad<1> + bbodyrad<2>
------------------------------------------------------------
Parameters  : value         Lower 90%    Upper 90%
kT1 [keV]   : 5.38335        (-0.973808      1.11845)
R1^2/D10^2  : 2.30624        (-1.12245      3.0555)
kT2 [keV]   : 26.3912        (-11.0029      47.4604)
R2^2/D10^2  : 2.85983E-03    (-0.00271401   0.0161053)
------------------------------------------------------------
#Fit statistic  : Chi-Squared                   56.57     using 59 bins.
 Reduced chi-squared =
# Null hypothesis probability of 4.16e-01 with 55 degrees of freedom

Energy  Fluence     90% Error
[keV]   [erg/cm2]   [erg/cm2]
15- 25  1.007e-07   5.210e-08
25- 50  1.004e-07   5.298e-08
50-150  1.335e-07   8.021e-08
15-150  3.346e-07   1.614e-07
Peak spectrum fit
Power-law model

Time interval is from    0.876 sec. to    1.876 sec.

Spectral model in power-law:
------------------------------------------------------------
Parameters  : value       lower 90%   higher 90%
Photon index: 1.81818     ( -0.308686   0.34353 )
Norm@50keV  : 1.03943E-02    ( -0.0022689   0.00217555 )
------------------------------------------------------------
#Fit statistic  : Chi-Squared                   49.62     using 59 bins.
 Reduced chi-squared = 0.870526
# Null hypothesis probability of 7.45e-01 with 57 degrees of freedom

Photon flux (15-150 keV)    in 1 sec: 1.44261 ( -0.27868  0.27878 ) ph/cm2/s
Energy fluence (15-150 keV)             : 9.56533e-08 ( -2.06518e-08  2.06923e-08 ) ergs/cm2
Cutoff power-law model

Time interval is from    0.876 sec. to    1.876 sec.
Spectral model in the cutoff power-law:
------------------------------------------------------------
Parameters  : value       lower 90%   higher 90%
Photon index: 1.79698     ( -0.968717   1.17392 )
Epeak [keV] : 445.015      ( -9965.78 -9966.05 )
Norm@50keV  : 1.06565E-02    ( -0.0104123   0.0214687 )
------------------------------------------------------------
#Fit statistic  : Chi-Squared                   49.63     using 59 bins.
 Reduced chi-squared = 0.88625
# Null hypothesis probability of 7.13e-01 with 56 degrees of freedom

Photon flux (15-150 keV)    in 1 sec: 1.44336 ( -0.28694  0.28717 ) ph/cm2/s
Energy fluence (15-150 keV)             : 9.56974e-08 ( -2.1416e-08  2.13953e-08 ) ergs/cm2
Band function

Time interval is from    0.876 sec. to    1.876 sec.


Spectral model in the Band function:
------------------------------------------------------------
Parameters  : value       lower 90%   higher 90%
alpha       :    (     )
beta        :     (     )
Epeak [keV] :       (   )
Norm@50keV   :     (     )
------------------------------------------------------------

Photon flux (15-150 keV)    in  sec:  (    ) ph/cm2/s
Energy fluence (15-150 keV)             : 0 ( 0  0 ) ergs/cm2
Single BB
Spectral model blackbody:
------------------------------------------------------------
Parameters  : value    Lower 90%  Upper 90%
kT [keV]    : 10.1166  (-3.29393  8.29285)
R^2/D10^2   : 0.618908  (-0.614787   2.15406)
(R is the radius in km and D10 is the distance to the source in units of 10 kpc)
------------------------------------------------------------
#Fit statistic  : Chi-Squared                   65.37     using 59 bins.
 Reduced chi-squared =
# Null hypothesis probability of 2.09e-01 with 57 degrees of freedom

Energy  Fluence     90% Error
[keV]   [erg/cm2]   [erg/cm2]
15- 25  1.341e-08   5.531e-09
25- 50  3.267e-08   1.218e-08
50-150  1.635e-08   9.382e-09
15-150  6.243e-08   2.340e-08
Thermal bremsstrahlung (OTTB)

Spectral model: thermal bremsstrahlung
------------------------------------------------------------
Parameters  : value         Lower 90%    Upper 90%
kT [keV]    : 116.097       (-56.7722      -117.162)
Norm        : 6.20435       (-1.41178     1.86462)
------------------------------------------------------------
#Fit statistic  : Chi-Squared                   50.59     using 59 bins.
 Reduced chi-squared =
# Null hypothesis probability of 7.13e-01 with 57 degrees of freedom

Energy  Fluence     90% Error
[keV]   [erg/cm2]   [erg/cm2]
15- 25  1.618e-08   4.744e-09
25- 50  2.878e-08   1.126e-08
50-150  5.052e-08   3.314e-08
15-150  9.547e-08   4.482e-08
Double BB
Spectral model: bbodyrad<1> + bbodyrad<2>
------------------------------------------------------------
Parameters  : value         Lower 90%    Upper 90%
kT1 [keV]   : 5.37249        (-1.51582      1.98972)
R1^2/D10^2  : 5.47876        (-3.93134      17.4442)
kT2 [keV]   : 26.1811        (-7.33527      14.1997)
R2^2/D10^2  : 1.63694E-02    (-0.0129026   0.0364794)
------------------------------------------------------------
#Fit statistic  : Chi-Squared                   47.09     using 59 bins.
 Reduced chi-squared =
# Null hypothesis probability of 7.67e-01 with 55 degrees of freedom

Energy  Fluence     90% Error
[keV]   [erg/cm2]   [erg/cm2]
15- 25  1.951e-08   1.114e-08
25- 50  2.471e-08   1.275e-08
50-150  5.642e-08   3.472e-08
15-150  1.006e-07   5.524e-08
Pre-slew spectrum (Pre-slew PHA with pre-slew DRM)
Power-law model

Spectral model in power-law:
------------------------------------------------------------
Parameters  : value       lower 90%   higher 90%
Photon index: 2.33938     ( -0.325382   0.369068 )
Norm@50keV  : 2.55523E-03    ( -0.000679985   0.000668126 )
------------------------------------------------------------
#Fit statistic  : Chi-Squared                   62.40     using 59 bins.
 Reduced chi-squared =
# Null hypothesis probability of 2.90e-01 with 57 degrees of freedom

Photon flux (15-150 keV)    in 12.9 sec: 0.456542 ( -0.0742548  0.0742815 ) ph/cm2/s
Energy fluence (15-150 keV)             : 3.17392e-07 ( -6.60892e-08  6.97649e-08 ) ergs/cm2
Cutoff power-law model

Spectral model in the cutoff power-law:
------------------------------------------------------------
Parameters  : value       lower 90%   higher 90%
Photon index: 1.92951     (     )
Epeak [keV] : 6.09159      (   )
Norm@50keV  : 4.68822E-03    (     )
------------------------------------------------------------
#Fit statistic  : Chi-Squared                   62.39     using 59 bins.
 Reduced chi-squared =
# Null hypothesis probability of 2.60e-01 with 56 degrees of freedom

Photon flux (15-150 keV)    in 12.9 sec: 0.453926 ( -0.0757  0.075582 ) ph/cm2/s
Energy fluence (15-150 keV)             : 3.08567e-07 ( -8.55592e-08  7.70594e-08 ) ergs/cm2
Band function

Spectral model in the Band function:
------------------------------------------------------------
Parameters  : value       lower 90%   higher 90%
alpha       :    (     )
beta        :     (     )
Epeak [keV] :       (   )
Norm@50keV   :     (     )
------------------------------------------------------------

Photon flux (15-150 keV)    in  sec:  (    ) ph/cm2/s
Energy fluence (15-150 keV)             : 0 ( 0  0 ) ergs/cm2
S(25-50 keV) vs. S(50-100 keV) plot
S(25-50 keV)  = 1.03e-07
S(50-100 keV) = 8.15e-08
T90 vs. Hardness ratio plot

T90                                   = 12.1120001077652 sec.
Hardness ratio (energy fluence ratio) = 0.791262
Color vs. Color plot

Count Ratio  (25-50 keV) / (15-25 keV) = 0.692539
Count Ratio (50-100 keV) / (15-25 keV) = 0.353618
Mask shadow pattern

IMX = 6.815979628195033E-02, IMY = -5.369977684412671E-01
TIME vs. PHA plot around the trigger time

Blue+Cyan dotted lines: Time interval of the scaled map
From 0.000000 to 2.048000
TIME vs. DetID plot around the trigger time
Blue+Cyan dotted lines: Time interval of the scaled map
From 0.000000 to 2.048000
100 us light curve (15-350 keV)
Blue+Cyan dotted lines: Time interval of the scaled map
From 0.000000 to 2.048000
Spacecraft aspect plot

Bright source in the pre-burst/pre-slew/post-slew images
Pre-burst image of 15-350 keV band
Time interval of the image:
-239.832000 -10.200000

# RAcent  DECcent POSerr Theta    Phi  PeakCts   SNR AngSep     Name
#  [deg]    [deg]    ['] [deg]  [deg]                   [']
135.6139 -40.7037    8.8  21.0    6.2   0.2997   1.3    9.7	Vela X-1
169.9511 -60.5195    0.0  18.6  -88.1   0.0540   0.2   12.4	Cen X-3
186.8599 -62.7650    2.6  24.6 -104.1   1.3805   4.4    5.6	GX 301-2
144.2355  -5.5229    2.7  40.6   70.8   4.0550   4.3 ------	UNKNOWN
170.0335 -19.1908    3.5  23.7  116.5   1.0837   3.3 ------	UNKNOWN
100.5944 -22.5348    3.3  55.5   11.3   4.5297   3.5 ------	UNKNOWN
222.5396 -13.3869    3.0  58.1 -179.9   5.8104   3.9 ------	UNKNOWN
 93.1642 -42.8926    3.4  50.3  -14.7   2.0290   3.4 ------	UNKNOWN
230.2481 -23.1454    2.9  57.6 -165.5   4.6417   4.1 ------	UNKNOWN
Pre-slew background subtracted image of 15-350 keV band
Time interval of the image:
-10.200000 2.696000

# RAcent  DECcent POSerr Theta    Phi  PeakCts   SNR AngSep     Name
#  [deg]    [deg]    ['] [deg]  [deg]                   [']
135.7367 -40.5038    5.5  21.0    6.8  -0.1001  -2.1   10.0	Vela X-1
170.6102 -60.6985    4.0  18.9  -89.0   0.1475   2.9    9.8	Cen X-3
187.0709 -62.8294    0.0  24.7 -104.2  -0.0600  -1.1   11.9	GX 301-2
154.6274 -14.9385    1.0  28.4   82.8   0.7994  11.0 ------	UNKNOWN
Post-slew image of 15-350 keV band
Time interval of the image:
80.068590 962.293300
1059.168000 1149.328000

# RAcent  DECcent POSerr Theta    Phi  PeakCts   SNR AngSep     Name
#  [deg]    [deg]    ['] [deg]  [deg]                   [']
135.3443 -40.5831    7.9  30.7  -64.5  -1.6382  -1.5    8.6	Vela X-1
122.8172  15.2977    3.8  43.6   38.5   6.8414   3.1 ------	UNKNOWN
145.5522   4.4665    2.9  21.4   60.5   3.4056   4.0 ------	UNKNOWN
211.9411  -6.3388    3.0  56.8  173.9  14.6186   3.9 ------	UNKNOWN
212.6059  -9.0873    2.8  56.9  177.2  14.7126   4.1 ------	UNKNOWN
120.9337 -31.5239    3.0  34.9  -38.3   4.3163   3.9 ------	UNKNOWN
 92.2733 -19.2772    4.4  59.5  -17.8  10.3457   2.6 ------	UNKNOWN
213.3758 -31.8666    3.2  55.8 -155.3  12.3759   3.6 ------	UNKNOWN
208.3947 -37.1292    3.3  52.4 -148.3   8.8828   3.5 ------	UNKNOWN
127.9125 -48.2265    3.1  39.9  -66.1   7.3219   3.8 ------	UNKNOWN
114.5114 -46.8752    3.0  46.1  -56.3  12.1611   3.9 ------	UNKNOWN
Plot creation:
Sat Jul 30 07:13:52 EDT 2022