Estimated redshift from machine learning (Ukwatta et al. 2016) - may take a few minute to calcaulte
Image
Pre-slew 15.0-350.0 keV image (Event data)
#   RAcent    DECcent   POSerr    Theta     Phi              Peak Cts       SNR   Name
  319.8089    34.5475   0.0040    25.0656  -128.0022         6.3443742     48.563 TRIG_01035922

Foreground time interval of the image:
-21.648  12.829 (delta_t =  34.477 [sec])
Background time interval of the image:
-239.072 -21.648 (delta_t = 217.424 [sec])
Lightcurves
Notes:
- 1) The mask-weighted light curves are using the flight position.
- 2) Multiple plots of different time binning/intervals are shown to cover all scenarios of short/long GRBs, rate/image triggers, and real/false positives.
- 3) For all the mask-weighted lightcurves, the y-axis units are counts/sec/det where a det is 0.4 x 0.4 = 0.16 sq cm.
- 4) The verticle lines correspond to following: green dotted lines are T50 interval, black dotted lines are T90 interval, blue solid line(s) is a spacecraft slew start time, and orange solid line(s) is a spacecraft slew end time.
- 5) Time of each bin is in the middle of the bin.
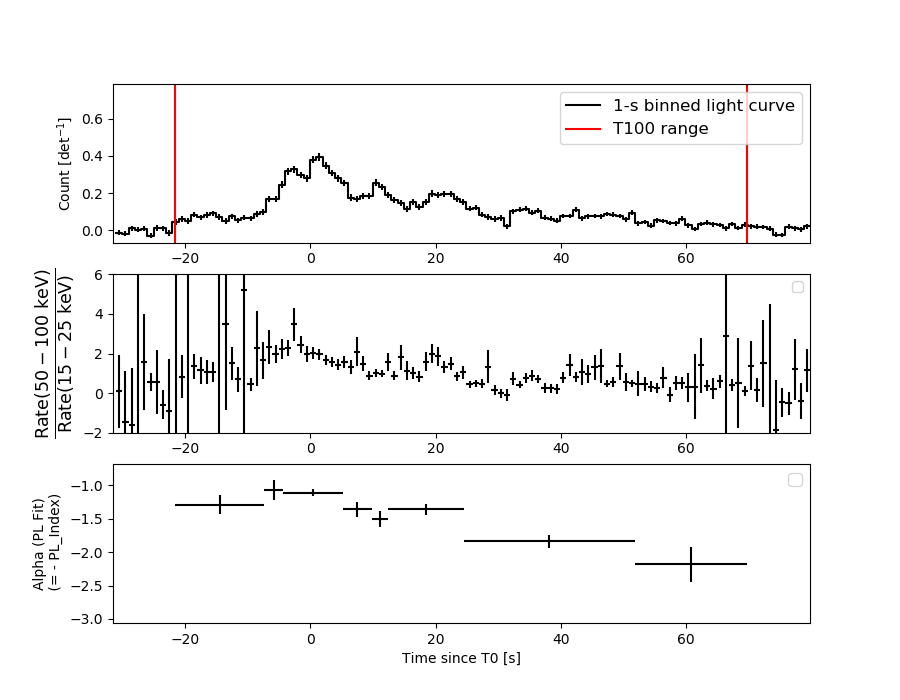
1 s binning
From T0-310 s to T0+310 s
From T100_start - 20 s to T100_end + 30 s
Full time interval

64 ms binning
Full time interval
From T100_start to T100_end
From T0-5 sec to T0+5 sec
16 ms binning
From T100_start-5 s to T100_start+5 s

Blue+Cyan dotted lines: Time interval of the scaled map
From 0.000000 to 1.024000
8 ms binning
From T100_start-3 s to T100_start+3 s

Blue+Cyan dotted lines: Time interval of the scaled map
From 0.000000 to 1.024000
2 ms binning
From T100_start-1 s to T100_start+1 s

Blue+Cyan dotted lines: Time interval of the scaled map
From 0.000000 to 1.024000
SN=5 or 10 sec. binning (whichever binning is satisfied first)
SN=5 or 10 sec. binning (T < 200 sec)

Quad-rate summed light curves (from T0-300s to T0+1000s)

Spectral Evolution
Spectra
Notes:
- 1) The fitting includes the systematic errors.
- 2) When the burst includes telescope slew time periods, the fitting uses an average response file made from multiple 5-s response files through out the slew time plus single time preiod for the non-slew times, and weighted by the total counts in the corresponding time period using addrmf. An average response file is needed becuase a spectral fit using the pre-slew DRM will introduce some errors in both a spectral shape and a normalization if the PHA file contains a lot of the slew/post-slew time interval.
- 3) For fits to more complicated models (e.g. a power-law over a cutoff power-law), the BAT team has decided to require a chi-square improvement of more than 6 for each extra dof.
Time averaged spectrum fit using the average DRM
Power-law model

Time interval is from  -21.648 sec. to   69.864 sec.

Spectral model in power-law:
------------------------------------------------------------
Parameters  : value       lower 90%   higher 90%
Photon index: 1.47306     ( -0.0442559   0.0442169 )
Norm@50keV  : 8.27817E-03    ( -0.000200673   0.000200672 )
------------------------------------------------------------
#Fit statistic  : Chi-Squared                   74.04     using 59 bins.
 Reduced chi-squared = 1.29895
# Null hypothesis probability of 6.41e-02 with 57 degrees of freedom

Photon flux (15-150 keV)    in 91.51 sec: 1.02616 ( -0.027324  0.02739 ) ph/cm2/s
Energy fluence (15-150 keV)             : 7.22002e-06 ( -1.84138e-07  1.84528e-07 ) ergs/cm2
Cutoff power-law model

Time interval is from  -21.648 sec. to   69.864 sec.
Spectral model in the cutoff power-law:
------------------------------------------------------------
Parameters  : value       lower 90%   higher 90%
Photon index: 0.912555     ( -0.196832   0.188372 )
Epeak [keV] : 105.273      ( -14.1585 25.9435 )
Norm@50keV  : 1.50374E-02    ( -0.00266651   0.00340184 )
------------------------------------------------------------
#Fit statistic  : Chi-Squared                   46.03     using 59 bins.
 Reduced chi-squared = 0.821964
# Null hypothesis probability of 8.27e-01 with 56 degrees of freedom

Photon flux (15-150 keV)    in 91.51 sec: 0.987958 ( -0.029675  0.029772 ) ph/cm2/s
Energy fluence (15-150 keV)             : 6.95759e-06 ( -2.0456e-07  2.04317e-07 ) ergs/cm2
Band function

Time interval is from  -21.648 sec. to   69.864 sec.


Spectral model in the Band function:
------------------------------------------------------------
Parameters  : value       lower 90%   higher 90%
alpha       :    (     )
beta        :     (     )
Epeak [keV] :       (   )
Norm@50keV   :     (     )
------------------------------------------------------------

Photon flux (15-150 keV)    in  sec:  (    ) ph/cm2/s
Energy fluence (15-150 keV)             : 0 ( 0  0 ) ergs/cm2
Single BB
Spectral model blackbody:
------------------------------------------------------------
Parameters  : value    Lower 90%  Upper 90%
kT [keV]    : 16.7179  (  )
R^2/D10^2   : 7.88491E-02  (   )
(R is the radius in km and D10 is the distance to the source in units of 10 kpc)
------------------------------------------------------------
#Fit statistic  : Chi-Squared                  295.77     using 59 bins.
 Reduced chi-squared =
# Null hypothesis probability of 5.99e-34 with 57 degrees of freedom

Energy  Fluence     90% Error
[keV]   [erg/cm2]   [erg/cm2]
15- 25  4.126e-07   2.050e-08
25- 50  1.801e-06   5.719e-08
50-150  3.574e-06   1.409e-07
15-150  5.787e-06   1.647e-07
Thermal bremsstrahlung (OTTB)

Spectral model: thermal bremsstrahlung
------------------------------------------------------------
Parameters  : value         Lower 90%    Upper 90%
kT [keV]    : 200.000       (-6.978      -200)
Norm        : 4.24600       (-0.102838     0.102838)
------------------------------------------------------------
#Fit statistic  : Chi-Squared                   66.65     using 59 bins.
 Reduced chi-squared =
# Null hypothesis probability of 1.79e-01 with 57 degrees of freedom

Energy  Fluence     90% Error
[keV]   [erg/cm2]   [erg/cm2]
15- 25  9.677e-07   2.562e-08
25- 50  1.862e-06   4.896e-08
50-150  4.083e-06   1.130e-07
15-150  6.912e-06   1.853e-07
Double BB
Spectral model: bbodyrad<1> + bbodyrad<2>
------------------------------------------------------------
Parameters  : value         Lower 90%    Upper 90%
kT1 [keV]   : 8.07190        (-0.817141      0.875032)
R1^2/D10^2  : 0.580590        (-0.156172      0.236326)
kT2 [keV]   : 26.9983        (-2.41327      3.22369)
R2^2/D10^2  : 1.15077E-02    (-0.0039701   0.00499283)
------------------------------------------------------------
#Fit statistic  : Chi-Squared                   43.50     using 59 bins.
 Reduced chi-squared =
# Null hypothesis probability of 8.68e-01 with 55 degrees of freedom

Energy  Fluence     90% Error
[keV]   [erg/cm2]   [erg/cm2]
15- 25  7.579e-07   6.767e-08
25- 50  1.873e-06   1.080e-07
50-150  4.312e-06   2.883e-07
15-150  6.943e-06   4.443e-07
Peak spectrum fit
Power-law model

Time interval is from    0.260 sec. to    1.260 sec.

Spectral model in power-law:
------------------------------------------------------------
Parameters  : value       lower 90%   higher 90%
Photon index: 1.10202     ( -0.125491   0.12377 )
Norm@50keV  : 2.89143E-02    ( -0.00216399   0.00216222 )
------------------------------------------------------------
#Fit statistic  : Chi-Squared                   48.70     using 59 bins.
 Reduced chi-squared = 0.854386
# Null hypothesis probability of 7.75e-01 with 57 degrees of freedom

Photon flux (15-150 keV)    in 1 sec: 3.35453 ( -0.25714  0.25738 ) ph/cm2/s
Energy fluence (15-150 keV)             : 3.02141e-07 ( -2.46557e-08  2.47779e-08 ) ergs/cm2
Cutoff power-law model

Time interval is from    0.260 sec. to    1.260 sec.
Spectral model in the cutoff power-law:
------------------------------------------------------------
Parameters  : value       lower 90%   higher 90%
Photon index: 0.741878     ( -0.545989   0.413886 )
Epeak [keV] : 192.357      ( -84.8734 -192.358 )
Norm@50keV  : 4.27385E-02    ( -0.015096   0.0330887 )
------------------------------------------------------------
#Fit statistic  : Chi-Squared                   47.13     using 59 bins.
 Reduced chi-squared = 0.841607
# Null hypothesis probability of 7.95e-01 with 56 degrees of freedom

Photon flux (15-150 keV)    in 1 sec: 3.32156 ( -0.26134  0.26134 ) ph/cm2/s
Energy fluence (15-150 keV)             : 2.97208e-07 ( -2.62076e-08  2.59166e-08 ) ergs/cm2
Band function

Time interval is from    0.260 sec. to    1.260 sec.


Spectral model in the Band function:
------------------------------------------------------------
Parameters  : value       lower 90%   higher 90%
alpha       :    (     )
beta        :     (     )
Epeak [keV] :       (   )
Norm@50keV   :     (     )
------------------------------------------------------------

Photon flux (15-150 keV)    in  sec:  (    ) ph/cm2/s
Energy fluence (15-150 keV)             : 0 ( 0  0 ) ergs/cm2
Single BB

Spectral model blackbody:
------------------------------------------------------------
Parameters  : value    Lower 90%  Upper 90%
kT [keV]    : 19.5269  (-1.88296  2.16983)
R^2/D10^2   : 0.174038  (-0.0506761   0.0685789)
(R is the radius in km and D10 is the distance to the source in units of 10 kpc)
------------------------------------------------------------
#Fit statistic  : Chi-Squared                   76.33     using 59 bins.
 Reduced chi-squared =
# Null hypothesis probability of 4.46e-02 with 57 degrees of freedom

Energy  Fluence     90% Error
[keV]   [erg/cm2]   [erg/cm2]
15- 25  1.291e-08   1.900e-09
25- 50  6.329e-08   7.145e-09
50-150  1.782e-07   2.460e-08
15-150  2.545e-07   2.610e-08
Thermal bremsstrahlung (OTTB)
Spectral model: thermal bremsstrahlung
------------------------------------------------------------
Parameters  : value         Lower 90%    Upper 90%
kT [keV]    : 200.000       (-13.3275      -200)
Norm        : 13.7128       (-1.05953     1.05953)
------------------------------------------------------------
#Fit statistic  : Chi-Squared                   81.84     using 59 bins.
 Reduced chi-squared =
# Null hypothesis probability of 1.72e-02 with 57 degrees of freedom

Energy  Fluence     90% Error
[keV]   [erg/cm2]   [erg/cm2]
15- 25  3.415e-08   3.200e-09
25- 50  6.570e-08   7.365e-09
50-150  1.441e-07   5.156e-08
15-150  2.439e-07   6.275e-08
Double BB
Spectral model: bbodyrad<1> + bbodyrad<2>
------------------------------------------------------------
Parameters  : value         Lower 90%    Upper 90%
kT1 [keV]   : 11.5780        (-3.27293      2.86918)
R1^2/D10^2  : 0.656441        (-0.288691      1.00038)
kT2 [keV]   : 54.2772        (-24.1544      -54.742)
R2^2/D10^2  : 5.64696E-03    (-0.00511704   0.0273678)
------------------------------------------------------------
#Fit statistic  : Chi-Squared                   45.21     using 59 bins.
 Reduced chi-squared =
# Null hypothesis probability of 8.24e-01 with 55 degrees of freedom

Energy  Fluence     90% Error
[keV]   [erg/cm2]   [erg/cm2]
15- 25  2.024e-08   5.670e-09
25- 50  6.843e-08   2.149e-08
50-150  2.092e-07   1.011e-07
15-150  2.979e-07   1.152e-07
Pre-slew spectrum (Pre-slew PHA with pre-slew DRM)
Power-law model

Spectral model in power-law:
------------------------------------------------------------
Parameters  : value       lower 90%   higher 90%
Photon index: 1.25534     ( -0.0475405   0.0473299 )
Norm@50keV  : 1.27368E-02    ( -0.000350471   0.0003504 )
------------------------------------------------------------
#Fit statistic  : Chi-Squared                   92.97     using 59 bins.
 Reduced chi-squared =
# Null hypothesis probability of 1.85e-03 with 57 degrees of freedom

Photon flux (15-150 keV)    in 34.48 sec: 1.50773 ( -0.0440912  0.0441616 ) ph/cm2/s
Energy fluence (15-150 keV)             : 4.38899e-06 ( -1.27828e-07  1.27986e-07 ) ergs/cm2
Cutoff power-law model

Spectral model in the cutoff power-law:
------------------------------------------------------------
Parameters  : value       lower 90%   higher 90%
Photon index: 0.553218     ( -0.217287   0.206628 )
Epeak [keV] : 114.566      ( -14.7006 24.7595 )
Norm@50keV  : 2.66272E-02    ( -0.00506114   0.00657872 )
------------------------------------------------------------
#Fit statistic  : Chi-Squared                   55.48     using 59 bins.
 Reduced chi-squared =
# Null hypothesis probability of 4.95e-01 with 56 degrees of freedom

Photon flux (15-150 keV)    in 34.48 sec: 1.45520 ( -0.04626  0.04633 ) ph/cm2/s
Energy fluence (15-150 keV)             : 4.22883e-06 ( -1.38472e-07  1.37817e-07 ) ergs/cm2
Band function

Spectral model in the Band function:
------------------------------------------------------------
Parameters  : value       lower 90%   higher 90%
alpha       :    (     )
beta        :     (     )
Epeak [keV] :       (   )
Norm@50keV   :     (     )
------------------------------------------------------------

Photon flux (15-150 keV)    in  sec:  (    ) ph/cm2/s
Energy fluence (15-150 keV)             : 0 ( 0  0 ) ergs/cm2
S(25-50 keV) vs. S(50-100 keV) plot
S(25-50 keV)  = 1.77e-06
S(50-100 keV) = 2.53e-06
T90 vs. Hardness ratio plot

T90                                   = 67.5239999294281 sec.
Hardness ratio (energy fluence ratio) = 1.42938
Color vs. Color plot
Count Ratio  (25-50 keV) / (15-25 keV) = 1.55826
Count Ratio (50-100 keV) / (15-25 keV) = 1.20291
Mask shadow pattern

IMX = -2.879613186281215E-01, IMY = 3.685438577558459E-01
TIME vs. PHA plot around the trigger time
Blue+Cyan dotted lines: Time interval of the scaled map
From 0.000000 to 1.024000
TIME vs. DetID plot around the trigger time

Blue+Cyan dotted lines: Time interval of the scaled map
From 0.000000 to 1.024000
100 us light curve (15-350 keV)
Blue+Cyan dotted lines: Time interval of the scaled map
From 0.000000 to 1.024000
Spacecraft aspect plot

Bright source in the pre-burst/pre-slew/post-slew images
Pre-burst image of 15-350 keV band
Time interval of the image:
-239.072000 -21.648000

# RAcent  DECcent POSerr Theta    Phi  PeakCts   SNR AngSep     Name
#  [deg]    [deg]    ['] [deg]  [deg]                   [']
254.4625  35.4708   10.6  31.9   96.2  -0.4631  -1.1    7.7	Her X-1
268.3547  -1.4599    6.5  37.0   24.0   0.7642   1.8    0.9	SW J1753.5-0127
270.3993 -24.9709   26.9  56.9    6.3   0.8075   0.4    9.0	GX 5-1
274.0242 -14.0221    6.9  45.5    7.5   0.7639   1.7    1.4	GX 17+2
285.0432 -24.9195   17.3  53.5   -9.3   0.4622   0.7    0.4	HT1900.1-2455
288.7489  10.9623   12.5  17.5   -8.1  -0.2368  -0.9    3.1	GRS 1915+105
299.6504  35.1979    2.0   9.9 -152.6   1.4300   5.7    3.0	Cyg X-1
308.0548  40.9586    2.1  18.7 -153.4   1.3621   5.4    2.5	Cyg X-3
326.1915  38.4748    5.5  30.7 -134.8   0.7660   2.1    9.2	Cyg X-2
263.8811   5.0005    3.0  34.9   36.9   1.6935   3.9 ------	UNKNOWN
285.1580 -23.9631    3.0  52.6   -9.3   2.4093   3.9 ------	UNKNOWN
  3.6211  67.4848    2.5  57.3 -170.6   5.1924   4.6 ------	UNKNOWN
330.2608  49.3133    3.0  36.3 -152.5   1.3233   3.9 ------	UNKNOWN
Pre-slew background subtracted image of 15-350 keV band
Time interval of the image:
-21.648000 12.828590

# RAcent  DECcent POSerr Theta    Phi  PeakCts   SNR AngSep     Name
#  [deg]    [deg]    ['] [deg]  [deg]                   [']
254.6322  35.4807   60.3  31.7   96.2   0.0415   0.2   11.9	Her X-1
268.4541  -1.3947    5.4  36.9   23.9  -0.3865  -2.1    6.2	SW J1753.5-0127
270.3694 -25.1168  144.2  57.1    6.3   0.0501   0.1    5.2	GX 5-1
273.9014 -14.0018    6.0  45.5    7.6  -0.4210  -1.9    6.4	GX 17+2
284.8840 -25.0171    4.3  53.7   -9.1  -0.8250  -2.7   10.1	HT1900.1-2455
288.8535  10.9805   11.1  17.4   -8.4   0.1081   1.0    3.9	GRS 1915+105
299.5702  35.0477    4.1   9.8 -152.1   0.2989   2.8    9.3	Cyg X-1
307.9915  40.8318   10.9  18.6 -153.2   0.1145   1.1    9.0	Cyg X-3
325.9390  38.2927    0.0  30.5 -134.6  -0.1159  -0.8   11.1	Cyg X-2
246.7400  63.4135    3.4  45.2  137.4   1.6227   3.4 ------	UNKNOWN
319.8089  34.5475    0.2  25.1 -128.0   6.3438  48.6 ------	UNKNOWN
352.1631  40.0258    3.0  50.8 -136.5   1.9210   3.8 ------	UNKNOWN
Post-slew image of 15-350 keV band
Time interval of the image:
65.428600 962.982600

# RAcent  DECcent POSerr Theta    Phi  PeakCts   SNR AngSep     Name
#  [deg]    [deg]    ['] [deg]  [deg]                   [']
288.7042  10.8817   23.2  36.9    5.2  -0.5325  -0.5    6.7	GRS 1915+105
299.5781  35.1948    2.0  16.5   45.6   5.1238   5.7    0.7	Cyg X-1
308.2107  40.9406    1.6  11.1   75.9   5.8217   7.3    4.6	Cyg X-3
326.2370  38.2947    4.6   6.4 -179.8   1.7998   2.5    3.5	Cyg X-2
310.7873  57.3185    4.0  23.5  115.4   3.3310   2.9 ------	UNKNOWN
338.0413  16.1963    2.8  24.6  -98.6   4.5305   4.0 ------	UNKNOWN
 32.2298  31.1611    5.7  59.6 -161.3  19.7812   2.0 ------	UNKNOWN
Plot creation:
Sat Jul 30 07:12:47 EDT 2022