Estimated redshift from machine learning (Ukwatta et al. 2016) - may take a few minute to calcaulte
Image
Pre-slew 15.0-350.0 keV image (Event data)

#   RAcent    DECcent   POSerr    Theta     Phi              Peak Cts       SNR   Name
  129.9636    60.2031   0.0033    31.5573  -124.3267         9.6656736     57.055 TRIG_01035994

Foreground time interval of the image:
 -0.176   9.241 (delta_t =   9.417 [sec])
Background time interval of the image:
-239.860  -0.176 (delta_t = 239.684 [sec])
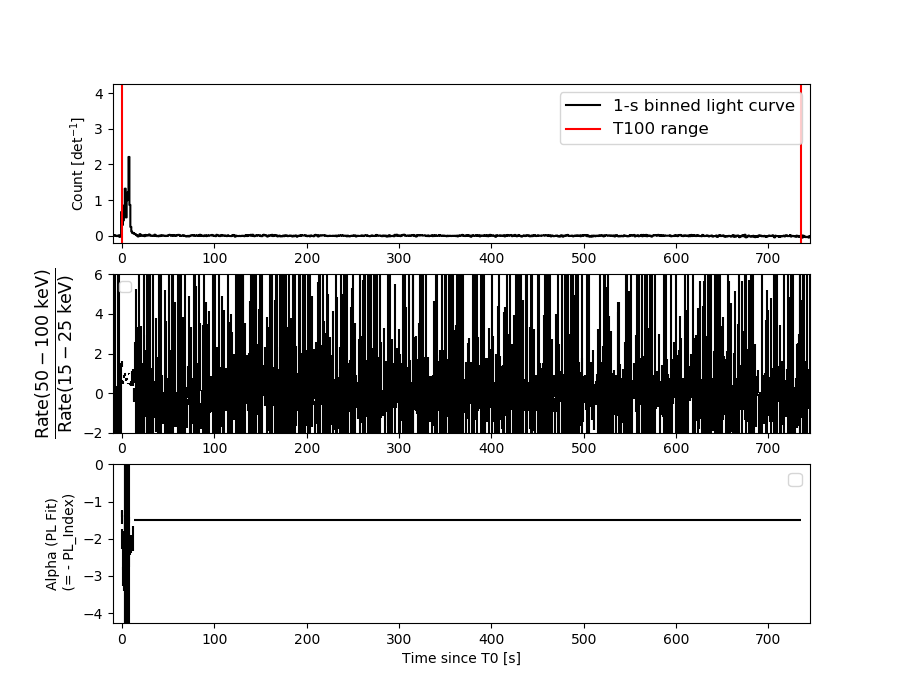
Lightcurves
Notes:
- 1) The mask-weighted light curves are using the flight position.
- 2) Multiple plots of different time binning/intervals are shown to cover all scenarios of short/long GRBs, rate/image triggers, and real/false positives.
- 3) For all the mask-weighted lightcurves, the y-axis units are counts/sec/det where a det is 0.4 x 0.4 = 0.16 sq cm.
- 4) The verticle lines correspond to following: green dotted lines are T50 interval, black dotted lines are T90 interval, blue solid line(s) is a spacecraft slew start time, and orange solid line(s) is a spacecraft slew end time.
- 5) Time of each bin is in the middle of the bin.
1 s binning
From T0-310 s to T0+310 s
From T100_start - 20 s to T100_end + 30 s
Full time interval

64 ms binning
Full time interval

From T100_start to T100_end
From T0-5 sec to T0+5 sec
16 ms binning
From T100_start-5 s to T100_start+5 s
Blue+Cyan dotted lines: Time interval of the scaled map
From 0.000000 to 0.064000
8 ms binning
From T100_start-3 s to T100_start+3 s
Blue+Cyan dotted lines: Time interval of the scaled map
From 0.000000 to 0.064000
2 ms binning
From T100_start-1 s to T100_start+1 s
Blue+Cyan dotted lines: Time interval of the scaled map
From 0.000000 to 0.064000
SN=5 or 10 sec. binning (whichever binning is satisfied first)
SN=5 or 10 sec. binning (T < 200 sec)

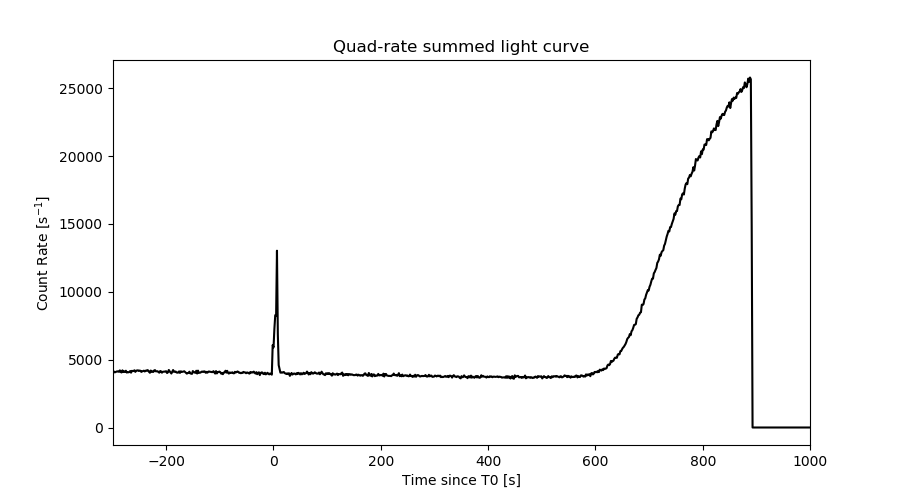
Quad-rate summed light curves (from T0-300s to T0+1000s)
Spectral Evolution
Spectra
Notes:
- 1) The fitting includes the systematic errors.
- 2) When the burst includes telescope slew time periods, the fitting uses an average response file made from multiple 5-s response files through out the slew time plus single time preiod for the non-slew times, and weighted by the total counts in the corresponding time period using addrmf. An average response file is needed becuase a spectral fit using the pre-slew DRM will introduce some errors in both a spectral shape and a normalization if the PHA file contains a lot of the slew/post-slew time interval.
- 3) For fits to more complicated models (e.g. a power-law over a cutoff power-law), the BAT team has decided to require a chi-square improvement of more than 6 for each extra dof.
Time averaged spectrum fit using the average DRM
Power-law model

Time interval is from   -0.176 sec. to  734.988 sec.

Spectral model in power-law:
------------------------------------------------------------
Parameters  : value       lower 90%   higher 90%
Photon index: 1.73758     ( -0.112066   0.114076 )
Norm@50keV  : 8.02962E-04    ( -5.74465e-05   5.70016e-05 )
------------------------------------------------------------
#Fit statistic  : Chi-Squared                   54.89     using 59 bins.
 Reduced chi-squared = 0.962982
# Null hypothesis probability of 5.55e-01 with 57 degrees of freedom

Photon flux (15-150 keV)    in 735.2 sec: 0.108086 ( -0.007088  0.007093 ) ph/cm2/s
Energy fluence (15-150 keV)             : 5.45212e-06 ( -4.03698e-07  4.07853e-07 ) ergs/cm2
Cutoff power-law model
Time interval is from   -0.176 sec. to  734.988 sec.
Spectral model in the cutoff power-law:
------------------------------------------------------------
Parameters  : value       lower 90%   higher 90%
Photon index: 0.599724     ( -0.646098   0.557756 )
Epeak [keV] : 54.7878      ( -7.02534 13.3586 )
Norm@50keV  : 3.37101E-03    ( -0.00168533   0.00422465 )
------------------------------------------------------------
#Fit statistic  : Chi-Squared                   41.02     using 59 bins.
 Reduced chi-squared = 0.7325
# Null hypothesis probability of 9.33e-01 with 56 degrees of freedom

Photon flux (15-150 keV)    in 735.2 sec: 0.102885 ( -0.0074727  0.007486 ) ph/cm2/s
Energy fluence (15-150 keV)             : 4.90677e-06 ( -4.51791e-07  4.68814e-07 ) ergs/cm2
Band function

Time interval is from   -0.176 sec. to  734.988 sec.


Spectral model in the Band function:
------------------------------------------------------------
Parameters  : value       lower 90%   higher 90%
alpha       :    (     )
beta        :     (     )
Epeak [keV] :       (   )
Norm@50keV   :     (     )
------------------------------------------------------------

Photon flux (15-150 keV)    in  sec:  (    ) ph/cm2/s
Energy fluence (15-150 keV)             : 0 ( 0  0 ) ergs/cm2
Single BB
Spectral model blackbody:
------------------------------------------------------------
Parameters  : value    Lower 90%  Upper 90%
kT [keV]    : 11.9882  (-0.832503  0.90359)
R^2/D10^2   : 2.67867E-02  (-0.00636467   0.00823688)
(R is the radius in km and D10 is the distance to the source in units of 10 kpc)
------------------------------------------------------------
#Fit statistic  : Chi-Squared                   62.95     using 59 bins.
 Reduced chi-squared =
# Null hypothesis probability of 2.74e-01 with 57 degrees of freedom

Energy  Fluence     90% Error
[keV]   [erg/cm2]   [erg/cm2]
15- 25  5.986e-07   6.620e-08
25- 50  1.882e-06   1.540e-07
50-150  1.625e-06   2.400e-07
15-150  4.105e-06   3.353e-07
Thermal bremsstrahlung (OTTB)

Spectral model: thermal bremsstrahlung
------------------------------------------------------------
Parameters  : value         Lower 90%    Upper 90%
kT [keV]    : 105.222       (-22.0883      37.2258)
Norm        : 0.477352       (-0.0418812     0.0441328)
------------------------------------------------------------
#Fit statistic  : Chi-Squared                   45.22     using 59 bins.
 Reduced chi-squared =
# Null hypothesis probability of 8.70e-01 with 57 degrees of freedom

Energy  Fluence     90% Error
[keV]   [erg/cm2]   [erg/cm2]
15- 25  9.171e-07   9.594e-08
25- 50  1.602e-06   1.268e-07
50-150  2.670e-06   8.359e-07
15-150  5.189e-06   9.664e-07
Double BB
Spectral model: bbodyrad<1> + bbodyrad<2>
------------------------------------------------------------
Parameters  : value         Lower 90%    Upper 90%
kT1 [keV]   : 8.10549        (-2.48835      2.04181)
R1^2/D10^2  : 7.56849E-02        (-0.0340926      0.128013)
kT2 [keV]   : 22.6548        (-7.06521      24.8272)
R2^2/D10^2  : 1.50564E-03    (-0.00138622   0.00647472)
------------------------------------------------------------
#Fit statistic  : Chi-Squared                   40.78     using 59 bins.
 Reduced chi-squared =
# Null hypothesis probability of 9.24e-01 with 55 degrees of freedom

Energy  Fluence     90% Error
[keV]   [erg/cm2]   [erg/cm2]
15- 25  7.712e-07   1.892e-07
25- 50  1.753e-06   4.900e-07
50-150  2.467e-06   1.132e-06
15-150  4.991e-06   1.595e-06
Peak spectrum fit
Power-law model
Time interval is from    7.504 sec. to    8.504 sec.

Spectral model in power-law:
------------------------------------------------------------
Parameters  : value       lower 90%   higher 90%
Photon index: 1.74586     ( -0.0540926   0.05449 )
Norm@50keV  : 0.153877    ( -0.00519827   0.00519157 )
------------------------------------------------------------
#Fit statistic  : Chi-Squared                  103.99     using 59 bins.
 Reduced chi-squared = 1.82439
# Null hypothesis probability of 1.44e-04 with 57 degrees of freedom

Photon flux (15-150 keV)    in 1 sec: 20.7762 ( -0.731  0.7321 ) ph/cm2/s
Energy fluence (15-150 keV)             : 1.42043e-06 ( -4.91062e-08  4.91729e-08 ) ergs/cm2
Cutoff power-law model
Time interval is from    7.504 sec. to    8.504 sec.
Spectral model in the cutoff power-law:
------------------------------------------------------------
Parameters  : value       lower 90%   higher 90%
Photon index: 0.618669     ( -0.278142   0.262511 )
Epeak [keV] : 62.8104      ( -4.11045 5.33028 )
Norm@50keV  : 0.552749    ( -0.139608   0.200295 )
------------------------------------------------------------
#Fit statistic  : Chi-Squared                   40.13     using 59 bins.
 Reduced chi-squared = 0.716607
# Null hypothesis probability of 9.46e-01 with 56 degrees of freedom

Photon flux (15-150 keV)    in 1 sec: 19.6990 ( -0.7592  0.7616 ) ph/cm2/s
Energy fluence (15-150 keV)             : 1.3489e-06 ( -5.19895e-08  5.20415e-08 ) ergs/cm2
Band function

Time interval is from    7.504 sec. to    8.504 sec.


Spectral model in the Band function:
------------------------------------------------------------
Parameters  : value       lower 90%   higher 90%
alpha       :    (     )
beta        :     (     )
Epeak [keV] :       (   )
Norm@50keV   :     (     )
------------------------------------------------------------

Photon flux (15-150 keV)    in  sec:  (    ) ph/cm2/s
Energy fluence (15-150 keV)             : 0 ( 0  0 ) ergs/cm2
Single BB
Spectral model blackbody:
------------------------------------------------------------
Parameters  : value    Lower 90%  Upper 90%
kT [keV]    : 14.0524  (  )
R^2/D10^2   : 2.92165  (   )
(R is the radius in km and D10 is the distance to the source in units of 10 kpc)
------------------------------------------------------------
#Fit statistic  : Chi-Squared                  150.15     using 59 bins.
 Reduced chi-squared =
# Null hypothesis probability of 2.55e-10 with 57 degrees of freedom

Energy  Fluence     90% Error
[keV]   [erg/cm2]   [erg/cm2]
15- 25  1.218e-07   7.850e-09
25- 50  4.548e-07   1.790e-08
50-150  5.925e-07   3.680e-08
15-150  1.169e-06   4.050e-08
Thermal bremsstrahlung (OTTB)

Spectral model: thermal bremsstrahlung
------------------------------------------------------------
Parameters  : value         Lower 90%    Upper 90%
kT [keV]    : 116.430       (-12.128      19.0505)
Norm        : 90.4568       (-4.34581     3.85295)
------------------------------------------------------------
#Fit statistic  : Chi-Squared                   59.50     using 59 bins.
 Reduced chi-squared =
# Null hypothesis probability of 3.85e-01 with 57 degrees of freedom

Energy  Fluence     90% Error
[keV]   [erg/cm2]   [erg/cm2]
15- 25  2.270e-07   1.525e-08
25- 50  4.089e-07   2.075e-08
50-150  7.437e-07   1.710e-07
15-150  1.380e-06   1.855e-07
Double BB
Spectral model: bbodyrad<1> + bbodyrad<2>
------------------------------------------------------------
Parameters  : value         Lower 90%    Upper 90%
kT1 [keV]   : 7.10964        (-1.06663      1.16791)
R1^2/D10^2  : 18.0023        (-6.57259      12.6395)
kT2 [keV]   : 20.1341        (-1.86022      2.59846)
R2^2/D10^2  : 0.575328    (-0.244712   0.315583)
------------------------------------------------------------
#Fit statistic  : Chi-Squared                   40.37     using 59 bins.
 Reduced chi-squared =
# Null hypothesis probability of 9.30e-01 with 55 degrees of freedom

Energy  Fluence     90% Error
[keV]   [erg/cm2]   [erg/cm2]
15- 25  1.934e-07   2.830e-08
25- 50  4.339e-07   3.825e-08
50-150  7.115e-07   6.570e-08
15-150  1.339e-06   1.375e-07
Pre-slew spectrum (Pre-slew PHA with pre-slew DRM)
Power-law model

Spectral model in power-law:
------------------------------------------------------------
Parameters  : value       lower 90%   higher 90%
Photon index: 1.90490     ( -0.0390888   0.0392223 )
Norm@50keV  : 6.51320E-02    ( -0.00141121   0.00141064 )
------------------------------------------------------------
#Fit statistic  : Chi-Squared                  107.19     using 59 bins.
 Reduced chi-squared =
# Null hypothesis probability of 6.51e-05 with 57 degrees of freedom

Photon flux (15-150 keV)    in 9.417 sec: 9.36662 ( -0.23724  0.238215 ) ph/cm2/s
Energy fluence (15-150 keV)             : 5.63919e-06 ( -1.21832e-07  1.21851e-07 ) ergs/cm2
Cutoff power-law model
Spectral model in the cutoff power-law:
------------------------------------------------------------
Parameters  : value       lower 90%   higher 90%
Photon index: 1.14589     ( -0.190712   0.18313 )
Epeak [keV] : 59.1421      ( -3.45177 4.26488 )
Norm@50keV  : 0.149116    ( -0.0264993   0.0337982 )
------------------------------------------------------------
#Fit statistic  : Chi-Squared                   51.04     using 59 bins.
 Reduced chi-squared =
# Null hypothesis probability of 6.63e-01 with 56 degrees of freedom

Photon flux (15-150 keV)    in 9.417 sec: 8.79879 ( -0.26289  0.26484 ) ph/cm2/s
Energy fluence (15-150 keV)             : 5.37606e-06 ( -1.36518e-07  1.36283e-07 ) ergs/cm2
Band function

Spectral model in the Band function:
------------------------------------------------------------
Parameters  : value       lower 90%   higher 90%
alpha       :    (     )
beta        :     (     )
Epeak [keV] :       (   )
Norm@50keV   :     (     )
------------------------------------------------------------

Photon flux (15-150 keV)    in  sec:  (    ) ph/cm2/s
Energy fluence (15-150 keV)             : 0 ( 0  0 ) ergs/cm2
S(25-50 keV) vs. S(50-100 keV) plot

S(25-50 keV)  = 1.50e-06
S(50-100 keV) = 1.80e-06
T90 vs. Hardness ratio plot
T90                                   = 637.31199991703 sec.
Hardness ratio (energy fluence ratio) = 1.2
Color vs. Color plot
Count Ratio  (25-50 keV) / (15-25 keV) = 1.46135
Count Ratio (50-100 keV) / (15-25 keV) = 0.757806
Mask shadow pattern
IMX = -3.463410182310839E-01, IMY = 5.072082088400764E-01
TIME vs. PHA plot around the trigger time

Blue+Cyan dotted lines: Time interval of the scaled map
From 0.000000 to 0.064000
TIME vs. DetID plot around the trigger time
Blue+Cyan dotted lines: Time interval of the scaled map
From 0.000000 to 0.064000
100 us light curve (15-350 keV)
Blue+Cyan dotted lines: Time interval of the scaled map
From 0.000000 to 0.064000
Spacecraft aspect plot
Bright source in the pre-burst/pre-slew/post-slew images
Pre-burst image of 15-350 keV band
Time interval of the image:
-239.860000 -0.176000

# RAcent  DECcent POSerr Theta    Phi  PeakCts   SNR AngSep     Name
#  [deg]    [deg]    ['] [deg]  [deg]                   [']
177.6967  -0.0155    2.6  39.7   71.4   4.2635   4.4 ------	UNKNOWN
208.9944  22.4756    3.1  39.8   10.4   1.6659   3.7 ------	UNKNOWN
228.9031  33.1161    3.0  50.3  -14.8   2.6967   3.9 ------	UNKNOWN
 92.7945  38.4551    3.2  55.8 -155.3   4.8507   3.6 ------	UNKNOWN
Pre-slew background subtracted image of 15-350 keV band
Time interval of the image:
-0.176000 9.240590

# RAcent  DECcent POSerr Theta    Phi  PeakCts   SNR AngSep     Name
#  [deg]    [deg]    ['] [deg]  [deg]                   [']
156.8273  20.3095    2.5  19.6  116.5   0.4663   4.5 ------	UNKNOWN
232.9648  22.2109    2.8  58.7   -5.1   2.3476   4.2 ------	UNKNOWN
129.9636  60.2031    0.2  31.6 -124.3   9.6655  57.1 ------	UNKNOWN
100.8076  48.0610    3.0  47.2 -146.1   0.9594   3.8 ------	UNKNOWN
Post-slew image of 15-350 keV band
Time interval of the image:
64.040610 902.210000

# RAcent  DECcent POSerr Theta    Phi  PeakCts   SNR AngSep     Name
#  [deg]    [deg]    ['] [deg]  [deg]                   [']
 83.6099  21.9841    4.2  50.0 -165.6  22.6805   2.7    2.2	Crab
191.3472  34.5439    3.8  46.5   48.0  39.2271   3.1 ------	UNKNOWN
 79.7732  15.3055    2.8  57.6 -165.4  55.4716   4.2 ------	UNKNOWN
Plot creation:
Sat Jul 30 07:12:15 EDT 2022