Estimated redshift from machine learning (Ukwatta et al. 2016) - may take a few minute to calcaulte
Image
Pre-slew 15.0-350.0 keV image (Event data)

#   RAcent    DECcent   POSerr    Theta     Phi              Peak Cts       SNR   Name
   67.0815    37.4296   0.0054    44.9420  -147.1295         4.9927045     35.658 TRIG_01036227

Foreground time interval of the image:
 -0.040   8.792 (delta_t =   8.832 [sec])
Background time interval of the image:
-239.488  -0.040 (delta_t = 239.448 [sec])
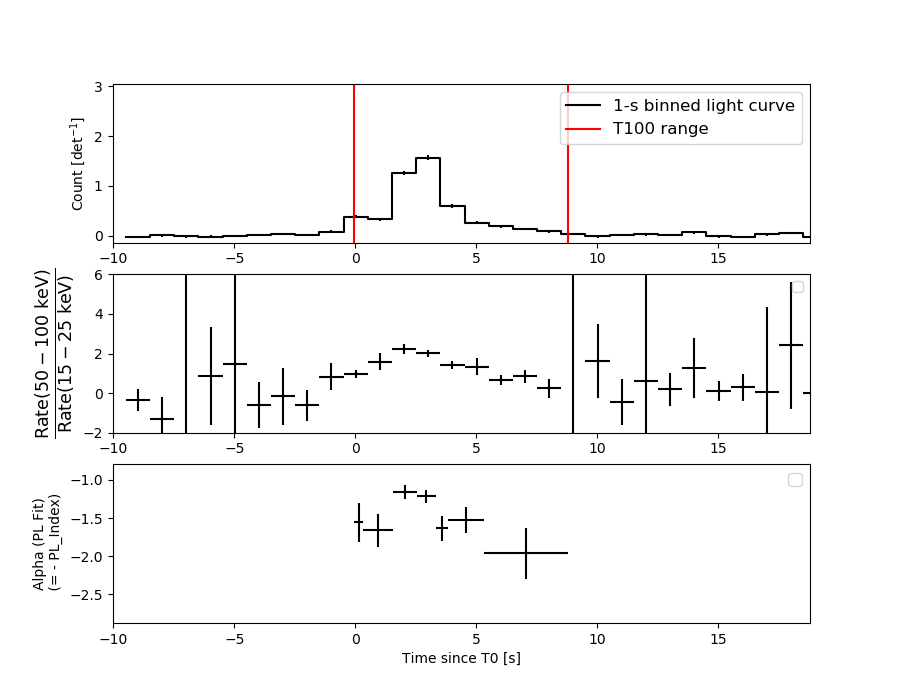
Lightcurves
Notes:
- 1) The mask-weighted light curves are using the flight position.
- 2) Multiple plots of different time binning/intervals are shown to cover all scenarios of short/long GRBs, rate/image triggers, and real/false positives.
- 3) For all the mask-weighted lightcurves, the y-axis units are counts/sec/det where a det is 0.4 x 0.4 = 0.16 sq cm.
- 4) The verticle lines correspond to following: green dotted lines are T50 interval, black dotted lines are T90 interval, blue solid line(s) is a spacecraft slew start time, and orange solid line(s) is a spacecraft slew end time.
- 5) Time of each bin is in the middle of the bin.
1 s binning
From T0-310 s to T0+310 s
From T100_start - 20 s to T100_end + 30 s

Full time interval

64 ms binning
Full time interval
From T100_start to T100_end
From T0-5 sec to T0+5 sec
16 ms binning
From T100_start-5 s to T100_start+5 s
Blue+Cyan dotted lines: Time interval of the scaled map
From 0.000000 to 0.512000
8 ms binning
From T100_start-3 s to T100_start+3 s

Blue+Cyan dotted lines: Time interval of the scaled map
From 0.000000 to 0.512000
2 ms binning
From T100_start-1 s to T100_start+1 s
Blue+Cyan dotted lines: Time interval of the scaled map
From 0.000000 to 0.512000
SN=5 or 10 sec. binning (whichever binning is satisfied first)

SN=5 or 10 sec. binning (T < 200 sec)
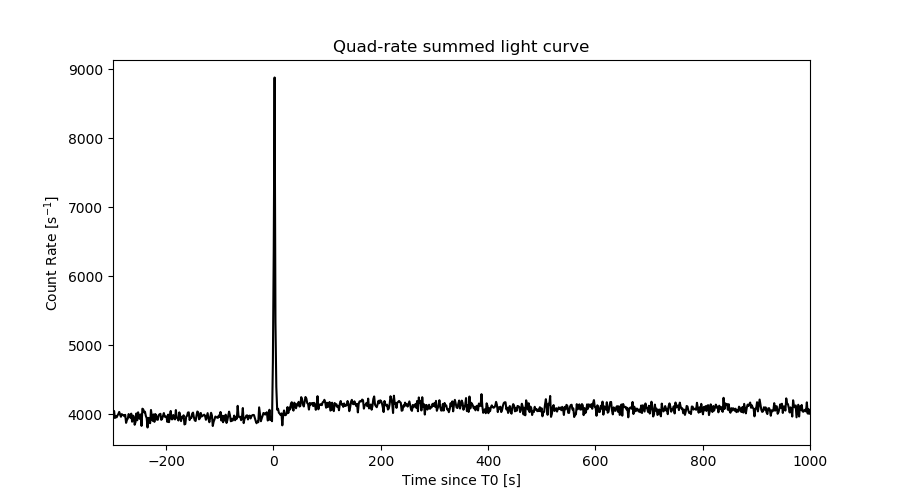
Quad-rate summed light curves (from T0-300s to T0+1000s)
Spectral Evolution
Spectra
Notes:
- 1) The fitting includes the systematic errors.
- 2) When the burst includes telescope slew time periods, the fitting uses an average response file made from multiple 5-s response files through out the slew time plus single time preiod for the non-slew times, and weighted by the total counts in the corresponding time period using addrmf. An average response file is needed becuase a spectral fit using the pre-slew DRM will introduce some errors in both a spectral shape and a normalization if the PHA file contains a lot of the slew/post-slew time interval.
- 3) For fits to more complicated models (e.g. a power-law over a cutoff power-law), the BAT team has decided to require a chi-square improvement of more than 6 for each extra dof.
Time averaged spectrum fit using the average DRM
Power-law model
Time interval is from   -0.040 sec. to    8.792 sec.

Spectral model in power-law:
------------------------------------------------------------
Parameters  : value       lower 90%   higher 90%
Photon index: 1.38757     ( -0.0638512   0.0638111 )
Norm@50keV  : 3.94060E-02    ( -0.00146619   0.00146617 )
------------------------------------------------------------
#Fit statistic  : Chi-Squared                   68.05     using 59 bins.
 Reduced chi-squared = 1.19386
# Null hypothesis probability of 1.50e-01 with 57 degrees of freedom

Photon flux (15-150 keV)    in 8.832 sec: 4.78563 ( -0.19138  0.19178 ) ph/cm2/s
Energy fluence (15-150 keV)             : 3.37201e-06 ( -1.32431e-07  1.32591e-07 ) ergs/cm2
Cutoff power-law model

Time interval is from   -0.040 sec. to    8.792 sec.
Spectral model in the cutoff power-law:
------------------------------------------------------------
Parameters  : value       lower 90%   higher 90%
Photon index: 0.844099     ( -0.28573   0.268852 )
Epeak [keV] : 119.833      ( -23.0674 60.4021 )
Norm@50keV  : 6.95510E-02    ( -0.016626   0.0233043 )
------------------------------------------------------------
#Fit statistic  : Chi-Squared                   55.46     using 59 bins.
 Reduced chi-squared = 0.990357
# Null hypothesis probability of 4.95e-01 with 56 degrees of freedom

Photon flux (15-150 keV)    in 8.832 sec: 4.65535 ( -0.20046  0.20116 ) ph/cm2/s
Energy fluence (15-150 keV)             : 3.29874e-06 ( -1.39165e-07  1.38886e-07 ) ergs/cm2
Band function

Time interval is from   -0.040 sec. to    8.792 sec.


Spectral model in the Band function:
------------------------------------------------------------
Parameters  : value       lower 90%   higher 90%
alpha       :    (     )
beta        :     (     )
Epeak [keV] :       (   )
Norm@50keV   :     (     )
------------------------------------------------------------

Photon flux (15-150 keV)    in  sec:  (    ) ph/cm2/s
Energy fluence (15-150 keV)             : 0 ( 0  0 ) ergs/cm2
Single BB
Spectral model blackbody:
------------------------------------------------------------
Parameters  : value    Lower 90%  Upper 90%
kT [keV]    : 18.1520  (  )
R^2/D10^2   : 0.293098  (   )
(R is the radius in km and D10 is the distance to the source in units of 10 kpc)
------------------------------------------------------------
#Fit statistic  : Chi-Squared                  168.41     using 59 bins.
 Reduced chi-squared =
# Null hypothesis probability of 6.12e-13 with 57 degrees of freedom

Energy  Fluence     90% Error
[keV]   [erg/cm2]   [erg/cm2]
15- 25  1.703e-07   1.250e-08
25- 50  7.926e-07   4.116e-08
50-150  1.900e-06   1.201e-07
15-150  2.863e-06   1.329e-07
Thermal bremsstrahlung (OTTB)
Spectral model: thermal bremsstrahlung
------------------------------------------------------------
Parameters  : value         Lower 90%    Upper 90%
kT [keV]    : 200.000       (-7.68534      -200)
Norm        : 20.1084       (-0.751029     0.751029)
------------------------------------------------------------
#Fit statistic  : Chi-Squared                   83.02     using 59 bins.
 Reduced chi-squared =
# Null hypothesis probability of 1.38e-02 with 57 degrees of freedom

Energy  Fluence     90% Error
[keV]   [erg/cm2]   [erg/cm2]
15- 25  4.424e-07   1.753e-08
25- 50  8.509e-07   3.453e-08
50-150  1.866e-06   7.905e-08
15-150  3.160e-06   1.356e-07
Double BB
Spectral model: bbodyrad<1> + bbodyrad<2>
------------------------------------------------------------
Parameters  : value         Lower 90%    Upper 90%
kT1 [keV]   : 7.06481        (-1.14659      1.33052)
R1^2/D10^2  : 3.78977        (-1.62119      3.30847)
kT2 [keV]   : 25.4793        (-2.40015      3.3616)
R2^2/D10^2  : 7.62951E-02    (-0.0287195   0.0350568)
------------------------------------------------------------
#Fit statistic  : Chi-Squared                   55.98     using 59 bins.
 Reduced chi-squared =
# Null hypothesis probability of 4.38e-01 with 55 degrees of freedom

Energy  Fluence     90% Error
[keV]   [erg/cm2]   [erg/cm2]
15- 25  3.462e-07   5.255e-08
25- 50  8.086e-07   8.201e-08
50-150  2.133e-06   2.014e-07
15-150  3.288e-06   2.950e-07
Peak spectrum fit
Power-law model

Time interval is from    2.124 sec. to    3.124 sec.

Spectral model in power-law:
------------------------------------------------------------
Parameters  : value       lower 90%   higher 90%
Photon index: 1.19472     ( -0.0836204   0.0836211 )
Norm@50keV  : 0.115541    ( -0.005965   0.00596428 )
------------------------------------------------------------
#Fit statistic  : Chi-Squared                   68.55     using 59 bins.
 Reduced chi-squared = 1.20263
# Null hypothesis probability of 1.40e-01 with 57 degrees of freedom

Photon flux (15-150 keV)    in 1 sec: 13.5522 ( -0.7235  0.7242 ) ph/cm2/s
Energy fluence (15-150 keV)             : 1.17409e-06 ( -6.54514e-08  6.55912e-08 ) ergs/cm2
Cutoff power-law model

Time interval is from    2.124 sec. to    3.124 sec.
Spectral model in the cutoff power-law:
------------------------------------------------------------
Parameters  : value       lower 90%   higher 90%
Photon index: 0.523147     ( -0.388506   0.358351 )
Epeak [keV] : 128.535      ( -27.0608 77.4114 )
Norm@50keV  : 0.229619    ( -0.0688193   0.106577 )
------------------------------------------------------------
#Fit statistic  : Chi-Squared                   57.68     using 59 bins.
 Reduced chi-squared = 1.03
# Null hypothesis probability of 4.13e-01 with 56 degrees of freedom

Photon flux (15-150 keV)    in 1 sec: 13.2877 ( -0.7359  0.7371 ) ph/cm2/s
Energy fluence (15-150 keV)             : 1.16003e-06 ( -6.74833e-08  6.7381e-08 ) ergs/cm2
Band function

Time interval is from    2.124 sec. to    3.124 sec.


Spectral model in the Band function:
------------------------------------------------------------
Parameters  : value       lower 90%   higher 90%
alpha       :    (     )
beta        :     (     )
Epeak [keV] :       (   )
Norm@50keV   :     (     )
------------------------------------------------------------

Photon flux (15-150 keV)    in  sec:  (    ) ph/cm2/s
Energy fluence (15-150 keV)             : 0 ( 0  0 ) ergs/cm2
Single BB
Spectral model blackbody:
------------------------------------------------------------
Parameters  : value    Lower 90%  Upper 90%
kT [keV]    : 20.3658  (-1.22213  1.31198)
R^2/D10^2   : 0.621052  (-0.115367   0.139762)
(R is the radius in km and D10 is the distance to the source in units of 10 kpc)
------------------------------------------------------------
#Fit statistic  : Chi-Squared                  104.45     using 59 bins.
 Reduced chi-squared =
# Null hypothesis probability of 1.29e-04 with 57 degrees of freedom

Energy  Fluence     90% Error
[keV]   [erg/cm2]   [erg/cm2]
15- 25  4.929e-08   4.815e-09
25- 50  2.485e-07   1.815e-08
50-150  7.658e-07   6.275e-08
15-150  1.064e-06   7.010e-08
Thermal bremsstrahlung (OTTB)
Spectral model: thermal bremsstrahlung
------------------------------------------------------------
Parameters  : value         Lower 90%    Upper 90%
kT [keV]    : 199.362       (      )
Norm        : 56.2766       (     )
------------------------------------------------------------
#Fit statistic  : Chi-Squared                  115.30     using 59 bins.
 Reduced chi-squared =
# Null hypothesis probability of 7.88e-06 with 57 degrees of freedom

Energy  Fluence     90% Error
[keV]   [erg/cm2]   [erg/cm2]
15- 25  1.401e-07   8.250e-09
25- 50  2.696e-07   1.630e-08
50-150  5.912e-07   4.030e-08
15-150  1.001e-06   6.095e-08
Double BB
Spectral model: bbodyrad<1> + bbodyrad<2>
------------------------------------------------------------
Parameters  : value         Lower 90%    Upper 90%
kT1 [keV]   : 6.15472        (-1.52466      2.02668)
R1^2/D10^2  : 13.6299        (-8.39284      27.8503)
kT2 [keV]   : 25.5138        (-2.48166      3.5544)
R2^2/D10^2  : 0.263084    (-0.10104   0.117693)
------------------------------------------------------------
#Fit statistic  : Chi-Squared                   55.38     using 59 bins.
 Reduced chi-squared =
# Null hypothesis probability of 4.60e-01 with 55 degrees of freedom

Energy  Fluence     90% Error
[keV]   [erg/cm2]   [erg/cm2]
15- 25  1.005e-07   3.901e-08
25- 50  2.436e-07   4.340e-08
50-150  8.192e-07   9.460e-08
15-150  1.163e-06   1.560e-07
Pre-slew spectrum (Pre-slew PHA with pre-slew DRM)
Power-law model

Spectral model in power-law:
------------------------------------------------------------
Parameters  : value       lower 90%   higher 90%
Photon index: 1.38757     ( -0.0638512   0.0638111 )
Norm@50keV  : 3.94060E-02    ( -0.00146619   0.00146617 )
------------------------------------------------------------
#Fit statistic  : Chi-Squared                   68.05     using 59 bins.
 Reduced chi-squared =
# Null hypothesis probability of 1.50e-01 with 57 degrees of freedom

Photon flux (15-150 keV)    in 8.832 sec: 4.78555 ( -0.191364  0.191757 ) ph/cm2/s
Energy fluence (15-150 keV)             : 3.3716e-06 ( -1.32465e-07  1.32616e-07 ) ergs/cm2
Cutoff power-law model
Spectral model in the cutoff power-law:
------------------------------------------------------------
Parameters  : value       lower 90%   higher 90%
Photon index: 0.844099     ( -0.28573   0.268852 )
Epeak [keV] : 119.833      ( -23.0674 60.4021 )
Norm@50keV  : 6.95510E-02    ( -0.016626   0.0233043 )
------------------------------------------------------------
#Fit statistic  : Chi-Squared                   55.46     using 59 bins.
 Reduced chi-squared =
# Null hypothesis probability of 4.95e-01 with 56 degrees of freedom

Photon flux (15-150 keV)    in 8.832 sec: 4.65497 ( -0.20041  0.20109 ) ph/cm2/s
Energy fluence (15-150 keV)             : 3.30012e-06 ( -1.39351e-07  1.38945e-07 ) ergs/cm2
Band function

Spectral model in the Band function:
------------------------------------------------------------
Parameters  : value       lower 90%   higher 90%
alpha       :    (     )
beta        :     (     )
Epeak [keV] :       (   )
Norm@50keV   :     (     )
------------------------------------------------------------

Photon flux (15-150 keV)    in  sec:  (    ) ph/cm2/s
Energy fluence (15-150 keV)             : 0 ( 0  0 ) ergs/cm2
S(25-50 keV) vs. S(50-100 keV) plot
S(25-50 keV)  = 7.87e-07
S(50-100 keV) = 1.20e-06
T90 vs. Hardness ratio plot

T90                                   = 6.18799984455109 sec.
Hardness ratio (energy fluence ratio) = 1.52478
Color vs. Color plot
Count Ratio  (25-50 keV) / (15-25 keV) = 1.63174
Count Ratio (50-100 keV) / (15-25 keV) = 1.62449
Mask shadow pattern
IMX = -8.381999683979031E-01, IMY = 5.416433501750929E-01
TIME vs. PHA plot around the trigger time
Blue+Cyan dotted lines: Time interval of the scaled map
From 0.000000 to 0.512000
TIME vs. DetID plot around the trigger time

Blue+Cyan dotted lines: Time interval of the scaled map
From 0.000000 to 0.512000
100 us light curve (15-350 keV)
Blue+Cyan dotted lines: Time interval of the scaled map
From 0.000000 to 0.512000
Spacecraft aspect plot
Bright source in the pre-burst/pre-slew/post-slew images
Pre-burst image of 15-350 keV band
Time interval of the image:
-239.488000 -0.040000

# RAcent  DECcent POSerr Theta    Phi  PeakCts   SNR AngSep     Name
#  [deg]    [deg]    ['] [deg]  [deg]                   [']
 83.6239  22.0024    0.7  49.9 -175.0  10.7087  16.4    0.9	Crab
192.6539  50.8667    3.0  35.3   20.4   1.6421   3.9 ------	UNKNOWN
 93.0293  14.6840    2.7  52.8  170.7   4.1535   4.3 ------	UNKNOWN
155.5468  56.5209    2.5  13.9   38.1   1.2862   4.7 ------	UNKNOWN
186.1576  61.2547    2.7  26.7    6.9   1.4070   4.3 ------	UNKNOWN
 67.1384  22.1140    3.8  57.5 -158.5   4.3596   3.1 ------	UNKNOWN
287.2655  68.5162    2.7  50.2  -45.5   5.7632   4.2 ------	UNKNOWN
Pre-slew background subtracted image of 15-350 keV band
Time interval of the image:
-0.040000 8.792000

# RAcent  DECcent POSerr Theta    Phi  PeakCts   SNR AngSep     Name
#  [deg]    [deg]    ['] [deg]  [deg]                   [']
 83.7346  22.1361    6.6  49.8 -175.0  -0.2649  -1.8    9.2	Crab
190.1388  33.5312    2.3  46.8   40.6   0.7832   5.1 ------	UNKNOWN
 97.4551  10.5058    2.5  55.2  163.9   1.3377   4.6 ------	UNKNOWN
 67.0815  37.4296    0.3  44.9 -147.1   4.9929  35.6 ------	UNKNOWN
 16.6771  85.9648    2.7  31.6  -63.2   0.4122   4.3 ------	UNKNOWN
 54.9549  55.3299    2.6  38.1 -119.0   0.5548   4.5 ------	UNKNOWN
Post-slew image of 15-350 keV band
Time interval of the image:
73.612590 710.792000
720.512000 962.529900

# RAcent  DECcent POSerr Theta    Phi  PeakCts   SNR AngSep     Name
#  [deg]    [deg]    ['] [deg]  [deg]                   [']
 83.6433  22.0146    0.3  21.0  143.8  37.1452  34.1    0.6	Crab
174.9477  85.2399    4.5  54.2   16.8  12.7856   2.6 ------	UNKNOWN
 64.1729  76.7099    3.4  39.3   10.1   4.8804   3.4 ------	UNKNOWN
Plot creation:
Sat Jul 30 07:10:28 EDT 2022