Estimated redshift from machine learning (Ukwatta et al. 2016) - may take a few minute to calcaulte
Image
Pre-slew 15.0-350.0 keV image (Event data)

#   RAcent    DECcent   POSerr    Theta     Phi              Peak Cts       SNR   Name
  269.7410    45.3589   0.0041    31.7336   156.0012         3.6141380     46.789 TRIG_01042113

Foreground time interval of the image:
 -0.004   8.605 (delta_t =   8.609 [sec])
Background time interval of the image:
-160.195  -0.004 (delta_t = 160.191 [sec])
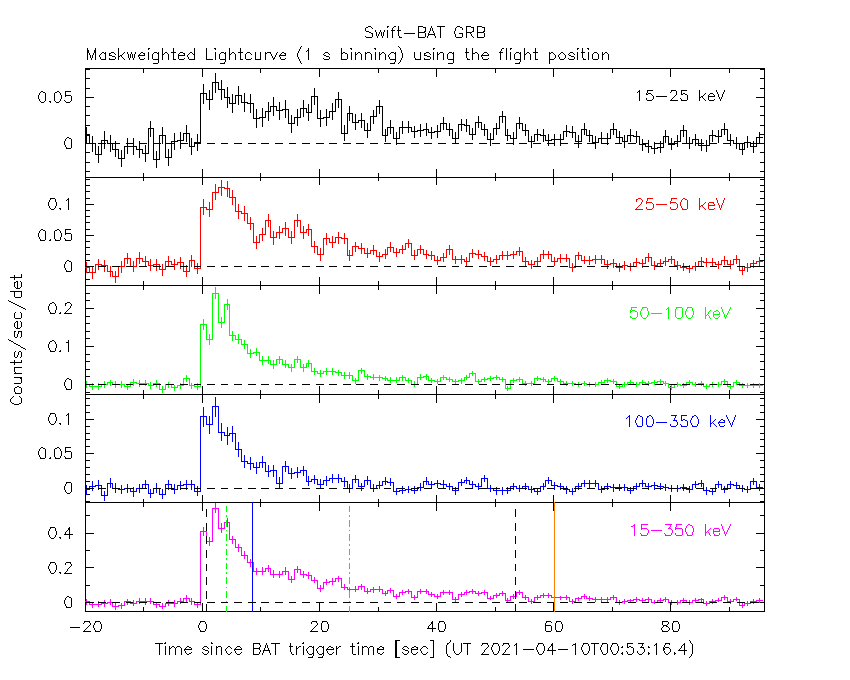
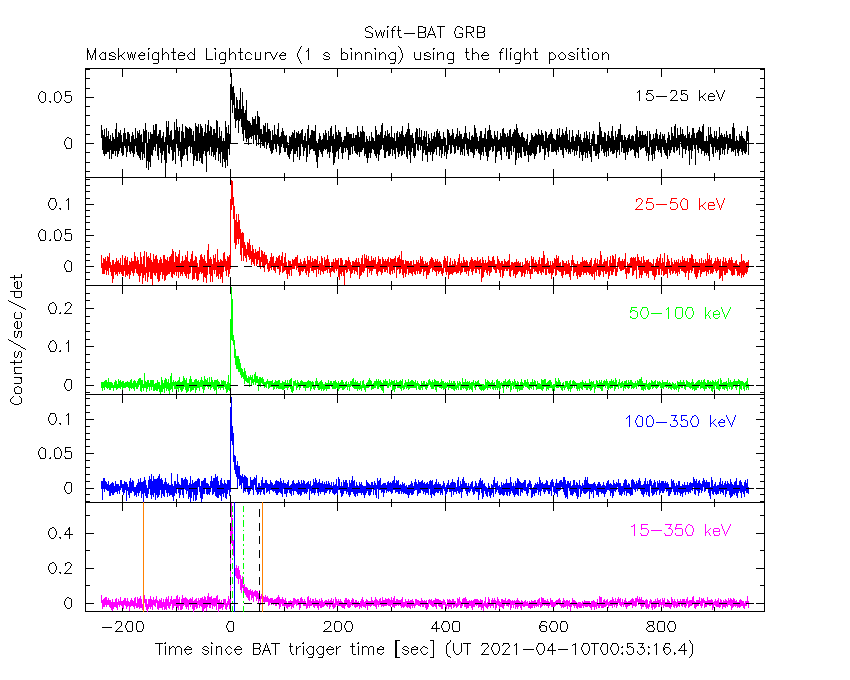
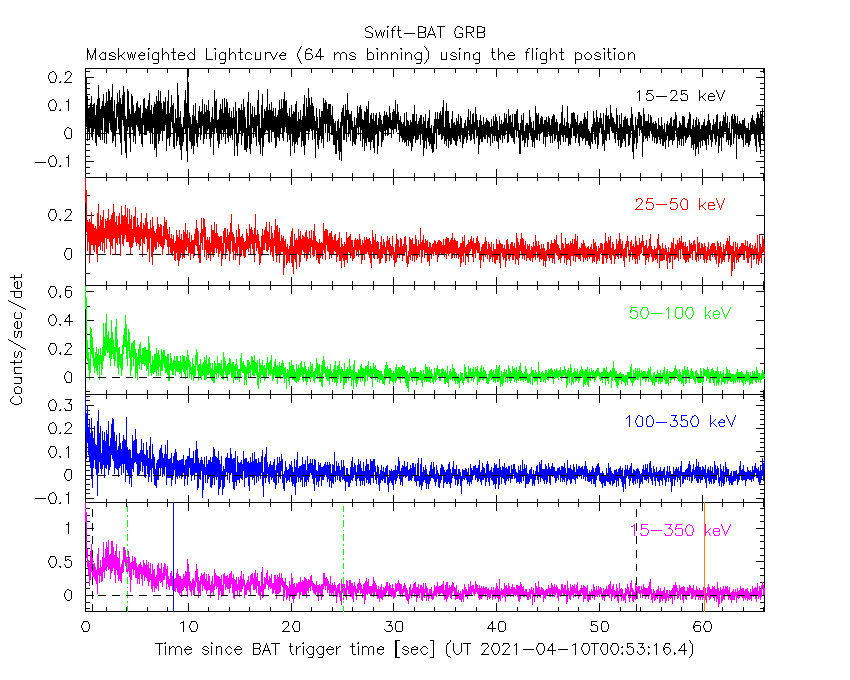
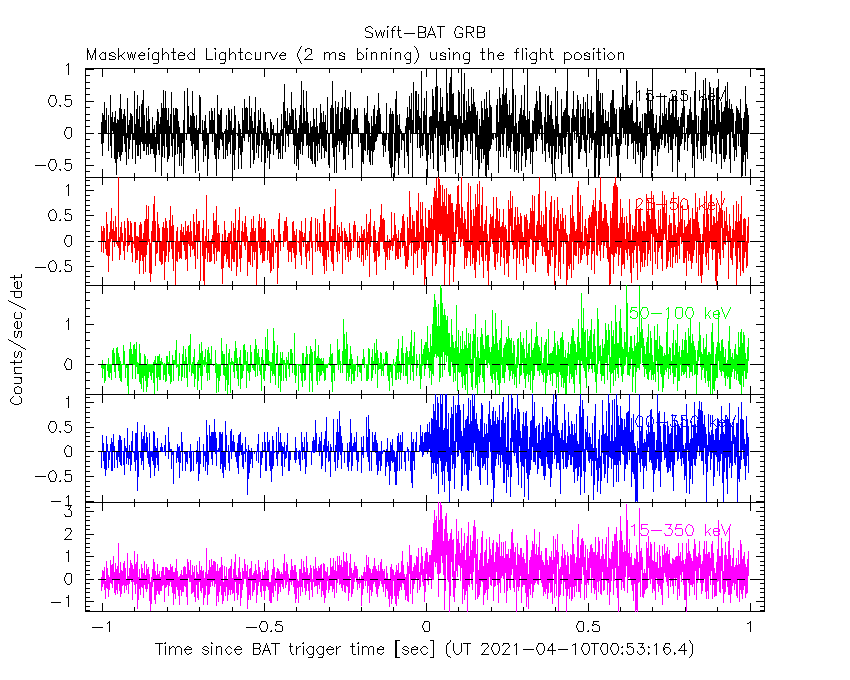
Lightcurves
Notes:
- 1) The mask-weighted light curves are using the flight position.
- 2) Multiple plots of different time binning/intervals are shown to cover all scenarios of short/long GRBs, rate/image triggers, and real/false positives.
- 3) For all the mask-weighted lightcurves, the y-axis units are counts/sec/det where a det is 0.4 x 0.4 = 0.16 sq cm.
- 4) The verticle lines correspond to following: green dotted lines are T50 interval, black dotted lines are T90 interval, blue solid line(s) is a spacecraft slew start time, and orange solid line(s) is a spacecraft slew end time.
- 5) Time of each bin is in the middle of the bin.
1 s binning
From T0-310 s to T0+310 s

From T100_start - 20 s to T100_end + 30 s
Full time interval
64 ms binning
Full time interval

From T100_start to T100_end
From T0-5 sec to T0+5 sec

16 ms binning
From T100_start-5 s to T100_start+5 s

8 ms binning
From T100_start-3 s to T100_start+3 s

2 ms binning
From T100_start-1 s to T100_start+1 s
SN=5 or 10 sec. binning (whichever binning is satisfied first)

SN=5 or 10 sec. binning (T < 200 sec)

Quad-rate summed light curves (from T0-300s to T0+1000s)

Spectral Evolution

Spectra
Notes:
- 1) The fitting includes the systematic errors.
- 2) When the burst includes telescope slew time periods, the fitting uses an average response file made from multiple 5-s response files through out the slew time plus single time preiod for the non-slew times, and weighted by the total counts in the corresponding time period using addrmf. An average response file is needed becuase a spectral fit using the pre-slew DRM will introduce some errors in both a spectral shape and a normalization if the PHA file contains a lot of the slew/post-slew time interval.
- 3) For fits to more complicated models (e.g. a power-law over a cutoff power-law), the BAT team has decided to require a chi-square improvement of more than 6 for each extra dof.
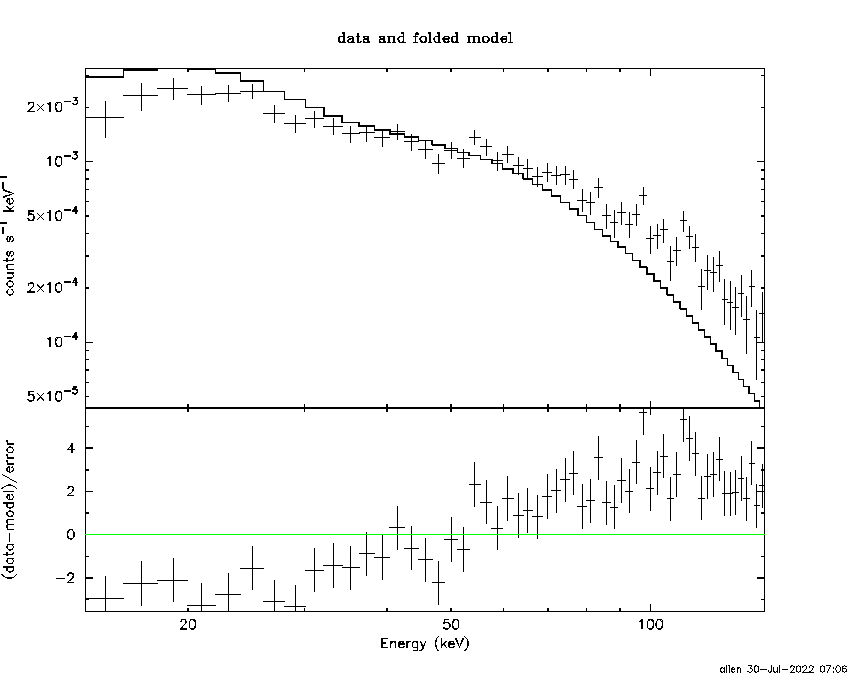
Time averaged spectrum fit using the average DRM
Power-law model

Time interval is from   -0.004 sec. to   66.064 sec.

Spectral model in power-law:
------------------------------------------------------------
Parameters  : value       lower 90%   higher 90%
Photon index: 1.02156     ( -0.0566251   0.0560931 )
Norm@50keV  : 7.78814E-03    ( -0.000229702   0.000228897 )
------------------------------------------------------------
#Fit statistic  : Chi-Squared                   64.08     using 59 bins.
 Reduced chi-squared = 1.12421
# Null hypothesis probability of 2.42e-01 with 57 degrees of freedom

Photon flux (15-150 keV)    in 66.07 sec: 0.897754 ( -0.027529  0.027667 ) ph/cm2/s
Energy fluence (15-150 keV)             : 5.52286e-06 ( -1.63734e-07  1.63888e-07 ) ergs/cm2
Cutoff power-law model

Time interval is from   -0.004 sec. to   66.064 sec.
Spectral model in the cutoff power-law:
------------------------------------------------------------
Parameters  : value       lower 90%   higher 90%
Photon index: 1.01581     ( -0.0623647   0.0518268 )
Epeak [keV] : 1.00000E+04      ( -10000 -10000 )
Norm@50keV  : 7.83296E-03    ( -0.000230181   0.000218434 )
------------------------------------------------------------
#Fit statistic  : Chi-Squared                   64.42     using 59 bins.
 Reduced chi-squared = 1.15036
# Null hypothesis probability of 2.06e-01 with 56 degrees of freedom

Photon flux (15-150 keV)    in 66.07 sec: 0.897421 ( -0.027565  0.02763 ) ph/cm2/s
Energy fluence (15-150 keV)             : 5.5495e-06 ( -1.92347e-07  1.35023e-07 ) ergs/cm2
Band function

Time interval is from   -0.004 sec. to   66.064 sec.


Spectral model in the Band function:
------------------------------------------------------------
Parameters  : value       lower 90%   higher 90%
alpha       :    (     )
beta        :     (     )
Epeak [keV] :       (   )
Norm@50keV   :     (     )
------------------------------------------------------------

Photon flux (15-150 keV)    in  sec:  (    ) ph/cm2/s
Energy fluence (15-150 keV)             : 0 ( 0  0 ) ergs/cm2
Single BB

Spectral model blackbody:
------------------------------------------------------------
Parameters  : value    Lower 90%  Upper 90%
kT [keV]    : 24.3794  (  )
R^2/D10^2   : 2.23176E-02  (   )
(R is the radius in km and D10 is the distance to the source in units of 10 kpc)
------------------------------------------------------------
#Fit statistic  : Chi-Squared                  359.55     using 59 bins.
 Reduced chi-squared =
# Null hypothesis probability of 1.75e-45 with 57 degrees of freedom

Energy  Fluence     90% Error
[keV]   [erg/cm2]   [erg/cm2]
15- 25  1.543e-07   9.514e-09
25- 50  8.639e-07   3.898e-08
50-150  3.819e-06   1.619e-07
15-150  4.837e-06   1.473e-07
Thermal bremsstrahlung (OTTB)
Spectral model: thermal bremsstrahlung
------------------------------------------------------------
Parameters  : value         Lower 90%    Upper 90%
kT [keV]    : 199.363       (      )
Norm        : 3.85543       (     )
------------------------------------------------------------
#Fit statistic  : Chi-Squared                  351.22     using 59 bins.
 Reduced chi-squared =
# Null hypothesis probability of 5.94e-44 with 57 degrees of freedom

Energy  Fluence     90% Error
[keV]   [erg/cm2]   [erg/cm2]
15- 25  6.343e-07   2.078e-08
25- 50  1.220e-06   3.634e-08
50-150  2.676e-06   7.961e-08
15-150  4.530e-06   1.434e-07
Double BB
Spectral model: bbodyrad<1> + bbodyrad<2>
------------------------------------------------------------
Parameters  : value         Lower 90%    Upper 90%
kT1 [keV]   : 8.61806        (-0.913887      1.01045)
R1^2/D10^2  : 0.389420        (-0.116677      0.178203)
kT2 [keV]   : 46.0719        (-5.89636      8.84251)
R2^2/D10^2  : 3.05362E-03    (-0.00111545   0.00141176)
------------------------------------------------------------
#Fit statistic  : Chi-Squared                   57.88     using 59 bins.
 Reduced chi-squared =
# Null hypothesis probability of 3.69e-01 with 55 degrees of freedom

Energy  Fluence     90% Error
[keV]   [erg/cm2]   [erg/cm2]
15- 25  4.130e-07   4.219e-08
25- 50  1.073e-06   7.466e-08
50-150  4.207e-06   3.452e-07
15-150  5.693e-06   4.080e-07
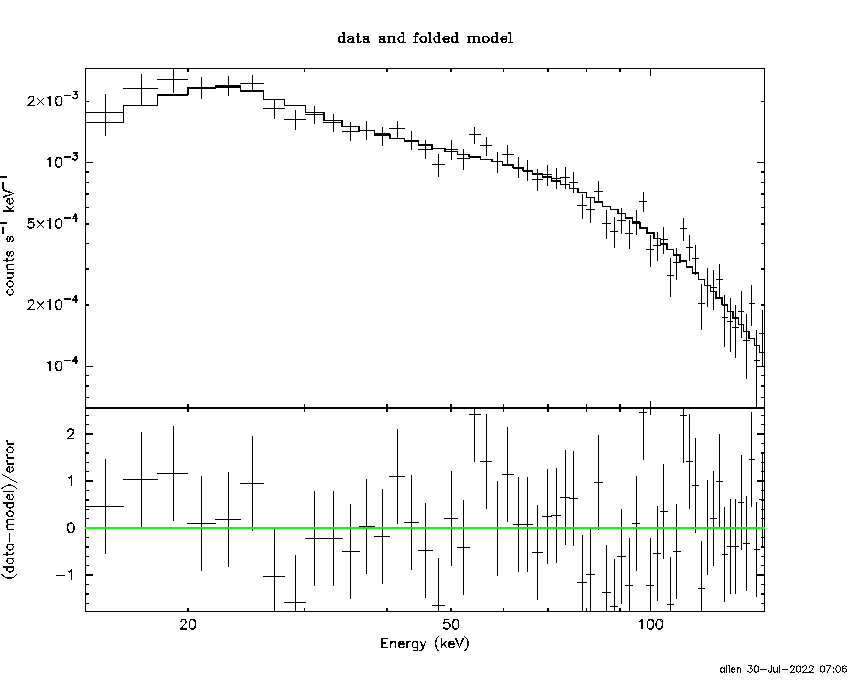
Peak spectrum fit
Power-law model

Time interval is from    1.736 sec. to    2.736 sec.

Spectral model in power-law:
------------------------------------------------------------
Parameters  : value       lower 90%   higher 90%
Photon index: 0.471297     ( -0.159473   0.152676 )
Norm@50keV  : 3.34853E-02    ( -0.00306073   0.00299067 )
------------------------------------------------------------
#Fit statistic  : Chi-Squared                   50.85     using 59 bins.
 Reduced chi-squared = 0.892105
# Null hypothesis probability of 7.04e-01 with 57 degrees of freedom

Photon flux (15-150 keV)    in 1 sec: 0.380174 ( -0.148779  0.235892 ) ph/cm2/s
Energy fluence (15-150 keV)             : 4.56562e-07 ( -3.7508e-08  3.76349e-08 ) ergs/cm2
Cutoff power-law model

Time interval is from    1.736 sec. to    2.736 sec.
Spectral model in the cutoff power-law:
------------------------------------------------------------
Parameters  : value       lower 90%   higher 90%
Photon index: 0.461528     ( -0.161847   0.153514 )
Epeak [keV] : 9999.36      ( -9999.36 -9999.36 )
Norm@50keV  : 3.37885E-02    ( -0.0028698   0.0169081 )
------------------------------------------------------------
#Fit statistic  : Chi-Squared                   50.88     using 59 bins.
 Reduced chi-squared = 0.908571
# Null hypothesis probability of 6.69e-01 with 56 degrees of freedom

Photon flux (15-150 keV)    in 1 sec: 3.99308 (    ) ph/cm2/s
Energy fluence (15-150 keV)             : 4.56825e-07 ( -4.13834e-08  4.08319e-08 ) ergs/cm2
Band function

Time interval is from    1.736 sec. to    2.736 sec.


Spectral model in the Band function:
------------------------------------------------------------
Parameters  : value       lower 90%   higher 90%
alpha       :    (     )
beta        :     (     )
Epeak [keV] :       (   )
Norm@50keV   :     (     )
------------------------------------------------------------

Photon flux (15-150 keV)    in  sec:  (    ) ph/cm2/s
Energy fluence (15-150 keV)             : 0 ( 0  0 ) ergs/cm2
Single BB

Spectral model blackbody:
------------------------------------------------------------
Parameters  : value    Lower 90%  Upper 90%
kT [keV]    : 35.4868  (-4.46669  5.77615)
R^2/D10^2   : 4.09424E-02  (-0.0129768   0.0174503)
(R is the radius in km and D10 is the distance to the source in units of 10 kpc)
------------------------------------------------------------
#Fit statistic  : Chi-Squared                   66.82     using 59 bins.
 Reduced chi-squared =
# Null hypothesis probability of 1.75e-01 with 57 degrees of freedom

Energy  Fluence     90% Error
[keV]   [erg/cm2]   [erg/cm2]
15- 25  7.234e-09   1.214e-09
25- 50  4.751e-08   6.665e-09
50-150  3.884e-07   4.855e-08
15-150  4.431e-07   4.715e-08
Thermal bremsstrahlung (OTTB)

Spectral model: thermal bremsstrahlung
------------------------------------------------------------
Parameters  : value         Lower 90%    Upper 90%
kT [keV]    : 199.361       (      )
Norm        : 14.3319       (     )
------------------------------------------------------------
#Fit statistic  : Chi-Squared                  183.08     using 59 bins.
 Reduced chi-squared =
# Null hypothesis probability of 3.82e-15 with 57 degrees of freedom

Energy  Fluence     90% Error
[keV]   [erg/cm2]   [erg/cm2]
15- 25  3.569e-08   1.316e-08
25- 50  6.865e-08   3.732e-08
50-150  1.506e-07   7.255e-08
15-150  2.549e-07   1.176e-07
Double BB

Spectral model: bbodyrad<1> + bbodyrad<2>
------------------------------------------------------------
Parameters  : value         Lower 90%    Upper 90%
kT1 [keV]   : 5.69720        (-1.88933      3.1394)
R1^2/D10^2  : 3.90481        (-3.11811      17.9361)
kT2 [keV]   : 43.8376        (-7.49102      12.9119)
R2^2/D10^2  : 2.28857E-02    (-0.0106194   0.0141399)
------------------------------------------------------------
#Fit statistic  : Chi-Squared                   47.54     using 59 bins.
 Reduced chi-squared =
# Null hypothesis probability of 7.52e-01 with 55 degrees of freedom

Energy  Fluence     90% Error
[keV]   [erg/cm2]   [erg/cm2]
15- 25  2.088e-08   1.001e-08
25- 50  5.098e-08   1.300e-08
50-150  3.964e-07   8.165e-08
15-150  4.683e-07   9.030e-08
Pre-slew spectrum (Pre-slew PHA with pre-slew DRM)
Power-law model

Spectral model in power-law:
------------------------------------------------------------
Parameters  : value       lower 90%   higher 90%
Photon index: 0.625169     ( -0.0685193   0.0672336 )
Norm@50keV  : 2.49437E-02    ( -0.000968729   0.000960224 )
------------------------------------------------------------
#Fit statistic  : Chi-Squared                   44.13     using 59 bins.
 Reduced chi-squared =
# Null hypothesis probability of 8.94e-01 with 57 degrees of freedom

Photon flux (15-150 keV)    in 8.609 sec: 2.90382 ( -0.103257  0.103505 ) ph/cm2/s
Energy fluence (15-150 keV)             : 2.71338e-06 ( -9.82838e-08  9.8499e-08 ) ergs/cm2
Cutoff power-law model

Spectral model in the cutoff power-law:
------------------------------------------------------------
Parameters  : value       lower 90%   higher 90%
Photon index: 2.64130     ( -0.529964   -2.6413 )
Epeak [keV] : 141.628      (   )
Norm@50keV  : 5.62464E-07    (     )
------------------------------------------------------------
#Fit statistic  : Chi-Squared                   70.48     using 59 bins.
 Reduced chi-squared =
# Null hypothesis probability of 9.22e-02 with 56 degrees of freedom

Photon flux (15-150 keV)    in 8.609 sec: 2.90482 ( -0.10534  0.10169 ) ph/cm2/s
Energy fluence (15-150 keV)             : 2.71079e-06 ( -9.53533e-08  1.00407e-07 ) ergs/cm2
Band function

Spectral model in the Band function:
------------------------------------------------------------
Parameters  : value       lower 90%   higher 90%
alpha       :    (     )
beta        :     (     )
Epeak [keV] :       (   )
Norm@50keV   :     (     )
------------------------------------------------------------

Photon flux (15-150 keV)    in  sec:  (    ) ph/cm2/s
Energy fluence (15-150 keV)             : 0 ( 0  0 ) ergs/cm2
S(25-50 keV) vs. S(50-100 keV) plot

S(25-50 keV)  = 1.04e-06
S(50-100 keV) = 2.04e-06
T90 vs. Hardness ratio plot

T90                                   = 52.8759999275208 sec.
Hardness ratio (energy fluence ratio) = 1.96154
Color vs. Color plot

Count Ratio  (25-50 keV) / (15-25 keV) = 1.53225
Count Ratio (50-100 keV) / (15-25 keV) = 1.64248
Mask shadow pattern

IMX = -5.649636120925426E-01, IMY = -2.515239810748552E-01
TIME vs. PHA plot around the trigger time

TIME vs. DetID plot around the trigger time

100 us light curve (15-350 keV)

Spacecraft aspect plot

Bright source in the pre-burst/pre-slew/post-slew images
Pre-burst image of 15-350 keV band
Time interval of the image:
-160.195410 -0.004000

# RAcent  DECcent POSerr Theta    Phi  PeakCts   SNR AngSep     Name
#  [deg]    [deg]    ['] [deg]  [deg]                   [']
254.5673  35.2405    4.7  36.5  129.9   0.9504   2.4    8.1	Her X-1
268.5243  -1.4829   49.8  31.3   56.9   0.0694   0.2    9.5	SW J1753.5-0127
270.4677 -25.2244    7.3  49.5   32.6   1.1196   1.6   13.2	GX 5-1
270.3737 -25.7279    2.9  50.0   32.4   2.9378   3.9    4.0	GRS 1758-258
274.0259 -14.0806    6.0  38.1   35.8   0.6750   1.9    2.9	GX 17+2
276.0566 -30.3836   19.5  52.3   24.1  -0.5268  -0.6    6.9	H1820-303
285.1664 -24.9484    4.6  45.0   15.5   0.9386   2.5    7.3	HT1900.1-2455
288.6277  11.0753    0.0   9.1   28.6  -0.0376  -0.2   12.7	GRS 1915+105
299.5732  35.1894    1.1  17.0 -152.1   1.8927  10.6    1.1	Cyg X-1
308.2101  41.0925    7.1  25.5 -144.4   0.3264   1.6    9.5	Cyg X-3
326.3023  38.3810    6.0  35.0 -123.3   0.5606   1.9    7.1	Cyg X-2
252.6820   9.4562    1.8  39.4   87.5   4.1862   6.3 ------	UNKNOWN
332.2637  -3.9520    2.7  45.9  -57.0   3.8127   4.3 ------	UNKNOWN
Pre-slew background subtracted image of 15-350 keV band
Time interval of the image:
-0.004000 8.604600

# RAcent  DECcent POSerr Theta    Phi  PeakCts   SNR AngSep     Name
#  [deg]    [deg]    ['] [deg]  [deg]                   [']
254.4894  35.5135    7.0  36.7  130.3   0.2153   1.6   10.4	Her X-1
268.3731  -1.4535  220.8  31.4   57.2  -0.0053  -0.1    0.3	SW J1753.5-0127
270.1533 -25.0870   12.9  49.5   33.0  -0.1958  -0.9    7.1	GX 5-1
270.1699 -25.7024    6.6  50.0   32.6  -0.4180  -1.7    7.6	GRS 1758-258
273.8361 -13.9150    8.0  38.0   36.2   0.1618   1.4   12.3	GX 17+2
275.7753 -30.2998   11.6  52.3   24.4   0.2739   1.0    8.7	H1820-303
285.1187 -24.9359    4.9  45.0   15.5  -0.2506  -2.4    4.6	HT1900.1-2455
288.8972  10.9454    6.0   9.2   26.8   0.1046   1.9    5.8	GRS 1915+105
299.5531  35.2625    5.3  17.0 -152.3  -0.1125  -2.2    4.1	Cyg X-1
307.9273  40.8305    5.5  25.2 -144.5  -0.1192  -2.1   11.1	Cyg X-3
326.1784  38.3224   22.5  34.9 -123.3   0.0439   0.5    0.3	Cyg X-2
242.3483  63.9234    3.0  55.4  162.5   1.2723   3.9 ------	UNKNOWN
269.7413  45.3593    0.2  31.7  156.0   3.6201  46.9 ------	UNKNOWN
264.6463  71.1700    2.5  54.1  176.0   0.8954   4.7 ------	UNKNOWN
304.3629 -23.8250    2.7  45.0   -9.4   0.3939   4.3 ------	UNKNOWN
315.3496 -21.3358    3.1  46.8  -23.7   0.4003   3.6 ------	UNKNOWN
331.0162 -11.1977    2.4  49.1  -48.0   1.1830   4.8 ------	UNKNOWN
Post-slew image of 15-350 keV band
Time interval of the image:
60.204600 718.080700
720.704000 962.835700

# RAcent  DECcent POSerr Theta    Phi  PeakCts   SNR AngSep     Name
#  [deg]    [deg]    ['] [deg]  [deg]                   [']
254.4854  35.3788    2.9  15.3   74.1   3.1870   3.9    2.6	Her X-1
268.3192  -1.5823   22.3  47.0   21.5   0.9028   0.5    8.3	SW J1753.5-0127
288.9090  11.0436   16.0  38.0  -12.0   0.6316   0.7    8.8	GRS 1915+105
299.5971  35.2162    1.3  24.7  -56.8   8.2261   9.1    0.9	Cyg X-1
308.1641  40.9529    8.1  28.1  -75.3   1.3841   1.4    2.4	Cyg X-3
258.8706  49.3118    3.8   8.4  141.6   1.8466   3.0 ------	UNKNOWN
356.7314  67.2051    2.8  47.9 -129.1  11.6297   4.1 ------	UNKNOWN
Plot creation:
Sat Jul 30 07:07:06 EDT 2022