Special notes of this burst
Image
Pre-slew 15.0-350.0 keV image (Event data)
#   RAcent    DECcent   POSerr    Theta     Phi              Peak Cts       SNR   Name
  290.5854   -38.7304   0.0198    25.6970   -75.4924         0.0558499      9.688 TRIG_00104298

Foreground time interval of the image:
  0.004   0.132 (delta_t =   0.128 [sec])
Background time interval of the image:
-299.176   0.004 (delta_t = 299.180 [sec])
Lightcurves
Notes:
- 1) The mask-weighted light curves are using the flight position.
- 2) Multiple plots of different time binning/intervals are shown to cover all scenarios of short/long GRBs, rate/image triggers, and real/false positives.
- 3) For all the mask-weighted lightcurves, the y-axis units are counts/sec/det where a det is 0.4 x 0.4 = 0.16 sq cm.
- 4) The verticle lines correspond to following: green dotted lines are T50 interval, black dotted lines are T90 interval, blue solid line(s) is a spacecraft slew start time, and orange solid line(s) is a spacecraft slew end time.
- 5) Time of each bin is in the middle of the bin.
1 s binning
From T0-310 s to T0+310 s
From T100_start - 20 s to T100_end + 30 s
Full time interval

64 ms binning
Full time interval
From T100_start to T100_end
From T0-5 sec to T0+5 sec
16 ms binning
From T100_start-5 s to T100_start+5 s
8 ms binning
From T100_start-3 s to T100_start+3 s
2 ms binning
From T100_start-1 s to T100_start+1 s
SN=5 or 10 sec. binning (whichever binning is satisfied first)
SN=5 or 10 sec. binning (T < 200 sec)
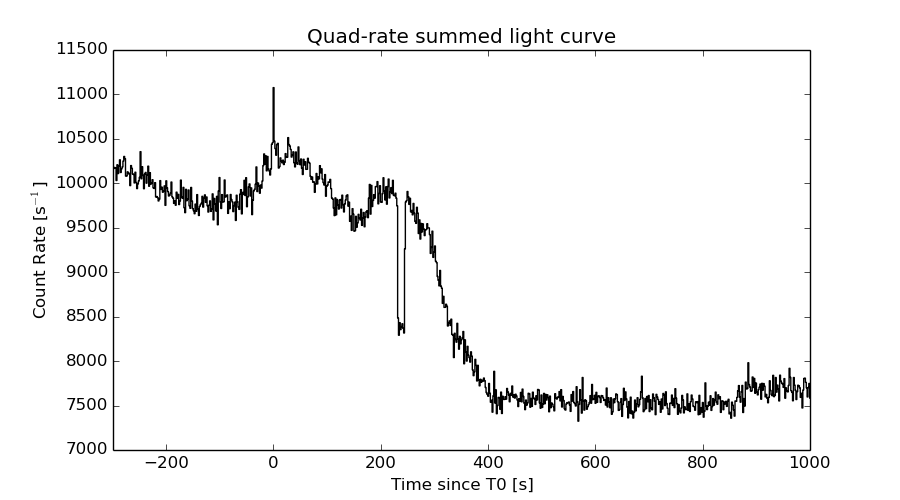
Quad-rate summed light curves (from T0-300s to T0+1000s)
Spectral Evolution

Spectra
Notes:
- 1) The fitting includes the systematic errors.
- 2) When the burst includes telescope slew time periods, the fitting uses an average response file made from multiple 5-s response files through out the slew time plus single time preiod for the non-slew times, and weighted by the total counts in the corresponding time period using addrmf. An average response file is needed becuase a spectral fit using the pre-slew DRM will introduce some errors in both a spectral shape and a normalization if the PHA file contains a lot of the slew/post-slew time interval.
- 3) For fits to more complicated models (e.g. a power-law over a cutoff power-law), the BAT team has decided to require a chi-square improvement of more than 6 for each extra dof.
Time averaged spectrum fit using the average DRM
Power-law model
Time interval is from    0.004 sec. to    0.132 sec.

Spectral model in power-law:
------------------------------------------------------------
Parameters  : value       lower 90%   higher 90%
Photon index: 1.37638     ( -0.294023   0.290449 )
Norm@50keV  : 2.50761E-02    ( -0.00436356   0.00436279 )
------------------------------------------------------------
#Fit statistic : Chi-Squared =          41.96 using 59 PHA bins.
# Reduced chi-squared =         0.7362 for     57 degrees of freedom
# Null hypothesis probability =   9.320917e-01

Photon flux (15-150 keV)    in 0.128 sec: 3.03782 ( -0.555579  0.55909 ) ph/cm2/s
Energy fluence (15-150 keV)             : 3.11685e-08 ( -5.76517e-09  5.80954e-09 ) ergs/cm2
Cutoff power-law model
Time interval is from    0.004 sec. to    0.132 sec.
Spectral model in the cutoff power-law:
------------------------------------------------------------
Parameters  : value       lower 90%   higher 90%
Photon index: 0.318881     ( -1.91476   1.18019 )
Epeak [keV] : 84.2545      ( -23.3292 -84.2547 )
Norm@50keV  : 8.03981E-02    ( -0.0803974   0.541364 )
------------------------------------------------------------
#Fit statistic : Chi-Squared =          40.30 using 59 PHA bins.
# Reduced chi-squared =         0.7196 for     56 degrees of freedom
# Null hypothesis probability =   9.436140e-01

Photon flux (15-150 keV)    in 0.128 sec: 2.90784 ( -0.5843  0.58571 ) ph/cm2/s
Energy fluence (15-150 keV)             : 2.94806e-08 ( -6.28826e-09  6.2999e-09 ) ergs/cm2
Band function
Time interval is from    0.004 sec. to    0.132 sec.

Spectral model in the Band function:
------------------------------------------------------------
Parameters  : value       lower 90%   higher 90%
alpha       : 0.241531   ( 0.147199   0.147199 )
beta        : -1.92122    ( 2.09079   0.863947 )
Epeak [keV] : 65.5005      ( -65.3172 208.512 )
Norm@50keV   : 0.168288    ( -0.176799   101.758 )
------------------------------------------------------------
#Fit statistic : Chi-Squared =          39.98 using 59 PHA bins.
# Reduced chi-squared =         0.7268 for     55 degrees of freedom
# Null hypothesis probability =   9.361760e-01

Photon flux (15-150 keV)    in 0.128 sec:  (    ) ph/cm2/s
Energy fluence (15-150 keV)             : 2.9707e-08 ( 0  0 ) ergs/cm2
Single BB
Spectral model blackbody:
------------------------------------------------------------
Parameters  : value    Lower 90%  Upper 90%
kT [keV]    : 16.6370  (-2.90004  3.76801)
R^2/D10^2   : 0.258047  (-0.133073   0.248579)
(R is the radius in km and D10 is the distance to the source in units of 10 kpc)
------------------------------------------------------------
#Fit statistic : Chi-Squared =          42.80 using 59 PHA bins.
# Reduced chi-squared =         0.7510 for     57 degrees of freedom
# Null hypothesis probability =   9.185644e-01

Energy  Fluence     90% Error
[keV]   [erg/cm2]   [erg/cm2]
15- 25  1.873e-09   6.605e-10
25- 50  8.142e-09   2.433e-09
50-150  1.598e-08   5.479e-09
15-150  2.599e-08   7.066e-09
Thermal bremsstrahlung (OTTB)
Spectral model: thermal bremsstrahlung
------------------------------------------------------------
Parameters  : value         Lower 90%    Upper 90%
kT [keV]    : 199.363       (-77.3059      -199.363)
Norm        : 12.7694       (-2.22551     2.2256)
------------------------------------------------------------
#Fit statistic : Chi-Squared =          42.31 using 59 PHA bins.
# Reduced chi-squared =         0.7423 for     57 degrees of freedom
# Null hypothesis probability =   9.267028e-01

Energy  Fluence     90% Error
[keV]   [erg/cm2]   [erg/cm2]
15- 25  4.070e-09   2.399e-09
25- 50  7.829e-09   4.440e-09
50-150  1.717e-08   9.914e-09
15-150  2.907e-08   1.628e-08
Double BB
R1^2/D10^2  : 0.456948        (      )
kT2 [keV]   : 196.682        (-196.796      -196.796)
R2^2/D10^2  : 2.59275E-04    (-0.000248742   0.200449)
------------------------------------------------------------
#Fit statistic : Chi-Squared =          40.76 using 59 PHA bins.
#Fit statistic : Chi-Squared =          39.98 using 59 PHA bins.
#Fit statistic : Chi-Squared =          39.94 using 59 PHA bins.
# Reduced chi-squared =         0.7411 for     55 degrees of freedom
# Reduced chi-squared =         0.7269 for     55 degrees of freedom
# Reduced chi-squared =         0.7261 for     55 degrees of freedom
# Null hypothesis probability =   9.238013e-01
# Null hypothesis probability =   9.361393e-01
# Null hypothesis probability =   9.367795e-01

Energy  Fluence     90% Error
[keV]   [erg/cm2]   [erg/cm2]
15- 25  2.927e-09   1.145e-09
25- 50  7.539e-09   2.807e-09
50-150  1.682e-08   5.926e-09
15-150  2.729e-08   7.846e-09
Peak spectrum fit
Power-law model

Time interval is from   -0.430 sec. to    0.570 sec.

Spectral model in power-law:
------------------------------------------------------------
Parameters  : value       lower 90%   higher 90%
Photon index: 1.45937     ( -0.572321   0.543132 )
Norm@50keV  : 4.66719E-03    ( -0.00127513   0.00127167 )
------------------------------------------------------------
#Fit statistic : Chi-Squared =          59.29 using 59 PHA bins.
# Reduced chi-squared =          1.040 for     57 degrees of freedom
# Null hypothesis probability =   3.920028e-01

Photon flux (15-150 keV)    in 1 sec: 0.576518 ( -0.168867  0.170894 ) ph/cm2/s
Energy fluence (15-150 keV)             : 4.45854e-08 ( -1.30408e-08  1.32602e-08 ) ergs/cm2
Cutoff power-law model

Time interval is from   -0.430 sec. to    0.570 sec.
Spectral model in the cutoff power-law:
------------------------------------------------------------
Parameters  : value       lower 90%   higher 90%
Photon index: 1.47723     ( -0.594816   0.527872 )
Epeak [keV] : 9999.25      ( -9999.36 -9999.36 )
Norm@50keV  : 4.64482E-03    ( -0.00127791   0.0228607 )
------------------------------------------------------------
#Fit statistic : Chi-Squared =          59.30 using 59 PHA bins.
# Reduced chi-squared =          1.059 for     56 degrees of freedom
# Null hypothesis probability =   3.561186e-01

Photon flux (15-150 keV)    in 1 sec: 0.582572 ( -0.174732  0.165375 ) ph/cm2/s
Energy fluence (15-150 keV)             : 4.44674e-08 ( -1.29111e-08  1.29466e-08 ) ergs/cm2
Band function
Time interval is from   -0.430 sec. to    0.570 sec.

Spectral model in the Band function:
------------------------------------------------------------
Parameters  : value       lower 90%   higher 90%
alpha       : -9.59514   ( 9.59514   9.59514 )
beta        : -1.45937    ( -0.543152   0.572196 )
Epeak [keV] : 100.946      ( -100.946 -100.946 )
Norm@50keV   : 0.634337    ( -0.173366   0.172838 )
------------------------------------------------------------
#Fit statistic : Chi-Squared =          59.29 using 59 PHA bins.
# Reduced chi-squared =          1.078 for     55 degrees of freedom
# Null hypothesis probability =   3.219611e-01

Photon flux (15-150 keV)    in 1 sec:  (    ) ph/cm2/s
Energy fluence (15-150 keV)             : 0 ( 0  0 ) ergs/cm2
Single BB
Spectral model blackbody:
------------------------------------------------------------
Parameters  : value    Lower 90%  Upper 90%
kT [keV]    : 13.4517  (-3.87095  7.68926)
R^2/D10^2   : 9.25333E-02  (-0.0922989   0.23104)
(R is the radius in km and D10 is the distance to the source in units of 10 kpc)
------------------------------------------------------------
#Fit statistic : Chi-Squared =          63.94 using 59 PHA bins.
# Reduced chi-squared =          1.122 for     57 degrees of freedom
# Null hypothesis probability =   2.459552e-01

Energy  Fluence     90% Error
[keV]   [erg/cm2]   [erg/cm2]
15- 25  3.547e-09   2.161e-09
25- 50  1.267e-08   7.438e-09
50-150  1.477e-08   9.555e-09
15-150  3.099e-08   1.916e-08
Thermal bremsstrahlung (OTTB)
Spectral model: thermal bremsstrahlung
------------------------------------------------------------
Parameters  : value         Lower 90%    Upper 90%
kT [keV]    : 199.363       (-199.363      -199.363)
Norm        : 2.36731       (-0.649347     0.804549)
------------------------------------------------------------
#Fit statistic : Chi-Squared =          59.90 using 59 PHA bins.
# Reduced chi-squared =          1.051 for     57 degrees of freedom
# Null hypothesis probability =   3.707799e-01

Energy  Fluence     90% Error
[keV]   [erg/cm2]   [erg/cm2]
15- 25  5.895e-09   3.578e-09
25- 50  1.134e-08   6.745e-09
50-150  2.487e-08   1.449e-08
15-150  4.210e-08   2.522e-08
Double BB
R1^2/D10^2  : 0.252336        (      )
kT2 [keV]   : 199.363        (-199.363      -199.363)
R2^2/D10^2  : 9.12662E-05    (-4.6781e-05   0.00178104)
------------------------------------------------------------
#Fit statistic : Chi-Squared =          62.57 using 59 PHA bins.
#Fit statistic : Chi-Squared =          56.25 using 59 PHA bins.
#Fit statistic : Chi-Squared =          56.23 using 59 PHA bins.
# Reduced chi-squared =          1.138 for     55 degrees of freedom
# Reduced chi-squared =          1.023 for     55 degrees of freedom
# Reduced chi-squared =          1.022 for     55 degrees of freedom
# Null hypothesis probability =   2.254560e-01
# Null hypothesis probability =   4.277379e-01
# Null hypothesis probability =   4.287126e-01

Energy  Fluence     90% Error
[keV]   [erg/cm2]   [erg/cm2]
15- 25  5.822e-09   2.781e-09
25- 50  1.094e-08   6.475e-09
50-150  1.807e-08   1.199e-08
15-150  3.483e-08   1.983e-08
Pre-slew spectrum (Pre-slew PHA with pre-slew DRM)
Power-law model

Spectral model in power-law:
------------------------------------------------------------
Parameters  : value       lower 90%   higher 90%
Photon index: 1.37638     ( -0.294023   0.290449 )
Norm@50keV  : 2.50761E-02    ( -0.00436356   0.00436279 )
------------------------------------------------------------
#Fit statistic : Chi-Squared =          41.96 using 59 PHA bins.
# Reduced chi-squared =         0.7362 for     57 degrees of freedom
# Null hypothesis probability =   9.320917e-01

Photon flux (15-150 keV)    in 0.128 sec: 3.03782 ( -0.555579  0.55909 ) ph/cm2/s
Energy fluence (15-150 keV)             : 3.11685e-08 ( -5.76517e-09  5.80954e-09 ) ergs/cm2
Cutoff power-law model
Spectral model in the cutoff power-law:
------------------------------------------------------------
Parameters  : value       lower 90%   higher 90%
Photon index: 0.318881     ( -1.91476   1.18019 )
Epeak [keV] : 84.2545      ( -23.3292 -84.2547 )
Norm@50keV  : 8.03981E-02    ( -0.0803974   0.541364 )
------------------------------------------------------------
#Fit statistic : Chi-Squared =          40.30 using 59 PHA bins.
# Reduced chi-squared =         0.7196 for     56 degrees of freedom
# Null hypothesis probability =   9.436140e-01

Photon flux (15-150 keV)    in 0.128 sec: 2.90784 ( -0.5843  0.58571 ) ph/cm2/s
Energy fluence (15-150 keV)             : 2.94806e-08 ( -6.28826e-09  6.2999e-09 ) ergs/cm2
Band function

Spectral model in the Band function:
------------------------------------------------------------
Parameters  : value       lower 90%   higher 90%
alpha       : 0.241531   ( 0.147199   0.147199 )
beta        : -1.92122    ( 2.09079   0.863947 )
Epeak [keV] : 65.5005      ( -65.3172 208.512 )
Norm@50keV   : 0.168288    ( -0.176799   114.895 )
------------------------------------------------------------
#Fit statistic : Chi-Squared =          39.98 using 59 PHA bins.
# Reduced chi-squared =         0.7268 for     55 degrees of freedom
# Null hypothesis probability =   9.361760e-01

Photon flux (15-150 keV)    in 0.128 sec:  (    ) ph/cm2/s
Energy fluence (15-150 keV)             : 2.9707e-08 ( 0  0 ) ergs/cm2
S(25-50 keV) vs. S(50-100 keV) plot
S(25-50 keV)  = 7.23e-09
S(50-100 keV) = 1.11e-08
T90 vs. Hardness ratio plot
T90                                   = 0.112000018358231 sec.
Hardness ratio (energy fluence ratio) = 1.53527
Color vs. Color plot
Count Ratio  (25-50 keV) / (15-25 keV) = 1.80092
Count Ratio (50-100 keV) / (15-25 keV) = 1.82004
Mask shadow pattern
IMX = 1.205452569865317E-01, IMY = 4.658595688132238E-01
TIME vs. PHA plot around the trigger time
TIME vs. DetID plot around the trigger time
100 us light curve (15-350 keV)
Spacecraft aspect plot
Bright source in the pre-burst/pre-slew/post-slew images
Pre-burst image of 15-350 keV band
Time interval of the image:
-299.176000 0.004000

# RAcent  DECcent POSerr Theta    Phi  PeakCts   SNR AngSep     Name
#  [deg]    [deg]    ['] [deg]  [deg]                   [']
186.8925 -62.8407    8.1  46.3   43.0   1.4861   1.4    7.7	GX 301-2
244.9804 -15.6467    0.2  26.6  159.6  21.3837  74.8    0.4	Sco X-1
255.9502 -37.8312    2.0   2.4  162.9   1.4530   5.8    1.9	4U 1700-377
256.4260 -36.4179    1.5   3.7  177.1   1.9314   7.4    0.6	GX 349+2
263.0578 -24.7435    4.6  16.1 -153.8   0.6872   2.5    2.7	GX 1+4
264.6839 -44.3529    7.6   7.0  -43.2   0.3580   1.5    6.4	4U 1735-44
268.5192  -1.5606    6.0  39.9 -155.6  -0.7659  -1.9   11.1	SW J1753.5-0127
270.3545 -25.1414    4.4  18.5 -133.0   0.8093   2.6    5.3	GX 5-1
270.3518 -25.7248    3.3  18.1 -132.0   1.1341   3.8    2.9	GRS 1758-258
273.9708 -14.0495    1.8  29.9 -139.2   2.1338   6.4    2.2	GX 17+2
276.1103 -30.3749    7.6  18.2 -109.7   0.3979   1.5    9.6	H1820-303
284.8339 -24.8454   19.7  27.7 -108.3   0.2084   0.6   11.9	HT1900.1-2455
262.8904 -33.9178    4.8   7.6 -135.1   0.6077   2.4    7.0	GX 354-0
238.7673 -43.7312    3.2  14.2   75.5   0.9021   3.7 ------	UNKNOWN
243.0431 -26.5425    3.0  17.9  141.3   0.8541   3.8 ------	UNKNOWN
296.1554 -54.7085    3.1  29.6  -40.7   1.0868   3.8 ------	UNKNOWN
331.2291 -51.2298    3.4  50.7  -44.5   4.9938   3.4 ------	UNKNOWN
Pre-slew background subtracted image of 15-350 keV band
Time interval of the image:
0.004000 0.132000

# RAcent  DECcent POSerr Theta    Phi  PeakCts   SNR AngSep     Name
#  [deg]    [deg]    ['] [deg]  [deg]                   [']
186.3713 -62.7255    3.7  46.6   43.2   0.0473   3.2    8.3	GX 301-2
244.8387 -15.6167   12.0  26.7  159.3   0.0044   1.0    8.3	Sco X-1
255.7789 -37.7100    0.0   2.6  161.2   0.0027   0.7   12.7	4U 1700-377
256.2605 -36.5143   25.0   3.6  174.8   0.0018   0.5   10.1	GX 349+2
262.8809 -24.9143    0.0  15.9 -154.2   0.0025   0.6   12.3	GX 1+4
264.9417 -44.3986    4.8   7.2  -43.8   0.0095   2.4    9.1	4U 1735-44
268.3671  -1.5014    5.7  39.9 -155.8   0.0122   2.0    2.9	SW J1753.5-0127
270.2838 -25.0789   26.5  18.6 -133.3  -0.0018  -0.4    0.0	GX 5-1
270.3176 -25.7226 2529.6  18.0 -132.0   0.0000   0.0    1.5	GRS 1758-258
274.0800 -13.8788    4.8  30.1 -139.1  -0.0125  -2.4   10.4	GX 17+2
275.7891 -30.4875    8.2  17.9 -109.9   0.0063   1.4   10.1	H1820-303
285.0954 -24.7913    3.6  27.9 -108.1  -0.0184  -3.2    8.4	HT1900.1-2455
263.1574 -33.7697    6.6   7.9 -134.3   0.0068   1.7    9.3	GX 354-0
212.9994 -23.7572    2.0  40.4  106.7   0.0817   5.7 ------	UNKNOWN
254.5335 -78.7237    2.4  38.7    7.4   0.0275   4.8 ------	UNKNOWN
290.5836 -38.7265    1.2  25.7  -75.5   0.0558   9.7 ------	UNKNOWN
Post-slew image of 15-350 keV band
Time interval of the image:
-299.176000 242.846100

# RAcent  DECcent POSerr Theta    Phi  PeakCts   SNR AngSep     Name
#  [deg]    [deg]    ['] [deg]  [deg]                   [']
186.8566 -62.8151    5.8  46.4   43.1   3.6804   2.0    6.1	GX 301-2
244.9800 -15.6456    0.1  26.6  159.6  45.0411  88.9    0.3	Sco X-1
255.9596 -37.8329    1.4   2.4  163.1   3.8403   8.4    1.4	4U 1700-377
256.4210 -36.4211    1.9   3.7  177.0   2.8524   6.1    0.7	GX 349+2
263.1124 -24.8816    7.0  16.0 -153.5   0.7916   1.6    9.9	GX 1+4
264.9085 -44.2823   10.0   7.1  -44.4   0.4564   1.2   12.3	4U 1735-44
268.5129  -1.5100    5.2  39.9 -155.6  -1.5757  -2.2    9.3	SW J1753.5-0127
270.3197 -25.0771    5.9  18.6 -133.2   1.0846   2.0    1.9	GX 5-1
270.3369 -25.7583    3.5  18.0 -131.9   1.7802   3.3    2.1	GRS 1758-258
273.9808 -14.0444    1.8  29.9 -139.2   3.8192   6.5    1.5	GX 17+2
276.0483 -30.3903    6.6  18.1 -109.8   0.7944   1.8    6.5	H1820-303
284.8243 -24.8465   33.9  27.7 -108.3   0.2096   0.3   12.4	HT1900.1-2455
262.8863 -33.8993    4.1   7.7 -135.2   1.2650   2.8    6.4	GX 354-0
235.8955   5.2523    2.7  49.4  158.1   5.9288   4.2 ------	UNKNOWN
299.8587 -62.4744    3.1  33.8  -27.7   2.0088   3.8 ------	UNKNOWN
Plot creation:
Sun May 31 17:37:09 EDT 2015