Estimated redshift from machine learning (Ukwatta et al. 2016) - may take a few minute to calcaulte
Image
Pre-slew 15.0-350.0 keV image (Event data)
#   RAcent    DECcent   POSerr    Theta     Phi              Peak Cts       SNR   Name
  212.9611    35.9953   0.0134    32.4196   -22.1333         1.6556148     14.286 TRIG_01044236

Foreground time interval of the image:
 11.960  72.501 (delta_t =  60.541 [sec])
Background time interval of the image:
-203.899  11.960 (delta_t = 215.859 [sec])
Lightcurves
Notes:
- 1) The mask-weighted light curves are using the flight position.
- 2) Multiple plots of different time binning/intervals are shown to cover all scenarios of short/long GRBs, rate/image triggers, and real/false positives.
- 3) For all the mask-weighted lightcurves, the y-axis units are counts/sec/det where a det is 0.4 x 0.4 = 0.16 sq cm.
- 4) The verticle lines correspond to following: green dotted lines are T50 interval, black dotted lines are T90 interval, blue solid line(s) is a spacecraft slew start time, and orange solid line(s) is a spacecraft slew end time.
- 5) Time of each bin is in the middle of the bin.
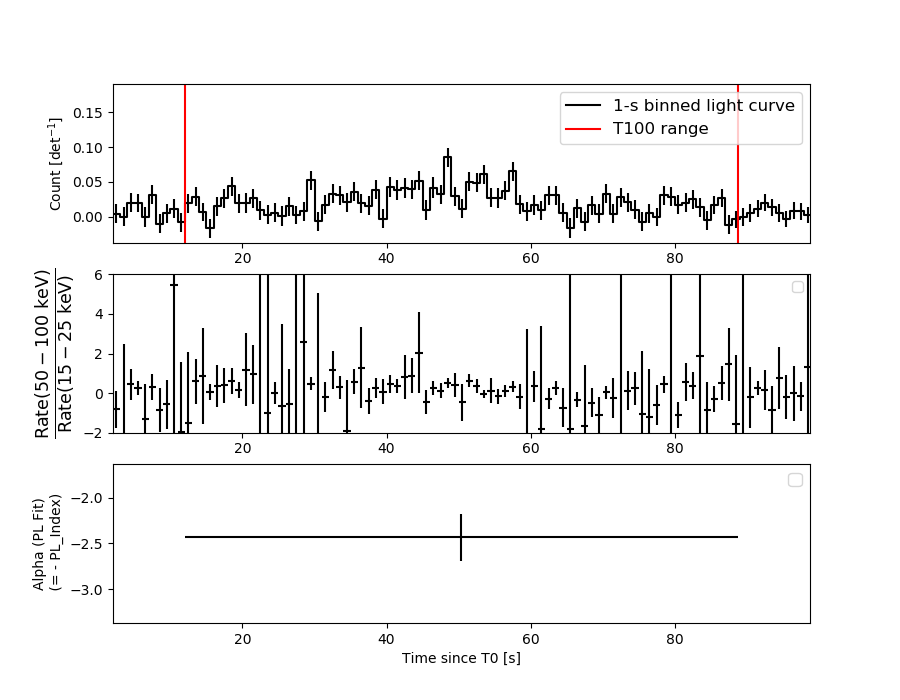
1 s binning
From T0-310 s to T0+310 s
From T100_start - 20 s to T100_end + 30 s
Full time interval
64 ms binning
Full time interval
From T100_start to T100_end
From T0-5 sec to T0+5 sec
16 ms binning
From T100_start-5 s to T100_start+5 s
8 ms binning
From T100_start-3 s to T100_start+3 s
2 ms binning
From T100_start-1 s to T100_start+1 s
SN=5 or 10 sec. binning (whichever binning is satisfied first)
SN=5 or 10 sec. binning (T < 200 sec)
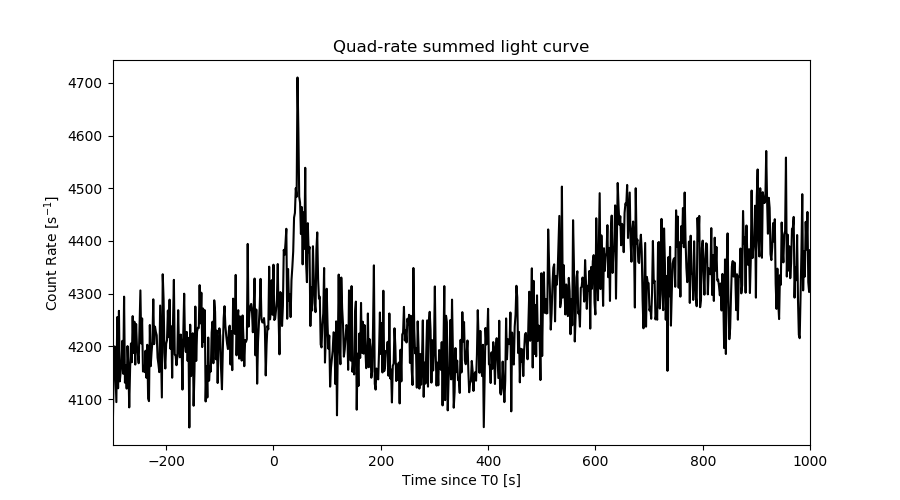
Quad-rate summed light curves (from T0-300s to T0+1000s)
Spectral Evolution
Spectra
Notes:
- 1) The fitting includes the systematic errors.
- 2) When the burst includes telescope slew time periods, the fitting uses an average response file made from multiple 5-s response files through out the slew time plus single time preiod for the non-slew times, and weighted by the total counts in the corresponding time period using addrmf. An average response file is needed becuase a spectral fit using the pre-slew DRM will introduce some errors in both a spectral shape and a normalization if the PHA file contains a lot of the slew/post-slew time interval.
- 3) For fits to more complicated models (e.g. a power-law over a cutoff power-law), the BAT team has decided to require a chi-square improvement of more than 6 for each extra dof.
Time averaged spectrum fit using the average DRM
Power-law model
Time interval is from   11.960 sec. to   88.780 sec.

Spectral model in power-law:
------------------------------------------------------------
Parameters  : value       lower 90%   higher 90%
Photon index: 2.42570     ( -0.245422   0.272017 )
Norm@50keV  : 1.03667E-03    ( -0.000200566   0.000197202 )
------------------------------------------------------------
#Fit statistic  : Chi-Squared                   56.59     using 59 bins.
 Reduced chi-squared = 0.992807
# Null hypothesis probability of 4.91e-01 with 57 degrees of freedom

Photon flux (15-150 keV)    in 76.82 sec: 0.194760 ( -0.022761  0.022761 ) ph/cm2/s
Energy fluence (15-150 keV)             : 7.81674e-07 ( -1.13877e-07  1.17956e-07 ) ergs/cm2
Cutoff power-law model

Time interval is from   11.960 sec. to   88.780 sec.
Spectral model in the cutoff power-law:
------------------------------------------------------------
Parameters  : value       lower 90%   higher 90%
Photon index: 1.61098     ( -1.41116   0.398179 )
Epeak [keV] : 17.5623      ( -15.0695 14.6765 )
Norm@50keV  : 3.33265E-03    ( -0.00180141   0.0228322 )
------------------------------------------------------------
#Fit statistic  : Chi-Squared                   55.04     using 59 bins.
 Reduced chi-squared = 0.982857
# Null hypothesis probability of 5.11e-01 with 56 degrees of freedom

Photon flux (15-150 keV)    in 76.82 sec: 0.189889 ( -0.023447  0.023577 ) ph/cm2/s
Energy fluence (15-150 keV)             : 7.2416e-07 ( -1.18743e-07  1.32097e-07 ) ergs/cm2
Band function

Time interval is from   11.960 sec. to   88.780 sec.


Spectral model in the Band function:
------------------------------------------------------------
Parameters  : value       lower 90%   higher 90%
alpha       :    (     )
beta        :     (     )
Epeak [keV] :       (   )
Norm@50keV   :     (     )
------------------------------------------------------------

Photon flux (15-150 keV)    in  sec:  (    ) ph/cm2/s
Energy fluence (15-150 keV)             : 0 ( 0  0 ) ergs/cm2
Single BB
Spectral model blackbody:
------------------------------------------------------------
Parameters  : value    Lower 90%  Upper 90%
kT [keV]    : 7.81820  (-1.01424  1.1334)
R^2/D10^2   : 0.230840  (-0.0975114   0.176286)
(R is the radius in km and D10 is the distance to the source in units of 10 kpc)
------------------------------------------------------------
#Fit statistic  : Chi-Squared                   65.32     using 59 bins.
 Reduced chi-squared =
# Null hypothesis probability of 2.10e-01 with 57 degrees of freedom

Energy  Fluence     90% Error
[keV]   [erg/cm2]   [erg/cm2]
15- 25  1.926e-07   3.995e-08
25- 50  3.238e-07   5.800e-08
50-150  7.877e-08   3.148e-08
15-150  5.951e-07   1.022e-07
Thermal bremsstrahlung (OTTB)
Spectral model: thermal bremsstrahlung
------------------------------------------------------------
Parameters  : value         Lower 90%    Upper 90%
kT [keV]    : 35.4177       (-9.06121      13.3951)
Norm        : 1.36668       (-0.298376     0.409385)
------------------------------------------------------------
#Fit statistic  : Chi-Squared                   55.20     using 59 bins.
 Reduced chi-squared =
# Null hypothesis probability of 5.43e-01 with 57 degrees of freedom

Energy  Fluence     90% Error
[keV]   [erg/cm2]   [erg/cm2]
15- 25  2.305e-07   3.576e-08
25- 50  2.869e-07   4.828e-08
50-150  1.932e-07   7.924e-08
15-150  7.106e-07   1.197e-07
Double BB
Spectral model: bbodyrad<1> + bbodyrad<2>
------------------------------------------------------------
Parameters  : value         Lower 90%    Upper 90%
kT1 [keV]   : 2.86937        (-1.47386      2.53194)
R1^2/D10^2  : 11.4031        (-10.6298      2771.41)
kT2 [keV]   : 10.1353        (-2.02046      5.16702)
R2^2/D10^2  : 6.75236E-02    (-0.0589194   0.113959)
------------------------------------------------------------
#Fit statistic  : Chi-Squared                   54.67     using 59 bins.
 Reduced chi-squared =
# Null hypothesis probability of 4.87e-01 with 55 degrees of freedom

Energy  Fluence     90% Error
[keV]   [erg/cm2]   [erg/cm2]
15- 25  2.325e-07   1.172e-07
25- 50  2.916e-07   1.498e-07
50-150  1.499e-07   8.767e-08
15-150  6.740e-07   3.110e-07
Peak spectrum fit
Power-law model

Time interval is from   47.972 sec. to   48.972 sec.

Spectral model in power-law:
------------------------------------------------------------
Parameters  : value       lower 90%   higher 90%
Photon index: 1.87677     ( -0.436885   0.483855 )
Norm@50keV  : 5.77815E-03    ( -0.00170785   0.0015984 )
------------------------------------------------------------
#Fit statistic  : Chi-Squared                   76.21     using 59 bins.
 Reduced chi-squared = 1.33702
# Null hypothesis probability of 4.55e-02 with 57 degrees of freedom

Photon flux (15-150 keV)    in 1 sec: 0.821217 ( -0.192549  0.192673 ) ph/cm2/s
Energy fluence (15-150 keV)             : 5.31276e-08 ( -1.48134e-08  1.52935e-08 ) ergs/cm2
Cutoff power-law model
Time interval is from   47.972 sec. to   48.972 sec.
Spectral model in the cutoff power-law:
------------------------------------------------------------
Parameters  : value       lower 90%   higher 90%
Photon index: 2.26113     ( -0.598576   0.483741 )
Epeak [keV] : 100.789      ( -9999.32 -9999.33 )
Norm@50keV  : 3.56048E-03    ( -0.00167181   0.026067 )
------------------------------------------------------------
#Fit statistic  : Chi-Squared                   75.78     using 59 bins.
 Reduced chi-squared = 1.35321
# Null hypothesis probability of 4.03e-02 with 56 degrees of freedom

Photon flux (15-150 keV)    in 1 sec: 0.665916 ( -0.29162  0.475754 ) ph/cm2/s
Energy fluence (15-150 keV)             : 4.8463e-08 ( -2.09435e-08  1.51169e-08 ) ergs/cm2
Band function

Time interval is from   47.972 sec. to   48.972 sec.


Spectral model in the Band function:
------------------------------------------------------------
Parameters  : value       lower 90%   higher 90%
alpha       :    (     )
beta        :     (     )
Epeak [keV] :       (   )
Norm@50keV   :     (     )
------------------------------------------------------------

Photon flux (15-150 keV)    in  sec:  (    ) ph/cm2/s
Energy fluence (15-150 keV)             : 0 ( 0  0 ) ergs/cm2
Single BB
Spectral model blackbody:
------------------------------------------------------------
Parameters  : value    Lower 90%  Upper 90%
kT [keV]    : 9.43100  (-2.31052  3.53196)
R^2/D10^2   : 0.472079  (-0.333738   0.932089)
(R is the radius in km and D10 is the distance to the source in units of 10 kpc)
------------------------------------------------------------
#Fit statistic  : Chi-Squared                   82.37     using 59 bins.
 Reduced chi-squared =
# Null hypothesis probability of 1.56e-02 with 57 degrees of freedom

Energy  Fluence     90% Error
[keV]   [erg/cm2]   [erg/cm2]
15- 25  8.359e-09   4.655e-09
25- 50  1.908e-08   9.547e-09
50-150  8.386e-09   5.407e-09
15-150  3.583e-08   1.539e-08
Thermal bremsstrahlung (OTTB)
Spectral model: thermal bremsstrahlung
------------------------------------------------------------
Parameters  : value         Lower 90%    Upper 90%
kT [keV]    : 88.8909       (-50.5508      -88.9222)
Norm        : 3.70835       (-1.12124     1.91164)
------------------------------------------------------------
#Fit statistic  : Chi-Squared                   77.13     using 59 bins.
 Reduced chi-squared =
# Null hypothesis probability of 3.91e-02 with 57 degrees of freedom

Energy  Fluence     90% Error
[keV]   [erg/cm2]   [erg/cm2]
15- 25  9.672e-09   3.652e-09
25- 50  1.631e-08   7.868e-09
50-150  2.465e-08   2.005e-08
15-150  5.064e-08   2.997e-08
Double BB
Spectral model: bbodyrad<1> + bbodyrad<2>
------------------------------------------------------------
Parameters  : value         Lower 90%    Upper 90%
kT1 [keV]   : 7.21983        (-3.30409      2.95954)
R1^2/D10^2  : 1.12611        (-0.721079      6.96155)
kT2 [keV]   : 47.4475        (-43.5779      -60.2922)
R2^2/D10^2  : 1.21276E-03    (-0.000698043   0.0397513)
------------------------------------------------------------
#Fit statistic  : Chi-Squared                   75.86     using 59 bins.
 Reduced chi-squared =
# Null hypothesis probability of 3.26e-02 with 55 degrees of freedom

Energy  Fluence     90% Error
[keV]   [erg/cm2]   [erg/cm2]
15- 25  1.004e-08   6.005e-09
25- 50  1.635e-08   9.700e-09
50-150  2.830e-08   1.683e-08
15-150  5.469e-08   2.809e-08
Pre-slew spectrum (Pre-slew PHA with pre-slew DRM)
Power-law model
Spectral model in power-law:
------------------------------------------------------------
Parameters  : value       lower 90%   higher 90%
Photon index: 2.38037     ( -0.242345   0.268027 )
Norm@50keV  : 1.19275E-03    ( -0.000226253   0.000221901 )
------------------------------------------------------------
#Fit statistic  : Chi-Squared                   52.65     using 59 bins.
 Reduced chi-squared =
# Null hypothesis probability of 6.39e-01 with 57 degrees of freedom

Photon flux (15-150 keV)    in 60.54 sec: 0.218179 ( -0.0256846  0.0256846 ) ph/cm2/s
Energy fluence (15-150 keV)             : 7.01301e-07 ( -1.02579e-07  1.06234e-07 ) ergs/cm2
Cutoff power-law model
Spectral model in the cutoff power-law:
------------------------------------------------------------
Parameters  : value       lower 90%   higher 90%
Photon index: 1.56310     ( -1.4165   0.437489 )
Epeak [keV] : 19.9628      ( -19.5754 13.9865 )
Norm@50keV  : 3.81127E-03    ( -0.00214237   0.0262655 )
------------------------------------------------------------
#Fit statistic  : Chi-Squared                   50.96     using 59 bins.
 Reduced chi-squared =
# Null hypothesis probability of 6.66e-01 with 56 degrees of freedom

Photon flux (15-150 keV)    in 60.54 sec: 0.212674 ( -0.026435  0.026568 ) ph/cm2/s
Energy fluence (15-150 keV)             : 6.50206e-07 ( -1.08248e-07  1.22696e-07 ) ergs/cm2
Band function
Spectral model in the Band function:
------------------------------------------------------------
Parameters  : value       lower 90%   higher 90%
alpha       :    (     )
beta        :     (     )
Epeak [keV] :       (   )
Norm@50keV   :     (     )
------------------------------------------------------------

Photon flux (15-150 keV)    in  sec:  (    ) ph/cm2/s
Energy fluence (15-150 keV)             : 0 ( 0  0 ) ergs/cm2
S(25-50 keV) vs. S(50-100 keV) plot
S(25-50 keV)  = 2.57e-07
S(50-100 keV) = 1.91e-07
T90 vs. Hardness ratio plot
T90                                   = 54.4919998645782 sec.
Hardness ratio (energy fluence ratio) = 0.743191
Color vs. Color plot
Count Ratio  (25-50 keV) / (15-25 keV) = 0.98469
Count Ratio (50-100 keV) / (15-25 keV) = 0.263172
Mask shadow pattern
IMX = 5.882977985748454E-01, IMY = 2.392812365451210E-01
TIME vs. PHA plot around the trigger time
TIME vs. DetID plot around the trigger time
100 us light curve (15-350 keV)
Spacecraft aspect plot
Bright source in the pre-burst/pre-slew/post-slew images
Pre-burst image of 15-350 keV band
Time interval of the image:
-203.899390 11.960000

# RAcent  DECcent POSerr Theta    Phi  PeakCts   SNR AngSep     Name
#  [deg]    [deg]    ['] [deg]  [deg]                   [']
161.3357  23.4290    3.0  32.3 -116.0   1.4078   3.8 ------	UNKNOWN
Pre-slew background subtracted image of 15-350 keV band
Time interval of the image:
11.960000 72.500590

# RAcent  DECcent POSerr Theta    Phi  PeakCts   SNR AngSep     Name
#  [deg]    [deg]    ['] [deg]  [deg]                   [']
183.3775 -12.3301    2.9  23.7  146.6   0.4245   4.0 ------	UNKNOWN
217.9949  35.5287    2.6  35.0  -16.3   0.5639   4.4 ------	UNKNOWN
212.9611  35.9954    0.8  32.4  -22.1   1.6548  14.3 ------	UNKNOWN
228.8389  41.2229    2.4  45.2  -15.3   0.8059   4.8 ------	UNKNOWN
154.2576  18.6884    1.7  37.6 -126.8   1.1509   6.6 ------	UNKNOWN
149.1931  26.6425    2.2  43.8 -116.2   2.1575   5.2 ------	UNKNOWN
Post-slew image of 15-350 keV band
Time interval of the image:
136.100600 408.100600

# RAcent  DECcent POSerr Theta    Phi  PeakCts   SNR AngSep     Name
#  [deg]    [deg]    ['] [deg]  [deg]                   [']
254.5446  35.4389   73.8  33.5  -18.0   0.0500   0.2    7.2	Her X-1
209.3279  14.7456    2.5  21.5   93.3   1.4814   4.6 ------	UNKNOWN
213.1117  39.3191    2.7   3.3  -94.4   0.9888   4.3 ------	UNKNOWN
275.1574  23.9230    2.3  54.3  -11.8   3.8642   5.1 ------	UNKNOWN
141.2798  48.3952    3.7  52.5 -148.9   2.5935   3.1 ------	UNKNOWN
270.0378  63.6232    2.8  43.8  -63.7   4.6163   4.1 ------	UNKNOWN
Plot creation:
Sat Jul 30 07:05:25 EDT 2022