Estimated redshift from machine learning (Ukwatta et al. 2016) - may take a few minute to calcaulte
Image
Pre-slew 15.0-350.0 keV image (Event data)
#   RAcent    DECcent   POSerr    Theta     Phi              Peak Cts       SNR   Name
  104.8832     4.9286   0.0077    34.1798    24.9301         3.7244045     25.102 TRIG_01044426

Foreground time interval of the image:
-21.744  23.517 (delta_t =  45.261 [sec])
Background time interval of the image:
-239.184 -21.744 (delta_t = 217.440 [sec])
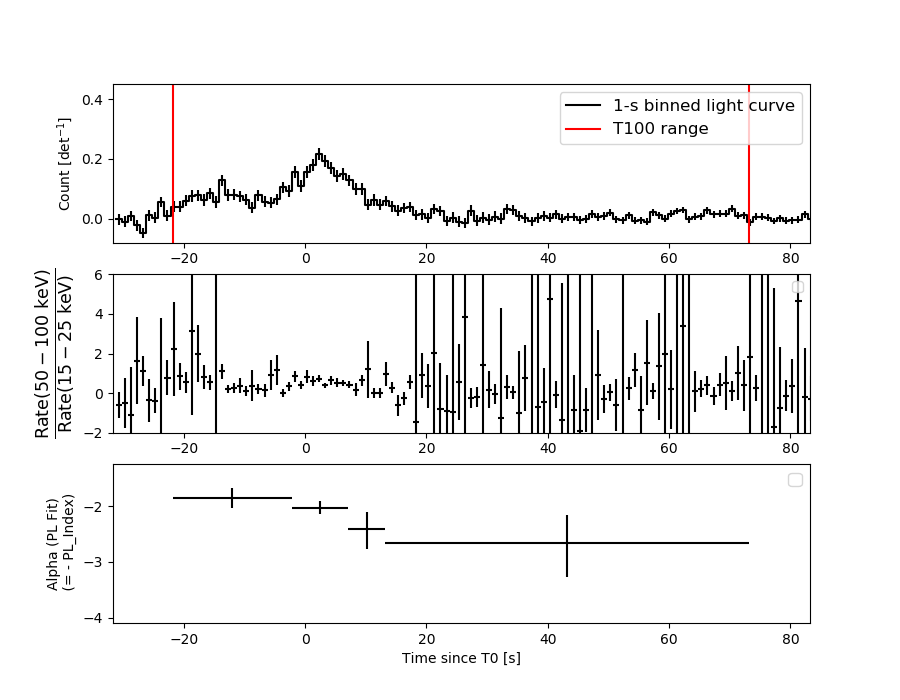
Lightcurves
Notes:
- 1) The mask-weighted light curves are using the flight position.
- 2) Multiple plots of different time binning/intervals are shown to cover all scenarios of short/long GRBs, rate/image triggers, and real/false positives.
- 3) For all the mask-weighted lightcurves, the y-axis units are counts/sec/det where a det is 0.4 x 0.4 = 0.16 sq cm.
- 4) The verticle lines correspond to following: green dotted lines are T50 interval, black dotted lines are T90 interval, blue solid line(s) is a spacecraft slew start time, and orange solid line(s) is a spacecraft slew end time.
- 5) Time of each bin is in the middle of the bin.
1 s binning
From T0-310 s to T0+310 s
From T100_start - 20 s to T100_end + 30 s
Full time interval
64 ms binning
Full time interval
From T100_start to T100_end
From T0-5 sec to T0+5 sec
16 ms binning
From T100_start-5 s to T100_start+5 s
8 ms binning
From T100_start-3 s to T100_start+3 s
2 ms binning
From T100_start-1 s to T100_start+1 s
SN=5 or 10 sec. binning (whichever binning is satisfied first)
SN=5 or 10 sec. binning (T < 200 sec)
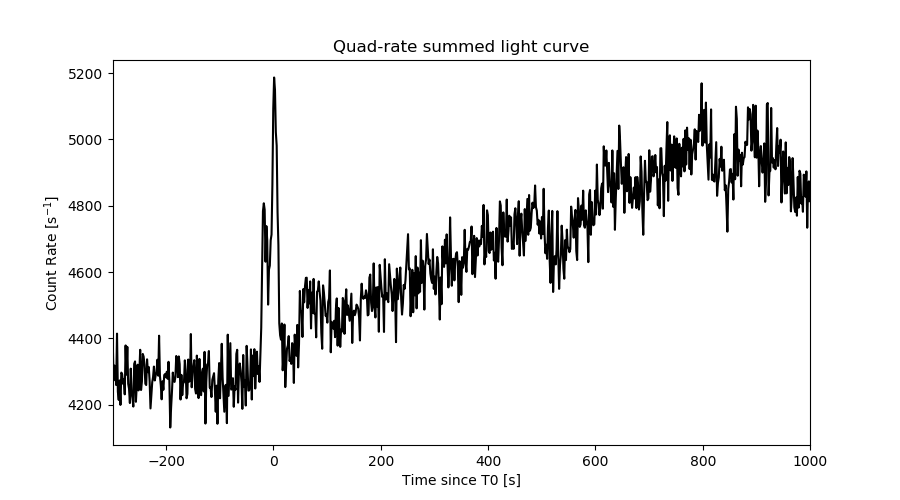
Quad-rate summed light curves (from T0-300s to T0+1000s)
Spectral Evolution
Spectra
Notes:
- 1) The fitting includes the systematic errors.
- 2) When the burst includes telescope slew time periods, the fitting uses an average response file made from multiple 5-s response files through out the slew time plus single time preiod for the non-slew times, and weighted by the total counts in the corresponding time period using addrmf. An average response file is needed becuase a spectral fit using the pre-slew DRM will introduce some errors in both a spectral shape and a normalization if the PHA file contains a lot of the slew/post-slew time interval.
- 3) For fits to more complicated models (e.g. a power-law over a cutoff power-law), the BAT team has decided to require a chi-square improvement of more than 6 for each extra dof.
Time averaged spectrum fit using the average DRM
Power-law model
Time interval is from  -21.744 sec. to   73.216 sec.

Spectral model in power-law:
------------------------------------------------------------
Parameters  : value       lower 90%   higher 90%
Photon index: 2.14293     ( -0.128413   0.133211 )
Norm@50keV  : 2.43501E-03    ( -0.000212842   0.000209833 )
------------------------------------------------------------
#Fit statistic  : Chi-Squared                   63.71     using 59 bins.
 Reduced chi-squared = 1.11772
# Null hypothesis probability of 2.52e-01 with 57 degrees of freedom

Photon flux (15-150 keV)    in 94.96 sec: 0.391447 ( -0.026619  0.026638 ) ph/cm2/s
Energy fluence (15-150 keV)             : 2.15859e-06 ( -1.6732e-07  1.69503e-07 ) ergs/cm2
Cutoff power-law model
Time interval is from  -21.744 sec. to   73.216 sec.
Spectral model in the cutoff power-law:
------------------------------------------------------------
Parameters  : value       lower 90%   higher 90%
Photon index: 2.13245     ( -0.119649   0.144751 )
Epeak [keV] : 9999.36      (   )
Norm@50keV  : 2.45667E-03    (     )
------------------------------------------------------------
#Fit statistic  : Chi-Squared                   63.74     using 59 bins.
 Reduced chi-squared = 1.13821
# Null hypothesis probability of 2.23e-01 with 56 degrees of freedom

Photon flux (15-150 keV)    in 94.96 sec: 0.378954 ( -0.02844  0.028413 ) ph/cm2/s
Energy fluence (15-150 keV)             : 0 ( 0  0 ) ergs/cm2
Band function

Time interval is from  -21.744 sec. to   73.216 sec.


Spectral model in the Band function:
------------------------------------------------------------
Parameters  : value       lower 90%   higher 90%
alpha       :    (     )
beta        :     (     )
Epeak [keV] :       (   )
Norm@50keV   :     (     )
------------------------------------------------------------

Photon flux (15-150 keV)    in  sec:  (    ) ph/cm2/s
Energy fluence (15-150 keV)             : 0 ( 0  0 ) ergs/cm2
Single BB
Spectral model blackbody:
------------------------------------------------------------
Parameters  : value    Lower 90%  Upper 90%
kT [keV]    : 9.06148  (-0.662826  0.716016)
R^2/D10^2   : 0.260538  (-0.0683496   0.0925492)
(R is the radius in km and D10 is the distance to the source in units of 10 kpc)
------------------------------------------------------------
#Fit statistic  : Chi-Squared                   85.80     using 59 bins.
 Reduced chi-squared =
# Null hypothesis probability of 8.13e-03 with 57 degrees of freedom

Energy  Fluence     90% Error
[keV]   [erg/cm2]   [erg/cm2]
15- 25  3.969e-07   4.563e-08
25- 50  8.526e-07   6.619e-08
50-150  3.321e-07   6.609e-08
15-150  1.582e-06   1.277e-07
Thermal bremsstrahlung (OTTB)
Spectral model: thermal bremsstrahlung
------------------------------------------------------------
Parameters  : value         Lower 90%    Upper 90%
kT [keV]    : 51.6579       (-8.92083      12.1334)
Norm        : 2.16957       (-0.247576     0.303383)
------------------------------------------------------------
#Fit statistic  : Chi-Squared                   59.06     using 59 bins.
 Reduced chi-squared =
# Null hypothesis probability of 4.00e-01 with 57 degrees of freedom

Energy  Fluence     90% Error
[keV]   [erg/cm2]   [erg/cm2]
15- 25  5.074e-07   4.914e-08
25- 50  7.372e-07   5.232e-08
50-150  7.378e-07   1.291e-07
15-150  1.982e-06   1.714e-07
Double BB
Spectral model: bbodyrad<1> + bbodyrad<2>
------------------------------------------------------------
Parameters  : value         Lower 90%    Upper 90%
kT1 [keV]   : 7.18879        (-1.47307      1.12519)
R1^2/D10^2  : 0.554772        (-0.215332      0.585627)
kT2 [keV]   : 28.4962        (-12.7597      69.3359)
R2^2/D10^2  : 1.63988E-03    (-0.00149246   0.0151134)
------------------------------------------------------------
#Fit statistic  : Chi-Squared                   56.97     using 59 bins.
 Reduced chi-squared =
# Null hypothesis probability of 4.02e-01 with 55 degrees of freedom

Energy  Fluence     90% Error
[keV]   [erg/cm2]   [erg/cm2]
15- 25  4.696e-07   7.915e-08
25- 50  7.706e-07   1.405e-07
50-150  8.376e-07   3.981e-07
15-150  2.078e-06   5.228e-07
Peak spectrum fit
Power-law model
Time interval is from    2.468 sec. to    3.468 sec.

Spectral model in power-law:
------------------------------------------------------------
Parameters  : value       lower 90%   higher 90%
Photon index: 1.90520     ( -0.216109   0.231347 )
Norm@50keV  : 1.40632E-02    ( -0.00232672   0.00228206 )
------------------------------------------------------------
#Fit statistic  : Chi-Squared                   56.77     using 59 bins.
 Reduced chi-squared = 0.995965
# Null hypothesis probability of 4.84e-01 with 57 degrees of freedom

Photon flux (15-150 keV)    in 1 sec: 2.02282 ( -0.29281  0.29293 ) ph/cm2/s
Energy fluence (15-150 keV)             : 1.29318e-07 ( -2.08829e-08  2.10966e-08 ) ergs/cm2
Cutoff power-law model
Time interval is from    2.468 sec. to    3.468 sec.
Spectral model in the cutoff power-law:
------------------------------------------------------------
Parameters  : value       lower 90%   higher 90%
Photon index: 0.108457     ( -1.65311   1.16323 )
Epeak [keV] : 46.6161      ( -8.16965 13.6602 )
Norm@50keV  : 0.142076    ( -0.142979   1.11356 )
------------------------------------------------------------
#Fit statistic  : Chi-Squared                   48.77     using 59 bins.
 Reduced chi-squared = 0.870893
# Null hypothesis probability of 7.42e-01 with 56 degrees of freedom

Photon flux (15-150 keV)    in 1 sec: 1.98206 ( -0.29618  0.29574 ) ph/cm2/s
Energy fluence (15-150 keV)             : 1.20224e-07 ( -2.09741e-08  2.1963e-08 ) ergs/cm2
Band function

Time interval is from    2.468 sec. to    3.468 sec.


Spectral model in the Band function:
------------------------------------------------------------
Parameters  : value       lower 90%   higher 90%
alpha       :    (     )
beta        :     (     )
Epeak [keV] :       (   )
Norm@50keV   :     (     )
------------------------------------------------------------

Photon flux (15-150 keV)    in  sec:  (    ) ph/cm2/s
Energy fluence (15-150 keV)             : 0 ( 0  0 ) ergs/cm2
Single BB
Spectral model blackbody:
------------------------------------------------------------
Parameters  : value    Lower 90%  Upper 90%
kT [keV]    : 11.2341  (-1.47617  1.70513)
R^2/D10^2   : 0.682969  (-0.285906   0.474233)
(R is the radius in km and D10 is the distance to the source in units of 10 kpc)
------------------------------------------------------------
#Fit statistic  : Chi-Squared                   51.59     using 59 bins.
 Reduced chi-squared =
# Null hypothesis probability of 6.78e-01 with 57 degrees of freedom

Energy  Fluence     90% Error
[keV]   [erg/cm2]   [erg/cm2]
15- 25  1.808e-08   4.590e-09
25- 50  5.251e-08   1.107e-08
50-150  3.804e-08   1.202e-08
15-150  1.086e-07   2.009e-08
Thermal bremsstrahlung (OTTB)
Spectral model: thermal bremsstrahlung
------------------------------------------------------------
Parameters  : value         Lower 90%    Upper 90%
kT [keV]    : 78.1597       (-24.8312      44.9592)
Norm        : 9.90871       (-1.84674     2.23877)
------------------------------------------------------------
#Fit statistic  : Chi-Squared                   51.67     using 59 bins.
 Reduced chi-squared =
# Null hypothesis probability of 6.74e-01 with 57 degrees of freedom

Energy  Fluence     90% Error
[keV]   [erg/cm2]   [erg/cm2]
15- 25  2.567e-08   4.875e-09
25- 50  4.202e-08   6.430e-09
50-150  5.839e-08   3.013e-08
15-150  1.261e-07   2.821e-08
Double BB
Spectral model: bbodyrad<1> + bbodyrad<2>
------------------------------------------------------------
Parameters  : value         Lower 90%    Upper 90%
kT1 [keV]   : 8.27079        (-8.32002      4.85724)
R1^2/D10^2  : 1.39957        (-1.32351      -1.33911)
kT2 [keV]   : 18.6692        (-19.6026      -19.6028)
R2^2/D10^2  : 4.96464E-02    (-0.0382914   0.654349)
------------------------------------------------------------
#Fit statistic  : Chi-Squared                   48.76     using 59 bins.
 Reduced chi-squared =
# Null hypothesis probability of 7.11e-01 with 55 degrees of freedom

Energy  Fluence     90% Error
[keV]   [erg/cm2]   [erg/cm2]
15- 25  2.115e-08   1.254e-08
25- 50  4.910e-08   3.137e-08
50-150  5.110e-08   2.994e-08
15-150  1.214e-07   7.140e-08
Pre-slew spectrum (Pre-slew PHA with pre-slew DRM)
Power-law model
Spectral model in power-law:
------------------------------------------------------------
Parameters  : value       lower 90%   higher 90%
Photon index: 2.06282     ( -0.112746   0.116002 )
Norm@50keV  : 4.78722E-03    ( -0.000350901   0.000346517 )
------------------------------------------------------------
#Fit statistic  : Chi-Squared                   70.53     using 59 bins.
 Reduced chi-squared =
# Null hypothesis probability of 1.07e-01 with 57 degrees of freedom

Photon flux (15-150 keV)    in 45.26 sec: 0.739626 ( -0.0453984  0.0454543 ) ph/cm2/s
Energy fluence (15-150 keV)             : 2.00647e-06 ( -1.35886e-07  1.3704e-07 ) ergs/cm2
Cutoff power-law model
Spectral model in the cutoff power-law:
------------------------------------------------------------
Parameters  : value       lower 90%   higher 90%
Photon index: 1.49626     ( -0.559345   0.48539 )
Epeak [keV] : 37.6917      ( -30.7994 11.2019 )
Norm@50keV  : 1.00438E-02    ( -0.00464601   0.0108298 )
------------------------------------------------------------
#Fit statistic  : Chi-Squared                   66.49     using 59 bins.
 Reduced chi-squared =
# Null hypothesis probability of 1.59e-01 with 56 degrees of freedom

Photon flux (15-150 keV)    in 45.26 sec: 0.720517 ( -0.048113  0.048116 ) ph/cm2/s
Energy fluence (15-150 keV)             : 1.89974e-06 ( -1.60578e-07  1.63248e-07 ) ergs/cm2
Band function
Spectral model in the Band function:
------------------------------------------------------------
Parameters  : value       lower 90%   higher 90%
alpha       :    (     )
beta        :     (     )
Epeak [keV] :       (   )
Norm@50keV   :     (     )
------------------------------------------------------------

Photon flux (15-150 keV)    in  sec:  (    ) ph/cm2/s
Energy fluence (15-150 keV)             : 0 ( 0  0 ) ergs/cm2
S(25-50 keV) vs. S(50-100 keV) plot
S(25-50 keV)  = 6.75e-07
S(50-100 keV) = 6.12e-07
T90 vs. Hardness ratio plot
T90                                   = 79.1999999284744 sec.
Hardness ratio (energy fluence ratio) = 0.906667
Color vs. Color plot
Count Ratio  (25-50 keV) / (15-25 keV) = 1.06086
Count Ratio (50-100 keV) / (15-25 keV) = 0.4567
Mask shadow pattern
IMX = 6.158086990259720E-01, IMY = -2.862423554189181E-01
TIME vs. PHA plot around the trigger time
TIME vs. DetID plot around the trigger time
100 us light curve (15-350 keV)
Spacecraft aspect plot
Bright source in the pre-burst/pre-slew/post-slew images
Pre-burst image of 15-350 keV band
Time interval of the image:
-239.184000 -21.744000

# RAcent  DECcent POSerr Theta    Phi  PeakCts   SNR AngSep     Name
#  [deg]    [deg]    ['] [deg]  [deg]                   [']
 83.6337  22.0220    0.6  44.0  -15.4   8.8795  20.7    0.5	Crab
 87.2798  19.2404    2.7  41.4  -10.1   1.5981   4.3 ------	UNKNOWN
Pre-slew background subtracted image of 15-350 keV band
Time interval of the image:
-21.744000 23.516590

# RAcent  DECcent POSerr Theta    Phi  PeakCts   SNR AngSep     Name
#  [deg]    [deg]    ['] [deg]  [deg]                   [']
 83.5217  22.0562   27.7  44.0  -15.5  -0.0666  -0.4    6.7	Crab
104.8832   4.9286    0.5  34.2   24.9   3.7252  25.1 ------	UNKNOWN
 32.0933 -55.5871    2.2  50.5 -161.0   1.0231   5.2 ------	UNKNOWN
 24.8496 -39.2538    2.3  52.2 -139.2   2.2571   5.1 ------	UNKNOWN
Post-slew image of 15-350 keV band
Time interval of the image:
77.116590 483.616600

# RAcent  DECcent POSerr Theta    Phi  PeakCts   SNR AngSep     Name
#  [deg]    [deg]    ['] [deg]  [deg]                   [']
 83.6311  22.0145    0.4  26.7  -59.1  16.6718  28.2    0.1	Crab
143.6054  -8.3299    3.7  40.8   98.0   4.9131   3.1 ------	UNKNOWN
145.2109   9.1288    6.7  40.2   70.9   3.1567   1.7 ------	UNKNOWN
122.1410 -41.3478    2.9  48.9  152.0   5.5198   4.0 ------	UNKNOWN
110.4368 -45.7212    3.3  50.9  164.2   5.2659   3.5 ------	UNKNOWN
 81.0799 -40.1381    4.0  50.1 -167.1   3.1660   2.9 ------	UNKNOWN
 84.4844  22.9084    2.8  26.7  -56.5   2.2305   4.1 ------	UNKNOWN
 66.1696 -40.3651    3.0  57.6 -156.4   8.7421   3.8 ------	UNKNOWN
Plot creation:
Sat Jul 30 07:04:20 EDT 2022