Estimated redshift from machine learning (Ukwatta et al. 2016) - may take a few minute to calcaulte
Image
Pre-slew 15.0-350.0 keV image (Event data)
#   RAcent    DECcent   POSerr    Theta     Phi              Peak Cts       SNR   Name
   21.0795    42.1028   0.0186    27.3287  -104.1974         1.2080288     10.350 TRIG_01044678

Foreground time interval of the image:
-34.408   7.592 (delta_t =  42.000 [sec])
Background time interval of the image:
-239.408 -34.408 (delta_t = 205.000 [sec])
Lightcurves
Notes:
- 1) The mask-weighted light curves are using the flight position.
- 2) Multiple plots of different time binning/intervals are shown to cover all scenarios of short/long GRBs, rate/image triggers, and real/false positives.
- 3) For all the mask-weighted lightcurves, the y-axis units are counts/sec/det where a det is 0.4 x 0.4 = 0.16 sq cm.
- 4) The verticle lines correspond to following: green dotted lines are T50 interval, black dotted lines are T90 interval, blue solid line(s) is a spacecraft slew start time, and orange solid line(s) is a spacecraft slew end time.
- 5) Time of each bin is in the middle of the bin.
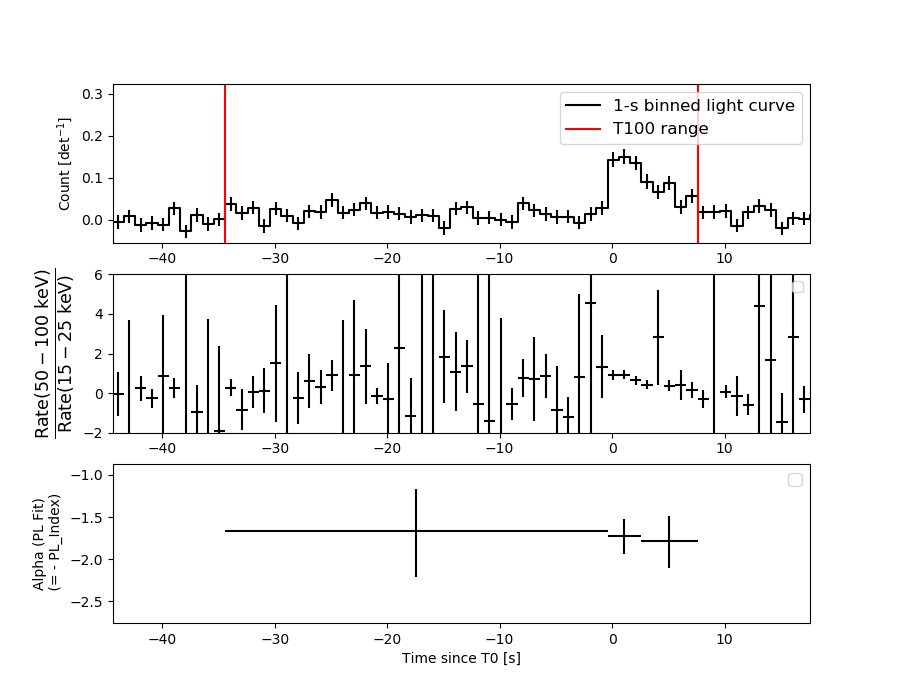
1 s binning
From T0-310 s to T0+310 s
From T100_start - 20 s to T100_end + 30 s
Full time interval
64 ms binning
Full time interval
From T100_start to T100_end
From T0-5 sec to T0+5 sec
16 ms binning
From T100_start-5 s to T100_start+5 s
8 ms binning
From T100_start-3 s to T100_start+3 s
2 ms binning
From T100_start-1 s to T100_start+1 s
SN=5 or 10 sec. binning (whichever binning is satisfied first)
SN=5 or 10 sec. binning (T < 200 sec)
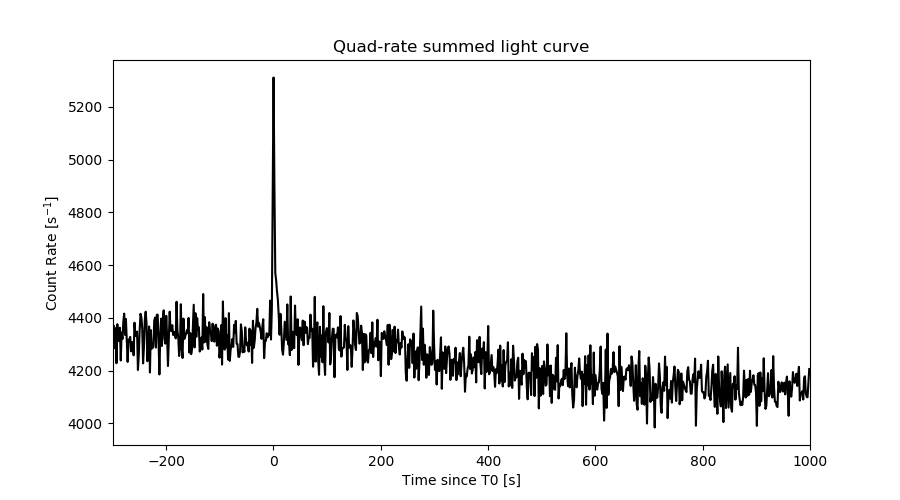
Quad-rate summed light curves (from T0-300s to T0+1000s)
Spectral Evolution
Spectra
Notes:
- 1) The fitting includes the systematic errors.
- 2) When the burst includes telescope slew time periods, the fitting uses an average response file made from multiple 5-s response files through out the slew time plus single time preiod for the non-slew times, and weighted by the total counts in the corresponding time period using addrmf. An average response file is needed becuase a spectral fit using the pre-slew DRM will introduce some errors in both a spectral shape and a normalization if the PHA file contains a lot of the slew/post-slew time interval.
- 3) For fits to more complicated models (e.g. a power-law over a cutoff power-law), the BAT team has decided to require a chi-square improvement of more than 6 for each extra dof.
Time averaged spectrum fit using the average DRM
Power-law model
Time interval is from  -34.408 sec. to    7.592 sec.

Spectral model in power-law:
------------------------------------------------------------
Parameters  : value       lower 90%   higher 90%
Photon index: 1.73567     ( -0.222609   0.233251 )
Norm@50keV  : 1.85101E-03    ( -0.000279706   0.000274257 )
------------------------------------------------------------
#Fit statistic  : Chi-Squared                   53.32     using 59 bins.
 Reduced chi-squared = 0.935439
# Null hypothesis probability of 6.14e-01 with 57 degrees of freedom

Photon flux (15-150 keV)    in 42 sec: 0.248989 ( -0.032752  0.032762 ) ph/cm2/s
Energy fluence (15-150 keV)             : 7.18091e-07 ( -1.11286e-07  1.13672e-07 ) ergs/cm2
Cutoff power-law model

Time interval is from  -34.408 sec. to    7.592 sec.
Spectral model in the cutoff power-law:
------------------------------------------------------------
Parameters  : value       lower 90%   higher 90%
Photon index: 0.726749     ( -1.13377   0.913906 )
Epeak [keV] : 57.3002      ( -13.6941 93.5556 )
Norm@50keV  : 6.56178E-03    ( -0.00656158   0.0199127 )
------------------------------------------------------------
#Fit statistic  : Chi-Squared                   49.68     using 59 bins.
 Reduced chi-squared = 0.887143
# Null hypothesis probability of 7.11e-01 with 56 degrees of freedom

Photon flux (15-150 keV)    in 42 sec: 0.240547 ( -0.033525  0.03357 ) ph/cm2/s
Energy fluence (15-150 keV)             : 6.63512e-07 ( -1.13655e-07  1.21144e-07 ) ergs/cm2
Band function

Time interval is from  -34.408 sec. to    7.592 sec.


Spectral model in the Band function:
------------------------------------------------------------
Parameters  : value       lower 90%   higher 90%
alpha       :    (     )
beta        :     (     )
Epeak [keV] :       (   )
Norm@50keV   :     (     )
------------------------------------------------------------

Photon flux (15-150 keV)    in  sec:  (    ) ph/cm2/s
Energy fluence (15-150 keV)             : 0 ( 0  0 ) ergs/cm2
Single BB
Spectral model blackbody:
------------------------------------------------------------
Parameters  : value    Lower 90%  Upper 90%
kT [keV]    : 12.6367  (-1.83927  2.13237)
R^2/D10^2   : 5.15548E-02  (-0.0223555   0.0397201)
(R is the radius in km and D10 is the distance to the source in units of 10 kpc)
------------------------------------------------------------
#Fit statistic  : Chi-Squared                   58.06     using 59 bins.
 Reduced chi-squared =
# Null hypothesis probability of 4.36e-01 with 57 degrees of freedom

Energy  Fluence     90% Error
[keV]   [erg/cm2]   [erg/cm2]
15- 25  7.333e-08   1.945e-08
25- 50  2.448e-07   4.452e-08
50-150  2.430e-07   7.134e-08
15-150  5.612e-07   1.046e-07
Thermal bremsstrahlung (OTTB)

Spectral model: thermal bremsstrahlung
------------------------------------------------------------
Parameters  : value         Lower 90%    Upper 90%
kT [keV]    : 106.317       (-39.0107      -106.958)
Norm        : 1.09936       (-0.175781     0.211906)
------------------------------------------------------------
#Fit statistic  : Chi-Squared                   50.67     using 59 bins.
 Reduced chi-squared =
# Null hypothesis probability of 7.10e-01 with 57 degrees of freedom

Energy  Fluence     90% Error
[keV]   [erg/cm2]   [erg/cm2]
15- 25  1.206e-07   2.411e-08
25- 50  2.111e-07   3.824e-08
50-150  3.540e-07   1.799e-07
15-150  6.857e-07   2.329e-07
Double BB
Spectral model: bbodyrad<1> + bbodyrad<2>
------------------------------------------------------------
Parameters  : value         Lower 90%    Upper 90%
kT1 [keV]   : 4.71000        (-1.88574      2.92961)
R1^2/D10^2  : 0.990000        (-0.816342      4.14814)
kT2 [keV]   : 16.7482        (-3.41924      6.10232)
R2^2/D10^2  : 1.55537E-02    (-0.0113501   0.0229548)
------------------------------------------------------------
#Fit statistic  : Chi-Squared                   48.07     using 59 bins.
 Reduced chi-squared =
# Null hypothesis probability of 7.35e-01 with 55 degrees of freedom

Energy  Fluence     90% Error
[keV]   [erg/cm2]   [erg/cm2]
15- 25  1.166e-07   6.680e-08
25- 50  2.083e-07   1.090e-07
50-150  3.278e-07   1.869e-07
15-150  6.526e-07   3.102e-07
Peak spectrum fit
Power-law model
Time interval is from    0.592 sec. to    1.592 sec.

Spectral model in power-law:
------------------------------------------------------------
Parameters  : value       lower 90%   higher 90%
Photon index: 1.59729     ( -0.328147   0.348497 )
Norm@50keV  : 1.01119E-02    ( -0.00202496   0.00196787 )
------------------------------------------------------------
#Fit statistic  : Chi-Squared                   48.76     using 59 bins.
 Reduced chi-squared = 0.855439
# Null hypothesis probability of 7.73e-01 with 57 degrees of freedom

Photon flux (15-150 keV)    in 1 sec: 1.29837 ( -0.24037  0.24083 ) ph/cm2/s
Energy fluence (15-150 keV)             : 9.46106e-08 ( -2.01528e-08  2.04482e-08 ) ergs/cm2
Cutoff power-law model
Time interval is from    0.592 sec. to    1.592 sec.
Spectral model in the cutoff power-law:
------------------------------------------------------------
Parameters  : value       lower 90%   higher 90%
Photon index: 1.59524     ( -1.24772   2.68721 )
Epeak [keV] : 1.00000E+04      ( -10000 -10000 )
Norm@50keV  : 1.01366E-02    ( -0.00204126   -0.0101368 )
------------------------------------------------------------
#Fit statistic  : Chi-Squared                   48.77     using 59 bins.
 Reduced chi-squared = 0.870893
# Null hypothesis probability of 7.43e-01 with 56 degrees of freedom

Photon flux (15-150 keV)    in 1 sec: 1.30191 (    ) ph/cm2/s
Energy fluence (15-150 keV)             : 9.48702e-08 ( -2.13037e-08  2.14138e-08 ) ergs/cm2
Band function

Time interval is from    0.592 sec. to    1.592 sec.


Spectral model in the Band function:
------------------------------------------------------------
Parameters  : value       lower 90%   higher 90%
alpha       :    (     )
beta        :     (     )
Epeak [keV] :       (   )
Norm@50keV   :     (     )
------------------------------------------------------------

Photon flux (15-150 keV)    in  sec:  (    ) ph/cm2/s
Energy fluence (15-150 keV)             : 0 ( 0  0 ) ergs/cm2
Single BB
Spectral model blackbody:
------------------------------------------------------------
Parameters  : value    Lower 90%  Upper 90%
kT [keV]    : 15.2908  (-3.15566  4.09458)
R^2/D10^2   : 0.136017  (-0.0771034   0.16885)
(R is the radius in km and D10 is the distance to the source in units of 10 kpc)
------------------------------------------------------------
#Fit statistic  : Chi-Squared                   57.70     using 59 bins.
 Reduced chi-squared =
# Null hypothesis probability of 4.49e-01 with 57 degrees of freedom

Energy  Fluence     90% Error
[keV]   [erg/cm2]   [erg/cm2]
15- 25  6.636e-09   2.670e-09
25- 50  2.683e-08   9.280e-09
50-150  4.306e-08   1.794e-08
15-150  7.653e-08   2.483e-08
Thermal bremsstrahlung (OTTB)
Spectral model: thermal bremsstrahlung
------------------------------------------------------------
Parameters  : value         Lower 90%    Upper 90%
kT [keV]    : 198.906       (-115.342      -198.906)
Norm        : 5.26229       (-0.965149     1.19682)
------------------------------------------------------------
#Fit statistic  : Chi-Squared                   49.16     using 59 bins.
 Reduced chi-squared =
# Null hypothesis probability of 7.60e-01 with 57 degrees of freedom

Energy  Fluence     90% Error
[keV]   [erg/cm2]   [erg/cm2]
15- 25  1.311e-08   7.635e-09
25- 50  2.521e-08   1.415e-08
50-150  5.524e-08   3.206e-08
15-150  9.356e-08   5.320e-08
Double BB
Spectral model: bbodyrad<1> + bbodyrad<2>
------------------------------------------------------------
Parameters  : value         Lower 90%    Upper 90%
kT1 [keV]   : 3.27902        (-1.42214      2.08007)
R1^2/D10^2  : 36.6029        (-33.2667      208.653)
kT2 [keV]   : 19.5705        (-4.65139      7.98003)
R2^2/D10^2  : 5.14283E-02    (-0.0358599   0.064666)
------------------------------------------------------------
#Fit statistic  : Chi-Squared                   46.40     using 59 bins.
 Reduced chi-squared =
# Null hypothesis probability of 7.89e-01 with 55 degrees of freedom

Energy  Fluence     90% Error
[keV]   [erg/cm2]   [erg/cm2]
15- 25  1.548e-08   7.737e-09
25- 50  2.109e-08   9.847e-09
50-150  5.321e-08   3.184e-08
15-150  8.977e-08   4.475e-08
Pre-slew spectrum (Pre-slew PHA with pre-slew DRM)
Power-law model

Spectral model in power-law:
------------------------------------------------------------
Parameters  : value       lower 90%   higher 90%
Photon index: 1.73567     ( -0.222609   0.233251 )
Norm@50keV  : 1.85101E-03    ( -0.000279706   0.000274257 )
------------------------------------------------------------
#Fit statistic  : Chi-Squared                   53.32     using 59 bins.
 Reduced chi-squared =
# Null hypothesis probability of 6.14e-01 with 57 degrees of freedom

Photon flux (15-150 keV)    in 42 sec: 0.248978 ( -0.0327504  0.0327597 ) ph/cm2/s
Energy fluence (15-150 keV)             : 7.17982e-07 ( -1.11218e-07  1.13725e-07 ) ergs/cm2
Cutoff power-law model
Spectral model in the cutoff power-law:
------------------------------------------------------------
Parameters  : value       lower 90%   higher 90%
Photon index: 0.726598     ( -1.13382   0.913856 )
Epeak [keV] : 57.2918      ( -13.6939 93.565 )
Norm@50keV  : 6.56359E-03    ( -0.00656157   0.0199127 )
------------------------------------------------------------
#Fit statistic  : Chi-Squared                   49.68     using 59 bins.
 Reduced chi-squared =
# Null hypothesis probability of 7.11e-01 with 56 degrees of freedom

Photon flux (15-150 keV)    in 42 sec: 0.240516 ( -0.033514  0.033557 ) ph/cm2/s
Energy fluence (15-150 keV)             : 6.63718e-07 ( -1.13711e-07  1.21309e-07 ) ergs/cm2
Band function
Spectral model in the Band function:
------------------------------------------------------------
Parameters  : value       lower 90%   higher 90%
alpha       :    (     )
beta        :     (     )
Epeak [keV] :       (   )
Norm@50keV   :     (     )
------------------------------------------------------------

Photon flux (15-150 keV)    in  sec:  (    ) ph/cm2/s
Energy fluence (15-150 keV)             : 0 ( 0  0 ) ergs/cm2
S(25-50 keV) vs. S(50-100 keV) plot
S(25-50 keV)  = 1.97e-07
S(50-100 keV) = 2.37e-07
T90 vs. Hardness ratio plot
T90                                   = 39 sec.
Hardness ratio (energy fluence ratio) = 1.20305
Color vs. Color plot
Count Ratio  (25-50 keV) / (15-25 keV) = 1.25799
Count Ratio (50-100 keV) / (15-25 keV) = 0.906446
Mask shadow pattern
IMX = -1.267459649226316E-01, IMY = 5.009892620903551E-01
TIME vs. PHA plot around the trigger time
TIME vs. DetID plot around the trigger time
100 us light curve (15-350 keV)
Spacecraft aspect plot
Bright source in the pre-burst/pre-slew/post-slew images
Pre-burst image of 15-350 keV band
Time interval of the image:
-239.408000 -34.408000

# RAcent  DECcent POSerr Theta    Phi  PeakCts   SNR AngSep     Name
#  [deg]    [deg]    ['] [deg]  [deg]                   [']
299.7420  35.1902   19.9  40.2   28.6  -0.2553  -0.6    7.5	Cyg X-1
308.2051  40.9983    2.9  31.6   25.1   1.3609   4.1    5.1	Cyg X-3
326.1205  38.3857    3.3  26.8   -2.2   0.8425   3.5    4.5	Cyg X-2
215.7474  74.3911    2.2  40.8  118.7   4.1356   5.2 ------	UNKNOWN
294.6469  33.5396    3.5  43.9   32.5   1.5264   3.3 ------	UNKNOWN
303.8047  15.6409    3.4  55.6   11.5   3.8802   3.4 ------	UNKNOWN
356.1278  78.7302    3.5  17.6  141.2   0.8119   3.3 ------	UNKNOWN
Pre-slew background subtracted image of 15-350 keV band
Time interval of the image:
-34.408000 7.592000

# RAcent  DECcent POSerr Theta    Phi  PeakCts   SNR AngSep     Name
#  [deg]    [deg]    ['] [deg]  [deg]                   [']
299.6877  35.2013    5.2  40.2   28.7   0.3481   2.2    4.8	Cyg X-1
308.1021  40.8588    5.9  31.7   25.0  -0.2372  -1.9    5.6	Cyg X-3
326.2012  38.3237   10.6  26.8   -2.4  -0.1020  -1.1    1.4	Cyg X-2
311.5036  21.7433    2.4  47.0    6.1   0.8270   4.9 ------	UNKNOWN
330.9860  44.4235    2.3  19.8   -4.2   0.4186   4.9 ------	UNKNOWN
 21.0795  42.1029    1.1  27.3 -104.2   1.2082  10.4 ------	UNKNOWN
 61.8460  35.7238    2.2  51.4 -139.3   1.8631   5.1 ------	UNKNOWN
Post-slew image of 15-350 keV band
Time interval of the image:
374.492590 622.292590

# RAcent  DECcent POSerr Theta    Phi  PeakCts   SNR AngSep     Name
#  [deg]    [deg]    ['] [deg]  [deg]                   [']
299.7159  35.1139    5.2  50.2   21.5   1.9980   2.2    8.1	Cyg X-1
308.0420  40.9751    3.3  41.7   18.7   1.5967   3.5    3.4	Cyg X-3
326.1566  38.3111    5.9  36.0   -2.2   0.7439   1.9    1.0	Cyg X-2
222.1636  74.0436    3.2  40.9   98.0   3.6679   3.6 ------	UNKNOWN
116.6790  54.4124    3.6  49.4  158.2   2.6599   3.2 ------	UNKNOWN
301.0727  29.7824    2.8  54.2   16.7   4.9604   4.1 ------	UNKNOWN
319.6897  22.0589    2.7  53.0   -6.2   2.7523   4.3 ------	UNKNOWN
 81.7084  27.5632    3.5  57.6 -156.4   4.8994   3.3 ------	UNKNOWN
350.3753  14.6755    2.6  50.6  -44.5   5.4139   4.5 ------	UNKNOWN
Plot creation:
Sat Jul 30 07:03:48 EDT 2022