Estimated redshift from machine learning (Ukwatta et al. 2016) - may take a few minutes to calcaulte
Image
Pre-slew 15-350 keV image (Event data; bkg subtracted)

#   RAcent  DECcent POSerr  Theta    Phi     Peak Cts     SNR  Name
  263.1146 +54.0629 0.0455    6.2   35.4       0.0980     4.2  TRIG_01045571
------------------------------------------

Foreground time interval of the image:
  0.000   1.024 (delta_t =   1.024 [sec])
Background time interval of the image:
-60.624 -10.624 (delta_t =  50.000 [sec])
Lightcurves
Notes:
- 1) All plots contain as much data as has been downloaded to date.
- 2) The mask-weighted light curves are using the flight position.
- 3) Multiple plots of different time binning/intervals are shown to cover all scenarios of short/long GRBs, rate/image triggers, and real/false positives.
- 4) For all the mask-weighted lightcurves, the y-axis units are counts/sec/det where a det is 0.4 x 0.4 = 0.16 sq cm.
- 5) The verticle lines correspond to following: green dotted lines are T50 interval, black dotted lines are T90 interval, blue solid line(s) is a spacecraft slew start time, and orange solid line(s) is a spacecraft slew end time.
- 6) Time of each bin is in the middle of the bin.
1 s binning
From T0-310 s to T0+310 s

From T100_start - 20 s to T100_end + 30 s

Full time interval

64 ms binning
Full time interval

From T100_start to T100_end

From T0-5 sec to T0+5 sec

16 ms binning
From T100_start-5 s to T100_start+5 s

8 ms binning
From T100_start-3 s to T100_start+3 s

2 ms binning
From T100_start-1 s to T100_start+1 s

SN=5 or 10 sec. binning (whichever binning is satisfied first)

SN=5 or 10 sec. binning (T < 200 sec)

Spectra
Notes:
- 1) The fitting includes the systematic errors.
- 2) For long bursts, a spectral fit of the pre-slew DRM will introduce some errors in both a spectral shape and a normalization if the PHA file contains a lot of the slew/post-slew time interval.
- 3) For fits to more complicated models (e.g. a power-law over a cutoff power-law), the BAT team has decided to require a chi-square improvement of more than 6 for each extra dof.
- 4) For short bursts (T90<1sec), the specrtum is also fit with Blackbody, OTTB, and Double Blackbody.
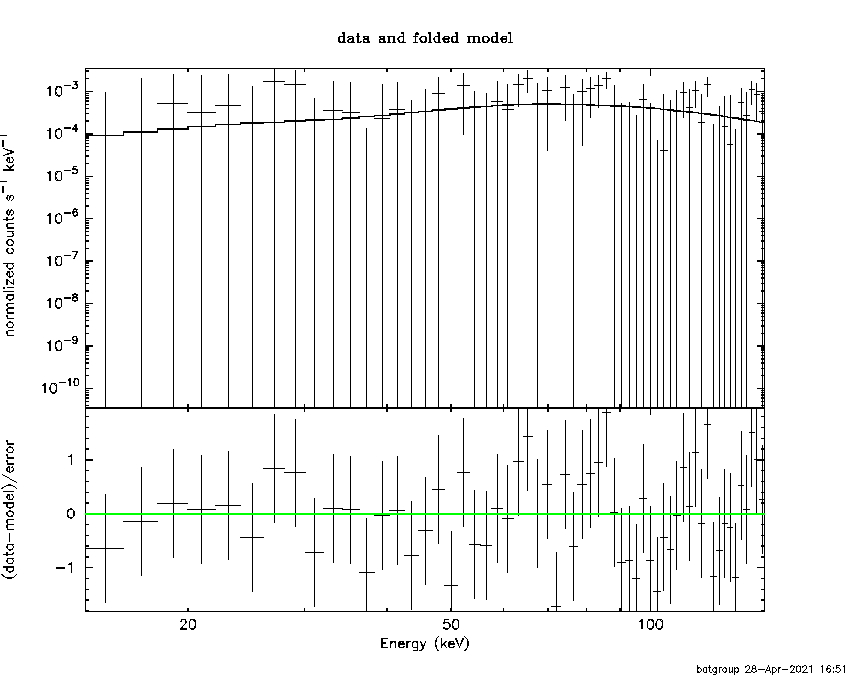
Time averaged spectrum fit using the pre-slew DRM
Power-law model

Time interval is from    0.000 sec. to    1.024 sec.

Spectral model in power-law:
------------------------------------------------------------
Parameters  : value       lower 90%   higher 90%
Photon index: -1.07802     ( -1.38034   1.55997 )
Norm@50keV  : 1.36725E-03    ( -0.00136725   0.00253814 )
------------------------------------------------------------
#Fit statistic  : Chi-Squared                   38.23     using 59 bins.
 Reduced chi-squared =
# Null hypothesis probability of 9.74e-01 with 57 degrees of freedom

Photon flux (15-150 keV)    in 1.024 sec: 0.319884 ( -0.319884  0.218638 ) ph/cm2/s
Energy fluence (15-150 keV)             : 5.35432e-08 ( -5.35431e-08  2.98168e-08 ) ergs/cm2
Cutoff power-law model

Time interval is from    0.000 sec. to    1.024 sec.
Spectral model in the cutoff power-law:
------------------------------------------------------------
Parameters  : value       lower 90%   higher 90%
Photon index: -1.10407     ( 1.32756   1.80426 )
Epeak [keV] : 1.00000E+04      ( -10000 -10000 )
Norm@50keV  : 1.41078E-03    ( -0.0014108   -0.0014108 )
------------------------------------------------------------
#Fit statistic  : Chi-Squared                   38.22     using 59 bins.
 Reduced chi-squared =
# Null hypothesis probability of 9.67e-01 with 56 degrees of freedom

Photon flux (15-150 keV)    in 1.024 sec: 0.329149 ( -0.329149  0.209178 ) ph/cm2/s
Energy fluence (15-150 keV)             : 5.43927e-08 ( -5.43927e-08  3.15853e-08 ) ergs/cm2
Band function

Time interval is from    0.000 sec. to    1.024 sec.
XSPEC12>exit
 XSPEC: quit


Spectral model in the Band function:
------------------------------------------------------------
Parameters  : value       lower 90%   higher 90%
alpha       : 0.501525   ( -0.50546   -0.50546 )
beta        : 1.07808    ( -1.07804   1.37986 )
Epeak [keV] : 19.1825      ( -19.1961 -19.1961 )
Norm@50keV   : 2.59427E-03    ( -0.0025958   510.446 )
------------------------------------------------------------

Photon flux (15-150 keV)    in 1.024 sec:  (    ) ph/cm2/s
Energy fluence (15-150 keV)             : 0 ( 0  0 ) ergs/cm2
Single BB

Spectral model blackbody:
------------------------------------------------------------
Parameters  : value    Lower 90%  Upper 90%
kT [keV]    : 199.363  (-199.363  -199.363)
R^2/D10^2   : 1.93791E-04  (-0.000104782   0.00462782)
(R is the radius in km and D10 is the distance to the source in units of 10 kpc)
------------------------------------------------------------
#Fit statistic  : Chi-Squared                   38.32     using 59 bins.
 Reduced chi-squared =
# Null hypothesis probability of 9.73e-01 with 57 degrees of freedom

Energy  Fluence     90% Error
[keV]   [erg/cm2]   [erg/cm2]
15- 25  2.540e-10   1.119e-10
25- 50  2.158e-09   7.880e-10
50-150  5.254e-08   2.175e-08
15-150  5.495e-08   2.714e-08
Thermal bremsstrahlung (OTTB)

Spectral model: thermal bremsstrahlung
------------------------------------------------------------
Parameters  : value         Lower 90%    Upper 90%
kT [keV]    : 7.00000       (-7      -7)
Norm        : 0.0       (0     0)
------------------------------------------------------------
#Fit statistic  : Chi-Squared                   47.57     using 59 bins.
 Reduced chi-squared =
# Null hypothesis probability of 8.09e-01 with 57 degrees of freedom

Energy  Fluence     90% Error
[keV]   [erg/cm2]   [erg/cm2]
15- 25  0.000e+00   0.000e+00
25- 50  0.000e+00   0.000e+00
50-150  0.000e+00   0.000e+00
15-150  0.000e+00   0.000e+00
Double BB

Spectral model: bbodyrad<1> + bbodyrad<2>
------------------------------------------------------------
Parameters  : value         Lower 90%    Upper 90%
kT1 [keV]   : 8.79677        (-2.39338      -2.39338)
R1^2/D10^2  : 7.91082E-06        (-1.52385e-09      -1.52385e-09)
kT2 [keV]   : 199.333        (-199.344      -199.344)
R2^2/D10^2  : 1.94978E-04    (-0.000104781   0.00463182)
------------------------------------------------------------
#Fit statistic  : Chi-Squared                   38.32     using 59 bins.
 Reduced chi-squared =
# Null hypothesis probability of 9.57e-01 with 55 degrees of freedom

Energy  Fluence     90% Error
[keV]   [erg/cm2]   [erg/cm2]
15- 25  2.556e-10   3.324e-09
25- 50  2.171e-09   3.979e-08
50-150  5.285e-08   1.179e-06
15-150  5.528e-08   8.494e-07
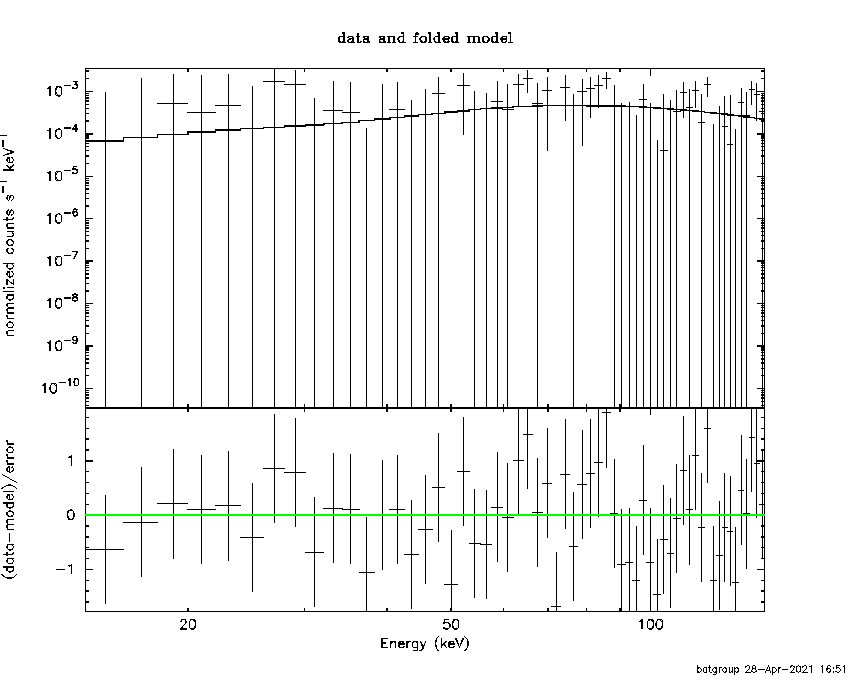
Peak spectrum fit
Power-law model

Time interval is from    0.000 sec. to    1.024 sec.

Spectral model in power-law:
------------------------------------------------------------
Parameters  : value       lower 90%   higher 90%
Photon index: -1.07802     ( -1.38034   1.55997 )
Norm@50keV  : 1.36725E-03    ( -0.00136725   0.00253814 )
------------------------------------------------------------
#Fit statistic  : Chi-Squared                   38.23     using 59 bins.
 Reduced chi-squared =
# Null hypothesis probability of 9.74e-01 with 57 degrees of freedom

Photon flux (15-150 keV)    in 1.024 sec: 0.319884 ( -0.319884  0.218638 ) ph/cm2/s
Energy fluence (15-150 keV)             : 5.35432e-08 ( -5.35431e-08  2.98168e-08 ) ergs/cm2
Cutoff power-law model

Time interval is from    0.000 sec. to    1.024 sec.
Spectral model in the cutoff power-law:
------------------------------------------------------------
Parameters  : value       lower 90%   higher 90%
Photon index: -1.10407     ( 1.32756   1.80426 )
Epeak [keV] : 1.00000E+04      ( -10000 -10000 )
Norm@50keV  : 1.41078E-03    ( -0.0014108   -0.0014108 )
------------------------------------------------------------
#Fit statistic  : Chi-Squared                   38.22     using 59 bins.
 Reduced chi-squared =
# Null hypothesis probability of 9.67e-01 with 56 degrees of freedom

Photon flux (15-150 keV)    in 1.024 sec: 0.329149 ( -0.329149  0.209178 ) ph/cm2/s
Energy fluence (15-150 keV)             : 5.43927e-08 ( -5.43927e-08  3.15853e-08 ) ergs/cm2
Band function

Time interval is from    0.000 sec. to    1.024 sec.
XSPEC12>exit
 XSPEC: quit


Spectral model in the Band function:
------------------------------------------------------------
Parameters  : value       lower 90%   higher 90%
alpha       : 0.501525   ( -0.50546   -0.50546 )
beta        : 1.07808    ( -1.07804   1.37986 )
Epeak [keV] : 19.1825      ( -19.1961 -19.1961 )
Norm@50keV   : 2.59427E-03    ( -0.0025958   510.446 )
------------------------------------------------------------

Photon flux (15-150 keV)    in 1.024 sec:  (    ) ph/cm2/s
Energy fluence (15-150 keV)             : 0 ( 0  0 ) ergs/cm2
Single BB

Spectral model blackbody:
------------------------------------------------------------
Parameters  : value    Lower 90%  Upper 90%
kT [keV]    : 199.363  (-199.363  -199.363)
R^2/D10^2   : 1.93791E-04  (-0.000104782   0.00462782)
(R is the radius in km and D10 is the distance to the source in units of 10 kpc)
------------------------------------------------------------
#Fit statistic  : Chi-Squared                   38.32     using 59 bins.
 Reduced chi-squared =
# Null hypothesis probability of 9.73e-01 with 57 degrees of freedom

Energy  Fluence     90% Error
[keV]   [erg/cm2]   [erg/cm2]
15- 25  2.540e-10   8.617e-11
25- 50  2.158e-09   9.334e-10
50-150  5.254e-08   2.093e-08
15-150  5.495e-08   2.685e-08
Thermal bremsstrahlung (OTTB)

Spectral model: thermal bremsstrahlung
------------------------------------------------------------
Parameters  : value         Lower 90%    Upper 90%
kT [keV]    : 7.00000       (-7      -7)
Norm        : 0.0       (0     0)
------------------------------------------------------------
#Fit statistic  : Chi-Squared                   47.57     using 59 bins.
 Reduced chi-squared =
# Null hypothesis probability of 8.09e-01 with 57 degrees of freedom

Energy  Fluence     90% Error
[keV]   [erg/cm2]   [erg/cm2]
15- 25  0.000e+00   0.000e+00
25- 50  0.000e+00   0.000e+00
50-150  0.000e+00   0.000e+00
15-150  0.000e+00   0.000e+00
Double BB
Spectral model: bbodyrad<1> + bbodyrad<2>
------------------------------------------------------------
Parameters  : value         Lower 90%    Upper 90%
kT1 [keV]   : 8.79677        (-2.39338      -2.39338)
R1^2/D10^2  : 7.91082E-06        (-1.52385e-09      -1.52385e-09)
kT2 [keV]   : 199.333        (-199.344      -199.344)
R2^2/D10^2  : 1.94978E-04    (-0.000104781   0.00463182)
------------------------------------------------------------
#Fit statistic  : Chi-Squared                   38.32     using 59 bins.
 Reduced chi-squared =
# Null hypothesis probability of 9.57e-01 with 55 degrees of freedom

Energy  Fluence     90% Error
[keV]   [erg/cm2]   [erg/cm2]
15- 25  2.556e-10   3.838e-09
25- 50  2.171e-09   3.501e-08
50-150  5.285e-08   7.803e-07
15-150  5.528e-08   1.422e-06
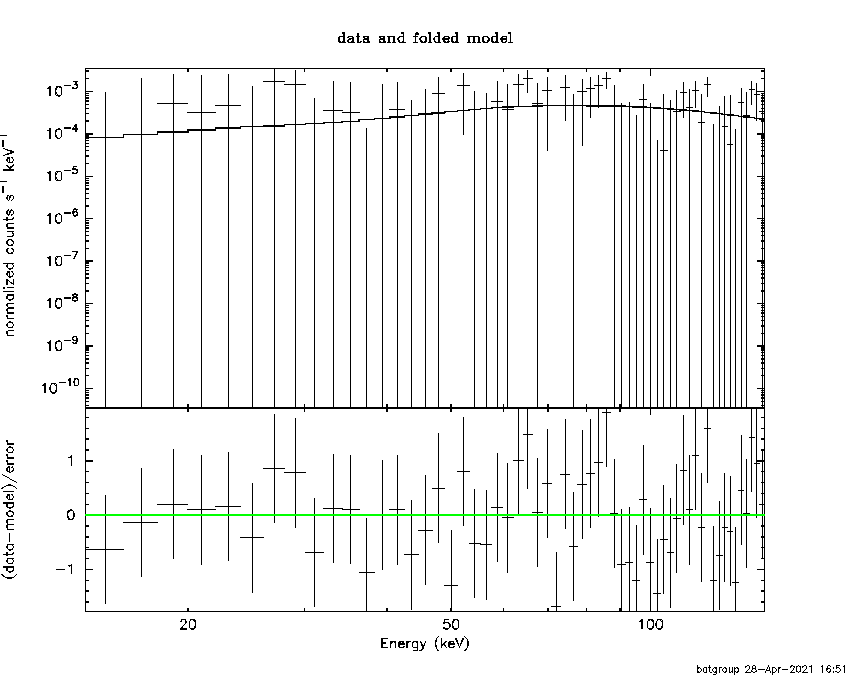
Pre-slew spectrum (Pre-slew PHA with pre-slew DRM)
Power-law model

Spectral model in power-law:
------------------------------------------------------------
Parameters  : value       lower 90%   higher 90%
Photon index: -1.07802     ( -1.38034   1.55997 )
Norm@50keV  : 1.36725E-03    ( -0.00136725   0.00253814 )
------------------------------------------------------------
#Fit statistic  : Chi-Squared                   38.23     using 59 bins.
 Reduced chi-squared =
# Null hypothesis probability of 9.74e-01 with 57 degrees of freedom

Photon flux (15-150 keV)    in 1.024 sec: 0.319884 ( -0.319884  0.218638 ) ph/cm2/s
Energy fluence (15-150 keV)             : 5.35432e-08 ( -5.35431e-08  2.98168e-08 ) ergs/cm2
Cutoff power-law model
Spectral model in the cutoff power-law:
------------------------------------------------------------
Parameters  : value       lower 90%   higher 90%
Photon index: -1.10407     ( 1.32756   1.80342 )
Epeak [keV] : 1.00000E+04      ( -10000 -10000 )
Norm@50keV  : 1.41078E-03    ( -0.0014108   -0.0014108 )
------------------------------------------------------------
#Fit statistic  : Chi-Squared                   38.22     using 59 bins.
 Reduced chi-squared =
# Null hypothesis probability of 9.67e-01 with 56 degrees of freedom

Photon flux (15-150 keV)    in 1.024 sec: 0.329149 ( -0.329149  0.209178 ) ph/cm2/s
Energy fluence (15-150 keV)             : 5.43927e-08 ( -5.43927e-08  3.15853e-08 ) ergs/cm2
Band function
XSPEC12>exit
 XSPEC: quit


Spectral model in the Band function:
------------------------------------------------------------
Parameters  : value       lower 90%   higher 90%
alpha       : 0.501525   ( -0.50546   -0.50546 )
beta        : 1.07808    ( -1.07804   1.37986 )
Epeak [keV] : 19.1825      ( -19.1961 -19.1961 )
Norm@50keV   : 2.59427E-03    ( -0.0025958   510.446 )
------------------------------------------------------------

Photon flux (15-150 keV)    in 1.024 sec:  (    ) ph/cm2/s
Energy fluence (15-150 keV)             : 0 ( 0  0 ) ergs/cm2
S(25-50 keV) vs. S(50-100 keV) plot

S(25-50 keV)  = 1.61e-09
S(50-100 keV) = 1.36e-08
T90 vs. Hardness ratio plot

T90                                   = 1.02400004863739 sec.
Hardness ratio (energy fluence ratio) = 8.4472
Color vs. Color plot

Count Ratio  (25-50 keV) / (15-25 keV) = -4.03433
Count Ratio (50-100 keV) / (15-25 keV) = -115.974
Mask shadow pattern

IMX = 8.793429077259836E-02, IMY = -6.250148028793873E-02
TIME vs. PHA plot around the trigger time

TIME vs. DetID plot around the trigger time

100 us light curve (15-350 keV)

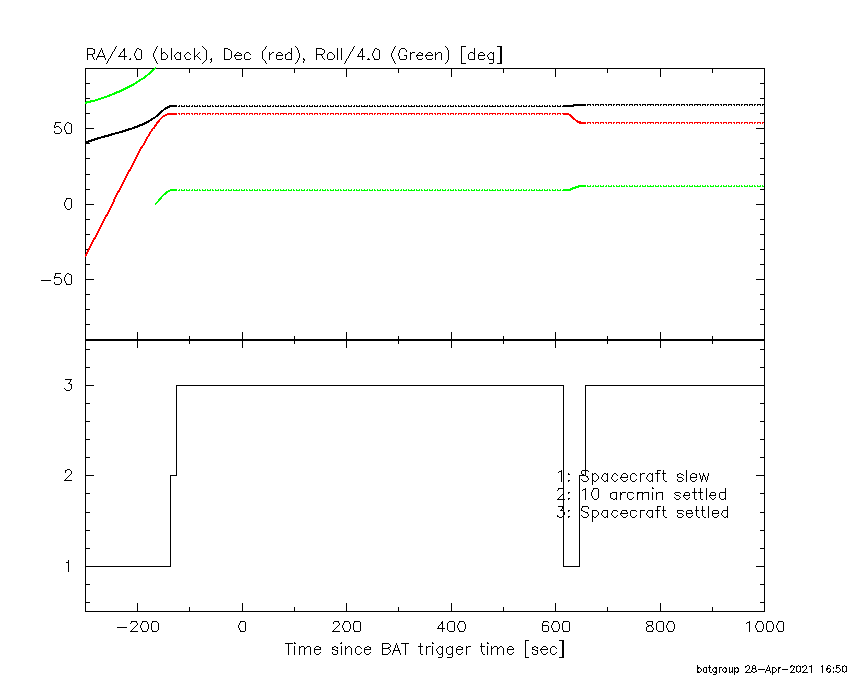
Spacecraft aspect plot
Bright source in the pre-burst/pre-slew/post-slew images
Pre-burst image of 15-350 keV band
Time interval of the image:
-60.624000 -10.624000

# RAcent  DECcent POSerr Theta    Phi  PeakCts   SNR AngSep     Name
#  [deg]    [deg]    ['] [deg]  [deg]                   [']
254.3989  35.5142   22.8  24.7   63.9  -0.1717  -0.5   10.7	Her X-1
288.7191  10.8879   12.3  53.5   17.1   1.0748   0.9    5.8	GRS 1915+105
299.5151  35.1337    5.3  35.5  -10.6   0.7841   2.2    5.5	Cyg X-1
308.1830  40.9749    6.8  35.0  -26.1   0.6087   1.7    3.6	Cyg X-3
326.1971  38.3911   33.4  45.9  -39.9  -0.2456  -0.3    4.3	Cyg X-2
263.7606  13.4985    2.7  46.6   48.0   4.2784   4.2 ------	UNKNOWN
201.4324  36.0922    2.6  43.8  137.2   3.9967   4.4 ------	UNKNOWN
293.8929  10.2792    3.1  55.7   11.4   4.9513   3.7 ------	UNKNOWN
174.7489  54.6241    2.9  43.1  175.5   1.7402   4.0 ------	UNKNOWN
232.5211  71.0284    2.9  15.6 -160.7   1.0721   4.0 ------	UNKNOWN
152.7570  52.7648    3.2  53.1 -173.2   2.4444   3.7 ------	UNKNOWN
128.4000  56.0282    2.7  57.8 -156.5   5.5709   4.2 ------	UNKNOWN
Pre-slew background subtracted image of 15-350 keV band
Time interval of the image:
0.000000 1.024000

# RAcent  DECcent POSerr Theta    Phi  PeakCts   SNR AngSep     Name
#  [deg]    [deg]    ['] [deg]  [deg]                   [']
254.5783  35.4554    5.9  24.8   63.5   0.0576   2.0    9.0	Her X-1
288.9973  10.8835    0.0  53.6   16.8   0.1029   1.1   12.3	GRS 1915+105
299.5698  35.3579    7.2  35.4  -10.9   0.0477   1.6    9.4	Cyg X-1
308.2750  40.8416   12.2  35.1  -26.1  -0.0296  -0.9   10.0	Cyg X-3
326.3562  38.4128    3.5  46.0  -40.1   0.2083   3.3   10.3	Cyg X-2
231.2054  30.6875    2.0  35.0   99.2   0.2755   5.9 ------	UNKNOWN
297.0331  27.1760    2.3  41.4   -1.2   0.1912   5.0 ------	UNKNOWN
Post-slew image of 15-350 keV band
Time interval of the image:
Plot creation:
Wed Apr 28 16:52:12 EDT 2021