Estimated redshift from machine learning (Ukwatta et al. 2016) - may take a few minute to calcaulte
Image
Pre-slew 15.0-350.0 keV image (Event data)
#   RAcent    DECcent   POSerr    Theta     Phi              Peak Cts       SNR   Name
  350.3678     6.6468   0.0102    23.0035  -167.3340         0.8672042     18.747 TRIG_01047531

Foreground time interval of the image:
 -4.688   7.664 (delta_t =  12.352 [sec])
Background time interval of the image:
-239.424  -4.688 (delta_t = 234.736 [sec])
Lightcurves
Notes:
- 1) The mask-weighted light curves are using the flight position.
- 2) Multiple plots of different time binning/intervals are shown to cover all scenarios of short/long GRBs, rate/image triggers, and real/false positives.
- 3) For all the mask-weighted lightcurves, the y-axis units are counts/sec/det where a det is 0.4 x 0.4 = 0.16 sq cm.
- 4) The verticle lines correspond to following: green dotted lines are T50 interval, black dotted lines are T90 interval, blue solid line(s) is a spacecraft slew start time, and orange solid line(s) is a spacecraft slew end time.
- 5) Time of each bin is in the middle of the bin.
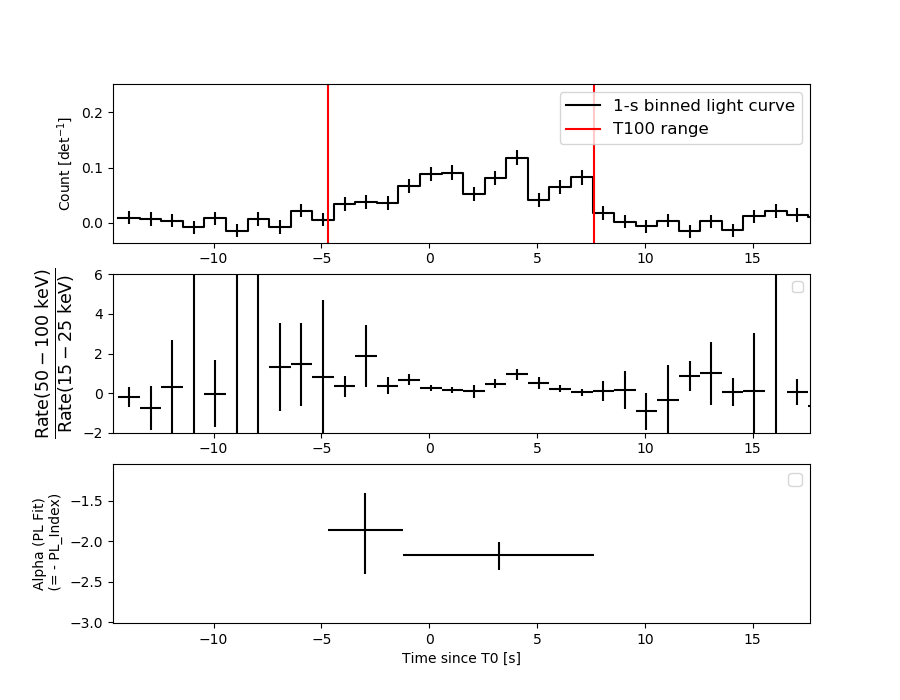
1 s binning
From T0-310 s to T0+310 s
From T100_start - 20 s to T100_end + 30 s
Full time interval
64 ms binning
Full time interval
From T100_start to T100_end
From T0-5 sec to T0+5 sec
16 ms binning
From T100_start-5 s to T100_start+5 s

8 ms binning
From T100_start-3 s to T100_start+3 s
2 ms binning
From T100_start-1 s to T100_start+1 s
SN=5 or 10 sec. binning (whichever binning is satisfied first)
SN=5 or 10 sec. binning (T < 200 sec)
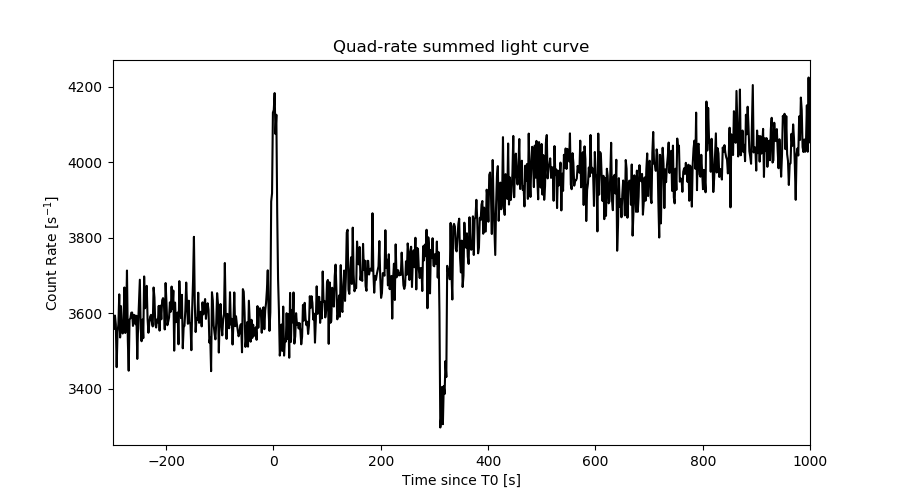
Quad-rate summed light curves (from T0-300s to T0+1000s)
Spectral Evolution
Spectra
Notes:
- 1) The fitting includes the systematic errors.
- 2) When the burst includes telescope slew time periods, the fitting uses an average response file made from multiple 5-s response files through out the slew time plus single time preiod for the non-slew times, and weighted by the total counts in the corresponding time period using addrmf. An average response file is needed becuase a spectral fit using the pre-slew DRM will introduce some errors in both a spectral shape and a normalization if the PHA file contains a lot of the slew/post-slew time interval.
- 3) For fits to more complicated models (e.g. a power-law over a cutoff power-law), the BAT team has decided to require a chi-square improvement of more than 6 for each extra dof.
Time averaged spectrum fit using the average DRM
Power-law model
Time interval is from   -4.688 sec. to    7.664 sec.

Spectral model in power-law:
------------------------------------------------------------
Parameters  : value       lower 90%   higher 90%
Photon index: 2.12031     ( -0.16559   0.174419 )
Norm@50keV  : 3.61394E-03    ( -0.000436793   0.000429941 )
------------------------------------------------------------
#Fit statistic  : Chi-Squared                   57.72     using 59 bins.
 Reduced chi-squared = 1.01263
# Null hypothesis probability of 4.48e-01 with 57 degrees of freedom

Photon flux (15-150 keV)    in 12.35 sec: 0.574385 ( -0.051001  0.051006 ) ph/cm2/s
Energy fluence (15-150 keV)             : 4.15611e-07 ( -4.45826e-08  4.56079e-08 ) ergs/cm2
Cutoff power-law model
Time interval is from   -4.688 sec. to    7.664 sec.
Spectral model in the cutoff power-law:
------------------------------------------------------------
Parameters  : value       lower 90%   higher 90%
Photon index: 0.806357     ( -0.992605   0.824142 )
Epeak [keV] : 35.2855      ( -9.4787 7.05829 )
Norm@50keV  : 2.22484E-02    ( -0.0222484   0.0674802 )
------------------------------------------------------------
#Fit statistic  : Chi-Squared                   49.59     using 59 bins.
 Reduced chi-squared = 0.885536
# Null hypothesis probability of 7.15e-01 with 56 degrees of freedom

Photon flux (15-150 keV)    in 12.35 sec: 0.549856 ( -0.052245  0.05255 ) ph/cm2/s
Energy fluence (15-150 keV)             : 3.67508e-07 ( -4.51507e-08  5.01756e-08 ) ergs/cm2
Band function

Time interval is from   -4.688 sec. to    7.664 sec.


Spectral model in the Band function:
------------------------------------------------------------
Parameters  : value       lower 90%   higher 90%
alpha       :    (     )
beta        :     (     )
Epeak [keV] :       (   )
Norm@50keV   :     (     )
------------------------------------------------------------

Photon flux (15-150 keV)    in  sec:  (    ) ph/cm2/s
Energy fluence (15-150 keV)             : 0 ( 0  0 ) ergs/cm2
Single BB
Spectral model blackbody:
------------------------------------------------------------
Parameters  : value    Lower 90%  Upper 90%
kT [keV]    : 9.17726  (-0.877929  0.966148)
R^2/D10^2   : 0.374564  (-0.121618   0.181)
(R is the radius in km and D10 is the distance to the source in units of 10 kpc)
------------------------------------------------------------
#Fit statistic  : Chi-Squared                   62.22     using 59 bins.
 Reduced chi-squared =
# Null hypothesis probability of 2.96e-01 with 57 degrees of freedom

Energy  Fluence     90% Error
[keV]   [erg/cm2]   [erg/cm2]
15- 25  7.660e-08   1.157e-08
25- 50  1.678e-07   1.748e-08
50-150  6.793e-08   1.933e-08
15-150  3.123e-07   3.637e-08
Thermal bremsstrahlung (OTTB)
Spectral model: thermal bremsstrahlung
------------------------------------------------------------
Parameters  : value         Lower 90%    Upper 90%
kT [keV]    : 51.4920       (-11.0257      16.0561)
Norm        : 3.22598       (-0.452188     0.566655)
------------------------------------------------------------
#Fit statistic  : Chi-Squared                   50.56     using 59 bins.
 Reduced chi-squared =
# Null hypothesis probability of 7.14e-01 with 57 degrees of freedom

Energy  Fluence     90% Error
[keV]   [erg/cm2]   [erg/cm2]
15- 25  9.806e-08   1.184e-08
25- 50  1.423e-07   1.439e-08
50-150  1.420e-07   3.987e-08
15-150  3.824e-07   5.014e-08
Double BB
Spectral model: bbodyrad<1> + bbodyrad<2>
------------------------------------------------------------
Parameters  : value         Lower 90%    Upper 90%
kT1 [keV]   : 5.23024        (-1.66166      1.8666)
R1^2/D10^2  : 1.91464        (-1.18378      6.12175)
kT2 [keV]   : 13.7887        (-2.95597      6.38991)
R2^2/D10^2  : 5.29659E-02    (-0.0443069   0.111697)
------------------------------------------------------------
#Fit statistic  : Chi-Squared                   48.76     using 59 bins.
 Reduced chi-squared =
# Null hypothesis probability of 7.11e-01 with 55 degrees of freedom

Energy  Fluence     90% Error
[keV]   [erg/cm2]   [erg/cm2]
15- 25  9.493e-08   4.656e-08
25- 50  1.464e-07   7.416e-08
50-150  1.222e-07   6.875e-08
15-150  3.635e-07   1.831e-07
Peak spectrum fit
Power-law model
Time interval is from    3.252 sec. to    4.252 sec.

Spectral model in power-law:
------------------------------------------------------------
Parameters  : value       lower 90%   higher 90%
Photon index: 1.82517     ( -0.239395   0.256173 )
Norm@50keV  : 8.39898E-03    ( -0.00151116   0.00148262 )
------------------------------------------------------------
#Fit statistic  : Chi-Squared                   57.62     using 59 bins.
 Reduced chi-squared = 1.01088
# Null hypothesis probability of 4.52e-01 with 57 degrees of freedom

Photon flux (15-150 keV)    in 1 sec: 1.16892 ( -0.178257  0.17828 ) ph/cm2/s
Energy fluence (15-150 keV)             : 7.72681e-08 ( -1.3811e-08  1.41432e-08 ) ergs/cm2
Cutoff power-law model
Time interval is from    3.252 sec. to    4.252 sec.
Spectral model in the cutoff power-law:
------------------------------------------------------------
Parameters  : value       lower 90%   higher 90%
Photon index: -0.206960     ( -1.52084   1.19473 )
Epeak [keV] : 48.2699      ( -8.32959 12.7054 )
Norm@50keV  : 0.111190    ( -0.111818   0.623876 )
------------------------------------------------------------
#Fit statistic  : Chi-Squared                   47.98     using 59 bins.
 Reduced chi-squared = 0.856786
# Null hypothesis probability of 7.68e-01 with 56 degrees of freedom

Photon flux (15-150 keV)    in 1 sec: 1.12059 ( -0.177783  0.17874 ) ph/cm2/s
Energy fluence (15-150 keV)             : 6.95537e-08 ( -1.2595e-08  1.36955e-08 ) ergs/cm2
Band function

Time interval is from    3.252 sec. to    4.252 sec.


Spectral model in the Band function:
------------------------------------------------------------
Parameters  : value       lower 90%   higher 90%
alpha       :    (     )
beta        :     (     )
Epeak [keV] :       (   )
Norm@50keV   :     (     )
------------------------------------------------------------

Photon flux (15-150 keV)    in  sec:  (    ) ph/cm2/s
Energy fluence (15-150 keV)             : 0 ( 0  0 ) ergs/cm2
Single BB
Spectral model blackbody:
------------------------------------------------------------
Parameters  : value    Lower 90%  Upper 90%
kT [keV]    : 12.1233  (-1.72634  1.94521)
R^2/D10^2   : 0.297242  (-0.126313   0.223176)
(R is the radius in km and D10 is the distance to the source in units of 10 kpc)
------------------------------------------------------------
#Fit statistic  : Chi-Squared                   49.93     using 59 bins.
 Reduced chi-squared =
# Null hypothesis probability of 7.35e-01 with 57 degrees of freedom

Energy  Fluence     90% Error
[keV]   [erg/cm2]   [erg/cm2]
15- 25  9.247e-09   2.384e-09
25- 50  2.945e-08   5.930e-09
50-150  2.620e-08   8.480e-09
15-150  6.490e-08   1.316e-08
Thermal bremsstrahlung (OTTB)
Spectral model: thermal bremsstrahlung
------------------------------------------------------------
Parameters  : value         Lower 90%    Upper 90%
kT [keV]    : 84.1564       (-29.4855      62.4774)
Norm        : 5.55397       (-1.00391     1.28986)
------------------------------------------------------------
#Fit statistic  : Chi-Squared                   52.57     using 59 bins.
 Reduced chi-squared =
# Null hypothesis probability of 6.42e-01 with 57 degrees of freedom

Energy  Fluence     90% Error
[keV]   [erg/cm2]   [erg/cm2]
15- 25  1.445e-08   3.040e-09
25- 50  2.408e-08   4.985e-09
50-150  3.515e-08   2.159e-08
15-150  7.368e-08   2.589e-08
Double BB
Spectral model: bbodyrad<1> + bbodyrad<2>
------------------------------------------------------------
Parameters  : value         Lower 90%    Upper 90%
kT1 [keV]   : 4.61198        (-3.16022      4.86834)
R1^2/D10^2  : 3.58239        (-3.3944      2544.02)
kT2 [keV]   : 14.1176        (-2.63538      4.31755)
R2^2/D10^2  : 0.147813    (-0.110682   0.200023)
------------------------------------------------------------
#Fit statistic  : Chi-Squared                   46.52     using 59 bins.
 Reduced chi-squared =
# Null hypothesis probability of 7.85e-01 with 55 degrees of freedom

Energy  Fluence     90% Error
[keV]   [erg/cm2]   [erg/cm2]
15- 25  1.245e-08   6.485e-09
25- 50  2.664e-08   1.411e-08
50-150  3.082e-08   1.894e-08
15-150  6.991e-08   3.721e-08
Pre-slew spectrum (Pre-slew PHA with pre-slew DRM)
Power-law model

Spectral model in power-law:
------------------------------------------------------------
Parameters  : value       lower 90%   higher 90%
Photon index: 2.12031     ( -0.16559   0.174419 )
Norm@50keV  : 3.61394E-03    ( -0.000436793   0.000429941 )
------------------------------------------------------------
#Fit statistic  : Chi-Squared                   57.72     using 59 bins.
 Reduced chi-squared =
# Null hypothesis probability of 4.48e-01 with 57 degrees of freedom

Photon flux (15-150 keV)    in 12.35 sec: 0.574334 ( -0.0509954  0.0510013 ) ph/cm2/s
Energy fluence (15-150 keV)             : 4.15533e-07 ( -4.46382e-08  4.5627e-08 ) ergs/cm2
Cutoff power-law model

Spectral model in the cutoff power-law:
------------------------------------------------------------
Parameters  : value       lower 90%   higher 90%
Photon index: 0.806357     ( -0.992606   0.824142 )
Epeak [keV] : 35.2855      ( -9.4787 7.05829 )
Norm@50keV  : 2.22484E-02    ( -0.0222484   0.0674803 )
------------------------------------------------------------
#Fit statistic  : Chi-Squared                   49.59     using 59 bins.
 Reduced chi-squared =
# Null hypothesis probability of 7.15e-01 with 56 degrees of freedom

Photon flux (15-150 keV)    in 12.35 sec: 0.549747 ( -0.052225  0.052527 ) ph/cm2/s
Energy fluence (15-150 keV)             : 3.67583e-07 ( -4.51788e-08  5.01941e-08 ) ergs/cm2
Band function
Spectral model in the Band function:
------------------------------------------------------------
Parameters  : value       lower 90%   higher 90%
alpha       :    (     )
beta        :     (     )
Epeak [keV] :       (   )
Norm@50keV   :     (     )
------------------------------------------------------------

Photon flux (15-150 keV)    in  sec:  (    ) ph/cm2/s
Energy fluence (15-150 keV)             : 0 ( 0  0 ) ergs/cm2
S(25-50 keV) vs. S(50-100 keV) plot
S(25-50 keV)  = 1.30e-07
S(50-100 keV) = 1.19e-07
T90 vs. Hardness ratio plot
T90                                   = 10.8159999847412 sec.
Hardness ratio (energy fluence ratio) = 0.915385
Color vs. Color plot
Count Ratio  (25-50 keV) / (15-25 keV) = 1.00097
Count Ratio (50-100 keV) / (15-25 keV) = 0.419832
Mask shadow pattern
IMX = -4.142163713626277E-01, IMY = 9.308937244723164E-02
TIME vs. PHA plot around the trigger time
TIME vs. DetID plot around the trigger time
100 us light curve (15-350 keV)
Spacecraft aspect plot
Bright source in the pre-burst/pre-slew/post-slew images
Pre-burst image of 15-350 keV band
Time interval of the image:
-239.424000 -4.688000

# RAcent  DECcent POSerr Theta    Phi  PeakCts   SNR AngSep     Name
#  [deg]    [deg]    ['] [deg]  [deg]                   [']
315.3025   0.1834    2.6  47.9  145.2   4.3176   4.4 ------	UNKNOWN
 25.3640 -40.6478    2.6  34.2    9.6   1.3894   4.5 ------	UNKNOWN
 54.0112 -40.8601    4.2  53.0   -6.1   1.6753   2.8 ------	UNKNOWN
 57.5569 -39.7481    3.2  55.4   -8.2   2.8788   3.6 ------	UNKNOWN
 59.1265 -34.2457    3.3  55.7  -15.0   3.3844   3.5 ------	UNKNOWN
 23.2752   1.8202    3.5  26.3  -81.3   1.0607   3.3 ------	UNKNOWN
Pre-slew background subtracted image of 15-350 keV band
Time interval of the image:
-4.688000 7.664000

# RAcent  DECcent POSerr Theta    Phi  PeakCts   SNR AngSep     Name
#  [deg]    [deg]    ['] [deg]  [deg]                   [']
333.0582 -42.6233    2.2  38.2   77.2   0.8037   5.2 ------	UNKNOWN
336.8321   3.2410    2.2  29.7  164.9   0.2881   5.2 ------	UNKNOWN
350.3678   6.6468    0.6  23.0 -167.3   0.8671  18.7 ------	UNKNOWN
Post-slew image of 15-350 keV band
Time interval of the image:
200.876600 308.476600

# RAcent  DECcent POSerr Theta    Phi  PeakCts   SNR AngSep     Name
#  [deg]    [deg]    ['] [deg]  [deg]                   [']
135.6561 -40.5827    6.3  42.3  156.5   0.5901   1.8    6.1	Vela X-1
167.7489   6.8593    3.2  35.0   59.8   1.1012   3.6 ------	UNKNOWN
Plot creation:
Sat Jul 30 07:02:15 EDT 2022