Special notes of this burst
Image
Pre-slew 15.0-350.0 keV image (Event data)

#   RAcent    DECcent   POSerr    Theta     Phi              Peak Cts       SNR   Name
    2.9459   -21.8971   0.0035    16.0270    67.1769         5.3512328     55.780 TRIG_01048372

Foreground time interval of the image:
 -1.084  17.077 (delta_t =  18.161 [sec])
Background time interval of the image:
-172.723  -1.084 (delta_t = 171.639 [sec])
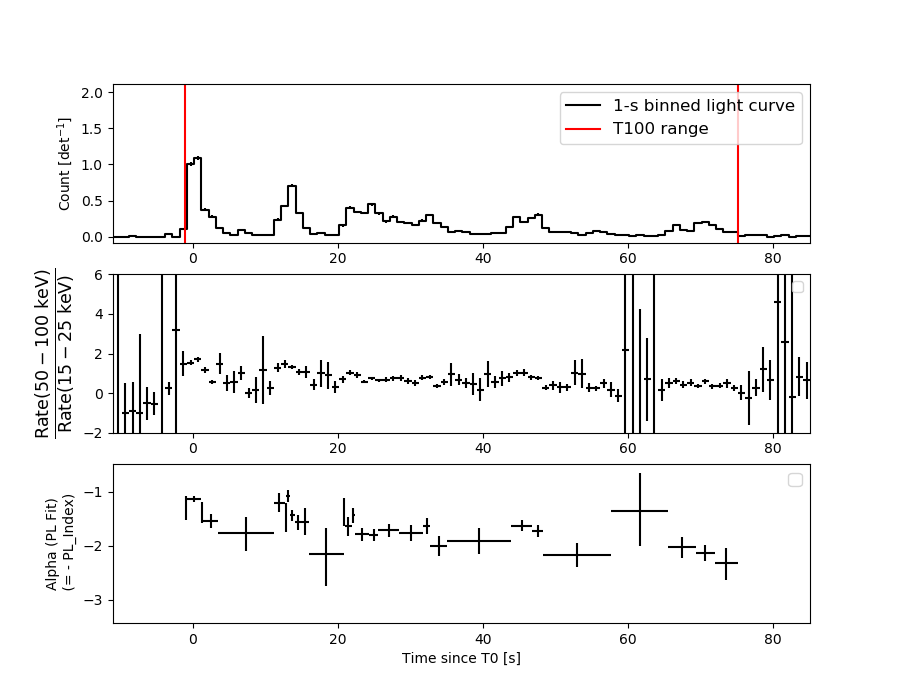
Lightcurves
Notes:
- 1) The mask-weighted light curves are using the flight position.
- 2) Multiple plots of different time binning/intervals are shown to cover all scenarios of short/long GRBs, rate/image triggers, and real/false positives.
- 3) For all the mask-weighted lightcurves, the y-axis units are counts/sec/det where a det is 0.4 x 0.4 = 0.16 sq cm.
- 4) The verticle lines correspond to following: green dotted lines are T50 interval, black dotted lines are T90 interval, blue solid line(s) is a spacecraft slew start time, and orange solid line(s) is a spacecraft slew end time.
- 5) Time of each bin is in the middle of the bin.
1 s binning
From T0-310 s to T0+310 s

From T100_start - 20 s to T100_end + 30 s

Full time interval
64 ms binning
Full time interval

From T100_start to T100_end
From T0-5 sec to T0+5 sec
16 ms binning
From T100_start-5 s to T100_start+5 s
8 ms binning
From T100_start-3 s to T100_start+3 s
2 ms binning
From T100_start-1 s to T100_start+1 s

SN=5 or 10 sec. binning (whichever binning is satisfied first)
SN=5 or 10 sec. binning (T < 200 sec)
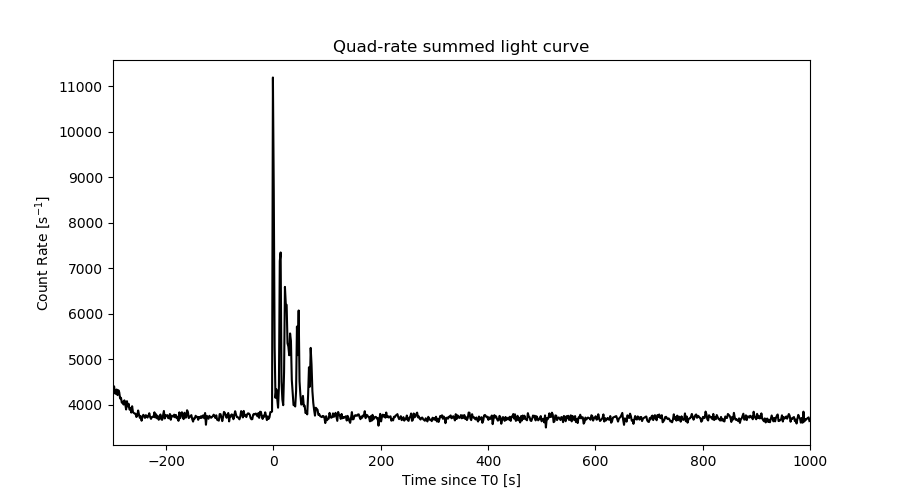
Quad-rate summed light curves (from T0-300s to T0+1000s)
Spectral Evolution
Spectra
Notes:
- 1) The fitting includes the systematic errors.
- 2) When the burst includes telescope slew time periods, the fitting uses an average response file made from multiple 5-s response files through out the slew time plus single time preiod for the non-slew times, and weighted by the total counts in the corresponding time period using addrmf. An average response file is needed becuase a spectral fit using the pre-slew DRM will introduce some errors in both a spectral shape and a normalization if the PHA file contains a lot of the slew/post-slew time interval.
- 3) For fits to more complicated models (e.g. a power-law over a cutoff power-law), the BAT team has decided to require a chi-square improvement of more than 6 for each extra dof.
Time averaged spectrum fit using the average DRM
Power-law model

Time interval is from   -1.084 sec. to   75.128 sec.

Spectral model in power-law:
------------------------------------------------------------
Parameters  : value       lower 90%   higher 90%
Photon index: 1.65473     ( -0.0429695   0.0430464 )
Norm@50keV  : 1.04085E-02    ( -0.000225937   0.0002259 )
------------------------------------------------------------
#Fit statistic  : Chi-Squared                   39.96     using 59 bins.
 Reduced chi-squared = 0.701053
# Null hypothesis probability of 9.58e-01 with 57 degrees of freedom

Photon flux (15-150 keV)    in 76.21 sec: 1.36127 ( -0.03391  0.03405 ) ph/cm2/s
Energy fluence (15-150 keV)             : 7.375e-06 ( -1.65555e-07  1.6553e-07 ) ergs/cm2
Cutoff power-law model
Time interval is from   -1.084 sec. to   75.128 sec.
Spectral model in the cutoff power-law:
------------------------------------------------------------
Parameters  : value       lower 90%   higher 90%
Photon index: 1.45056     ( -0.178123   0.171268 )
Epeak [keV] : 145.039      ( -43.3096 393.341 )
Norm@50keV  : 1.29301E-02    ( -0.00209988   0.00262286 )
------------------------------------------------------------
#Fit statistic  : Chi-Squared                   35.80     using 59 bins.
 Reduced chi-squared = 0.639286
# Null hypothesis probability of 9.84e-01 with 56 degrees of freedom

Photon flux (15-150 keV)    in 76.21 sec: 1.33671 ( -0.03907  0.03931 ) ph/cm2/s
Energy fluence (15-150 keV)             : 7.25691e-06 ( -1.92406e-07  1.91811e-07 ) ergs/cm2
Band function

Time interval is from   -1.084 sec. to   75.128 sec.


Spectral model in the Band function:
------------------------------------------------------------
Parameters  : value       lower 90%   higher 90%
alpha       :    (     )
beta        :     (     )
Epeak [keV] :       (   )
Norm@50keV   :     (     )
------------------------------------------------------------

Photon flux (15-150 keV)    in  sec:  (    ) ph/cm2/s
Energy fluence (15-150 keV)             : 0 ( 0  0 ) ergs/cm2
Single BB

Spectral model blackbody:
------------------------------------------------------------
Parameters  : value    Lower 90%  Upper 90%
kT [keV]    : 15.3324  (  )
R^2/D10^2   : 0.130055  (   )
(R is the radius in km and D10 is the distance to the source in units of 10 kpc)
------------------------------------------------------------
#Fit statistic  : Chi-Squared                  453.22     using 59 bins.
 Reduced chi-squared =
# Null hypothesis probability of 4.50e-63 with 57 degrees of freedom

Energy  Fluence     90% Error
[keV]   [erg/cm2]   [erg/cm2]
15- 25  4.860e-07   2.081e-08
25- 50  1.970e-06   5.678e-08
50-150  3.182e-06   1.357e-07
15-150  5.637e-06   1.349e-07
Thermal bremsstrahlung (OTTB)
Spectral model: thermal bremsstrahlung
------------------------------------------------------------
Parameters  : value         Lower 90%    Upper 90%
kT [keV]    : 168.725       (-18.8729      23.2229)
Norm        : 5.45639       (-0.150208     0.159116)
------------------------------------------------------------
#Fit statistic  : Chi-Squared                   38.30     using 59 bins.
 Reduced chi-squared =
# Null hypothesis probability of 9.73e-01 with 57 degrees of freedom

Energy  Fluence     90% Error
[keV]   [erg/cm2]   [erg/cm2]
15- 25  1.055e-06   4.877e-08
25- 50  1.987e-06   1.056e-07
50-150  4.107e-06   8.768e-07
15-150  7.150e-06   9.903e-07
Double BB
Spectral model: bbodyrad<1> + bbodyrad<2>
------------------------------------------------------------
Parameters  : value         Lower 90%    Upper 90%
kT1 [keV]   : 7.68606        (-0.633676      0.658556)
R1^2/D10^2  : 1.05267        (-0.253577      0.366521)
kT2 [keV]   : 27.7519        (-2.47645      3.19437)
R2^2/D10^2  : 1.20012E-02    (-0.00391542   0.00503876)
------------------------------------------------------------
#Fit statistic  : Chi-Squared                   45.66     using 59 bins.
 Reduced chi-squared =
# Null hypothesis probability of 8.11e-01 with 55 degrees of freedom

Energy  Fluence     90% Error
[keV]   [erg/cm2]   [erg/cm2]
15- 25  9.460e-07   6.859e-08
25- 50  2.043e-06   8.536e-08
50-150  4.158e-06   2.568e-07
15-150  7.147e-06   3.132e-07
Peak spectrum fit
Power-law model
Time interval is from   -0.520 sec. to    0.480 sec.

Spectral model in power-law:
------------------------------------------------------------
Parameters  : value       lower 90%   higher 90%
Photon index: 1.17758     ( -0.0697086   0.0697294 )
Norm@50keV  : 7.48113E-02    ( -0.0029893   0.0029892 )
------------------------------------------------------------
#Fit statistic  : Chi-Squared                   58.40     using 59 bins.
 Reduced chi-squared = 1.02456
# Null hypothesis probability of 4.24e-01 with 57 degrees of freedom

Photon flux (15-150 keV)    in 1 sec: 0.321756 (    ) ph/cm2/s
Energy fluence (15-150 keV)             : 7.63959e-07 ( -3.45183e-08  3.46607e-08 ) ergs/cm2
Cutoff power-law model
Time interval is from   -0.520 sec. to    0.480 sec.
Spectral model in the cutoff power-law:
------------------------------------------------------------
Parameters  : value       lower 90%   higher 90%
Photon index: 0.593977     ( -0.318422   0.297214 )
Epeak [keV] : 132.808      ( -28.5789 78.0508 )
Norm@50keV  : 0.139210    ( -0.0369165   0.0542434 )
------------------------------------------------------------
#Fit statistic  : Chi-Squared                   46.48     using 59 bins.
 Reduced chi-squared = 0.83
# Null hypothesis probability of 8.14e-01 with 56 degrees of freedom

Photon flux (15-150 keV)    in 1 sec: 8.52865 ( -0.37357  0.37344 ) ph/cm2/s
Energy fluence (15-150 keV)             : 7.39009e-07 ( -3.74729e-08  3.73632e-08 ) ergs/cm2
Band function

Time interval is from   -0.520 sec. to    0.480 sec.


Spectral model in the Band function:
------------------------------------------------------------
Parameters  : value       lower 90%   higher 90%
alpha       :    (     )
beta        :     (     )
Epeak [keV] :       (   )
Norm@50keV   :     (     )
------------------------------------------------------------

Photon flux (15-150 keV)    in  sec:  (    ) ph/cm2/s
Energy fluence (15-150 keV)             : 0 ( 0  0 ) ergs/cm2
Single BB
Spectral model blackbody:
------------------------------------------------------------
Parameters  : value    Lower 90%  Upper 90%
kT [keV]    : 18.9998  (  )
R^2/D10^2   : 0.487200  (   )
(R is the radius in km and D10 is the distance to the source in units of 10 kpc)
------------------------------------------------------------
#Fit statistic  : Chi-Squared                  120.67     using 59 bins.
 Reduced chi-squared =
# Null hypothesis probability of 1.81e-06 with 57 degrees of freedom

Energy  Fluence     90% Error
[keV]   [erg/cm2]   [erg/cm2]
15- 25  3.457e-08   2.640e-09
25- 50  1.663e-07   8.850e-09
50-150  4.411e-07   3.305e-08
15-150  6.420e-07   3.200e-08
Thermal bremsstrahlung (OTTB)
Spectral model: thermal bremsstrahlung
------------------------------------------------------------
Parameters  : value         Lower 90%    Upper 90%
kT [keV]    : 199.362       (      )
Norm        : 35.8234       (     )
------------------------------------------------------------
#Fit statistic  : Chi-Squared                  128.37     using 59 bins.
 Reduced chi-squared =
# Null hypothesis probability of 2.02e-07 with 57 degrees of freedom

Energy  Fluence     90% Error
[keV]   [erg/cm2]   [erg/cm2]
15- 25  8.920e-08   3.970e-09
25- 50  1.716e-07   7.600e-09
50-150  3.763e-07   1.665e-08
15-150  6.371e-07   2.915e-08
Double BB
Spectral model: bbodyrad<1> + bbodyrad<2>
------------------------------------------------------------
Parameters  : value         Lower 90%    Upper 90%
kT1 [keV]   : 7.50646        (-1.67976      2.08443)
R1^2/D10^2  : 4.62495        (-2.28518      5.96786)
kT2 [keV]   : 26.7947        (-3.21785      5.48501)
R2^2/D10^2  : 0.133681    (-0.0659246   0.0798166)
------------------------------------------------------------
#Fit statistic  : Chi-Squared                   48.70     using 59 bins.
 Reduced chi-squared =
# Null hypothesis probability of 7.13e-01 with 55 degrees of freedom

Energy  Fluence     90% Error
[keV]   [erg/cm2]   [erg/cm2]
15- 25  6.081e-08   1.466e-08
25- 50  1.641e-07   2.355e-08
50-150  5.098e-07   6.185e-08
15-150  7.348e-07   9.340e-08
Pre-slew spectrum (Pre-slew PHA with pre-slew DRM)
Power-law model
Spectral model in power-law:
------------------------------------------------------------
Parameters  : value       lower 90%   higher 90%
Photon index: 1.33882     ( -0.0500131   0.0499621 )
Norm@50keV  : 1.87070E-02    ( -0.000497292   0.000497286 )
------------------------------------------------------------
#Fit statistic  : Chi-Squared                   59.49     using 59 bins.
 Reduced chi-squared =
# Null hypothesis probability of 3.85e-01 with 57 degrees of freedom

Photon flux (15-150 keV)    in 18.16 sec: 2.24854 ( -0.0643202  0.0644564 ) ph/cm2/s
Energy fluence (15-150 keV)             : 3.32639e-06 ( -9.53311e-08  9.55025e-08 ) ergs/cm2
Cutoff power-law model

Spectral model in the cutoff power-law:
------------------------------------------------------------
Parameters  : value       lower 90%   higher 90%
Photon index: 1.09388     ( -0.205957   0.196733 )
Epeak [keV] : 205.327      ( -68.6588 524.014 )
Norm@50keV  : 2.41725E-02    ( -0.00439264   0.00563651 )
------------------------------------------------------------
#Fit statistic  : Chi-Squared                   54.94     using 59 bins.
 Reduced chi-squared =
# Null hypothesis probability of 5.15e-01 with 56 degrees of freedom

Photon flux (15-150 keV)    in 18.16 sec: 2.21200 ( -0.07003  0.07021 ) ph/cm2/s
Energy fluence (15-150 keV)             : 3.27479e-06 ( -1.05183e-07  1.04729e-07 ) ergs/cm2
Band function
Spectral model in the Band function:
------------------------------------------------------------
Parameters  : value       lower 90%   higher 90%
alpha       :    (     )
beta        :     (     )
Epeak [keV] :       (   )
Norm@50keV   :     (     )
------------------------------------------------------------

Photon flux (15-150 keV)    in  sec:  (    ) ph/cm2/s
Energy fluence (15-150 keV)             : 0 ( 0  0 ) ergs/cm2
S(25-50 keV) vs. S(50-100 keV) plot
S(25-50 keV)  = 1.96e-06
S(50-100 keV) = 2.49e-06
T90 vs. Hardness ratio plot

T90                                   = 70.2079999446869 sec.
Hardness ratio (energy fluence ratio) = 1.27041
Color vs. Color plot

Count Ratio  (25-50 keV) / (15-25 keV) = 1.26387
Count Ratio (50-100 keV) / (15-25 keV) = 0.841572
Mask shadow pattern
IMX = 1.114222770807317E-01, IMY = -2.647645744731804E-01
TIME vs. PHA plot around the trigger time

TIME vs. DetID plot around the trigger time
100 us light curve (15-350 keV)
Spacecraft aspect plot

Bright source in the pre-burst/pre-slew/post-slew images
Pre-burst image of 15-350 keV band
Time interval of the image:
-172.723410 -1.084000

# RAcent  DECcent POSerr Theta    Phi  PeakCts   SNR AngSep     Name
#  [deg]    [deg]    ['] [deg]  [deg]                   [']
330.5718   1.5041    2.3  44.6  129.6   4.1614   5.1 ------	UNKNOWN
Pre-slew background subtracted image of 15-350 keV band
Time interval of the image:
-1.084000 17.076620

# RAcent  DECcent POSerr Theta    Phi  PeakCts   SNR AngSep     Name
#  [deg]    [deg]    ['] [deg]  [deg]                   [']
330.4120  23.5693    2.2  54.1  156.1   2.5175   5.2 ------	UNKNOWN
  2.9459 -21.8971    0.2  16.0   67.2   5.3513  55.8 ------	UNKNOWN
 54.4112 -33.9403    2.7  44.2  -23.3   0.6891   4.3 ------	UNKNOWN
 52.6280 -31.7791    2.7  42.0  -25.3   0.6208   4.2 ------	UNKNOWN
 65.3303 -20.3327    2.9  50.5  -44.4   1.7093   4.0 ------	UNKNOWN
 46.6599  15.7724    2.8  41.3 -100.7   1.4549   4.2 ------	UNKNOWN
Post-slew image of 15-350 keV band
Time interval of the image:
58.876600 962.208900
1353.176000 1553.226000

# RAcent  DECcent POSerr Theta    Phi  PeakCts   SNR AngSep     Name
#  [deg]    [deg]    ['] [deg]  [deg]                   [']
318.7215 -36.1318    2.6  40.8   96.4   9.7638   4.5 ------	UNKNOWN
  9.5969 -70.4527    3.0  48.7   34.0  10.5619   3.8 ------	UNKNOWN
318.6596  -1.6296    2.4  47.6  145.9  12.4764   4.9 ------	UNKNOWN
351.7683 -40.9557    3.4  21.3   60.7   2.6265   3.4 ------	UNKNOWN
335.3328  11.5328    3.9  43.0  175.1   3.9876   3.0 ------	UNKNOWN
332.1798  28.2098    3.0  58.2 -175.1  15.3857   3.8 ------	UNKNOWN
 68.5810 -42.3512    2.8  57.7  -15.9  13.8911   4.1 ------	UNKNOWN
 64.2148 -39.3824    4.1  54.4  -19.5   6.6626   2.8 ------	UNKNOWN
 70.1557 -38.2264    2.9  59.1  -20.6  16.4411   3.9 ------	UNKNOWN
 57.3986 -20.0489    2.9  50.6  -44.6  14.6406   3.9 ------	UNKNOWN
Plot creation:
Fri Nov 11 21:59:13 EST 2022