Estimated redshift from machine learning (Ukwatta et al. 2016) - may take a few minute to calcaulte
Image
Pre-slew 15.0-350.0 keV image (Event data)
#   RAcent    DECcent   POSerr    Theta     Phi              Peak Cts       SNR   Name
  204.2840    14.4757   0.0136    35.7802    49.3752         1.5435991     14.182 TRIG_01054627

Foreground time interval of the image:
 -5.976  11.352 (delta_t =  17.328 [sec])
Background time interval of the image:
-239.560  -5.976 (delta_t = 233.584 [sec])
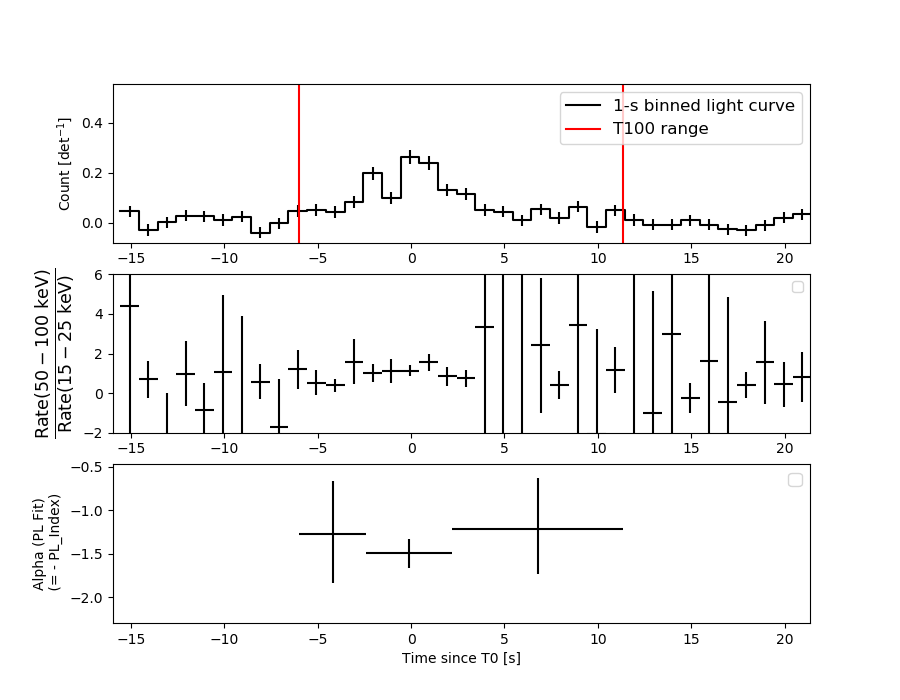
Lightcurves
Notes:
- 1) The mask-weighted light curves are using the flight position.
- 2) Multiple plots of different time binning/intervals are shown to cover all scenarios of short/long GRBs, rate/image triggers, and real/false positives.
- 3) For all the mask-weighted lightcurves, the y-axis units are counts/sec/det where a det is 0.4 x 0.4 = 0.16 sq cm.
- 4) The verticle lines correspond to following: green dotted lines are T50 interval, black dotted lines are T90 interval, blue solid line(s) is a spacecraft slew start time, and orange solid line(s) is a spacecraft slew end time.
- 5) Time of each bin is in the middle of the bin.
1 s binning
From T0-310 s to T0+310 s
From T100_start - 20 s to T100_end + 30 s
Full time interval
64 ms binning
Full time interval
From T100_start to T100_end
From T0-5 sec to T0+5 sec

16 ms binning
From T100_start-5 s to T100_start+5 s
Blue+Cyan dotted lines: Time interval of the scaled map
From 0.000000 to 1.024000
8 ms binning
From T100_start-3 s to T100_start+3 s

Blue+Cyan dotted lines: Time interval of the scaled map
From 0.000000 to 1.024000
2 ms binning
From T100_start-1 s to T100_start+1 s
Blue+Cyan dotted lines: Time interval of the scaled map
From 0.000000 to 1.024000
SN=5 or 10 sec. binning (whichever binning is satisfied first)
SN=5 or 10 sec. binning (T < 200 sec)
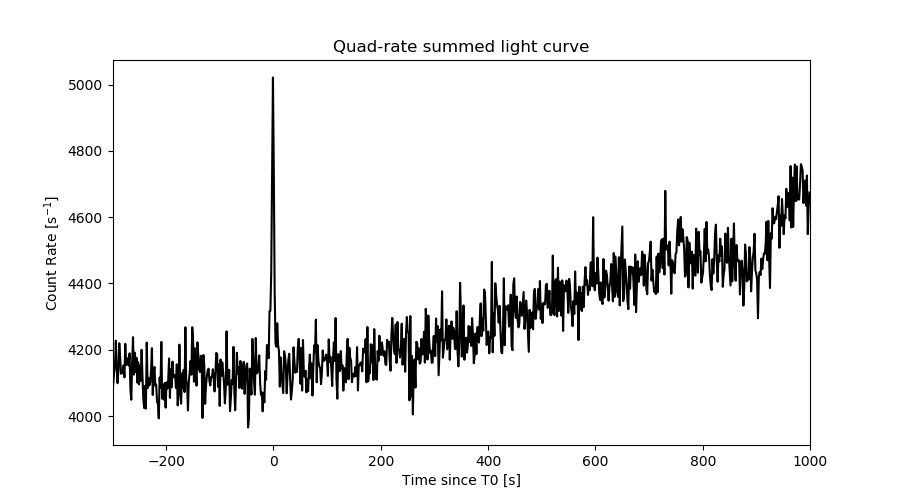
Quad-rate summed light curves (from T0-300s to T0+1000s)
Spectral Evolution
Spectra
Notes:
- 1) The fitting includes the systematic errors.
- 2) When the burst includes telescope slew time periods, the fitting uses an average response file made from multiple 5-s response files through out the slew time plus single time preiod for the non-slew times, and weighted by the total counts in the corresponding time period using addrmf. An average response file is needed becuase a spectral fit using the pre-slew DRM will introduce some errors in both a spectral shape and a normalization if the PHA file contains a lot of the slew/post-slew time interval.
- 3) For fits to more complicated models (e.g. a power-law over a cutoff power-law), the BAT team has decided to require a chi-square improvement of more than 6 for each extra dof.
Time averaged spectrum fit using the average DRM
Power-law model
Time interval is from   -5.976 sec. to   11.352 sec.

Spectral model in power-law:
------------------------------------------------------------
Parameters  : value       lower 90%   higher 90%
Photon index: 1.41325     ( -0.186704   0.185768 )
Norm@50keV  : 6.23186E-03    ( -0.000645462   0.00064323 )
------------------------------------------------------------
#Fit statistic  : Chi-Squared                   66.11     using 59 bins.
 Reduced chi-squared = 1.15982
# Null hypothesis probability of 1.91e-01 with 57 degrees of freedom

Photon flux (15-150 keV)    in 17.33 sec: 0.761253 ( -0.081518  0.081815 ) ph/cm2/s
Energy fluence (15-150 keV)             : 1.0409e-06 ( -1.17799e-07  1.18435e-07 ) ergs/cm2
Cutoff power-law model

Time interval is from   -5.976 sec. to   11.352 sec.
Spectral model in the cutoff power-law:
------------------------------------------------------------
Parameters  : value       lower 90%   higher 90%
Photon index: 1.40773     ( -0.185664   0.189003 )
Epeak [keV] : 9999.09      ( -9999.36 -9999.36 )
Norm@50keV  : 6.25468E-03    ( -0.00625435   0.00330818 )
------------------------------------------------------------
#Fit statistic  : Chi-Squared                   66.13     using 59 bins.
 Reduced chi-squared = 1.18089
# Null hypothesis probability of 1.67e-01 with 56 degrees of freedom

Photon flux (15-150 keV)    in 17.33 sec: 0.766006 ( -0.116122  0.106623 ) ph/cm2/s
Energy fluence (15-150 keV)             : 1.04623e-06 ( -1.62688e-07  1.52655e-07 ) ergs/cm2
Band function

Time interval is from   -5.976 sec. to   11.352 sec.


Spectral model in the Band function:
------------------------------------------------------------
Parameters  : value       lower 90%   higher 90%
alpha       :    (     )
beta        :     (     )
Epeak [keV] :       (   )
Norm@50keV   :     (     )
------------------------------------------------------------

Photon flux (15-150 keV)    in  sec:  (    ) ph/cm2/s
Energy fluence (15-150 keV)             : 0 ( 0  0 ) ergs/cm2
Single BB

Spectral model blackbody:
------------------------------------------------------------
Parameters  : value    Lower 90%  Upper 90%
kT [keV]    : 17.4215  (-2.63433  3.23265)
R^2/D10^2   : 5.07031E-02  (-0.0222303   0.038717)
(R is the radius in km and D10 is the distance to the source in units of 10 kpc)
------------------------------------------------------------
#Fit statistic  : Chi-Squared                  102.81     using 59 bins.
 Reduced chi-squared =
# Null hypothesis probability of 1.92e-04 with 57 degrees of freedom

Energy  Fluence     90% Error
[keV]   [erg/cm2]   [erg/cm2]
15- 25  5.394e-08   1.122e-08
25- 50  2.433e-07   4.514e-08
50-150  5.312e-07   1.109e-07
15-150  8.284e-07   1.084e-07
Thermal bremsstrahlung (OTTB)
Spectral model: thermal bremsstrahlung
------------------------------------------------------------
Parameters  : value         Lower 90%    Upper 90%
kT [keV]    : 200.000       (-44.6833      -200)
Norm        : 3.14551       (-0.325248     0.325248)
------------------------------------------------------------
#Fit statistic  : Chi-Squared                   69.86     using 59 bins.
 Reduced chi-squared =
# Null hypothesis probability of 1.18e-01 with 57 degrees of freedom

Energy  Fluence     90% Error
[keV]   [erg/cm2]   [erg/cm2]
15- 25  1.358e-07   2.762e-08
25- 50  2.611e-07   1.418e-07
50-150  5.727e-07   3.148e-07
15-150  9.696e-07   4.023e-07
Double BB

Spectral model: bbodyrad<1> + bbodyrad<2>
------------------------------------------------------------
Parameters  : value         Lower 90%    Upper 90%
kT1 [keV]   : 6.27992        (-1.57066      2.15847)
R1^2/D10^2  : 1.26934        (-0.828316      2.66044)
kT2 [keV]   : 32.0244        (-7.89153      18.2099)
R2^2/D10^2  : 5.76762E-03    (-0.0042081   0.00887956)
------------------------------------------------------------
#Fit statistic  : Chi-Squared                   65.14     using 59 bins.
 Reduced chi-squared =
# Null hypothesis probability of 1.64e-01 with 55 degrees of freedom

Energy  Fluence     90% Error
[keV]   [erg/cm2]   [erg/cm2]
15- 25  1.381e-07   6.915e-08
25- 50  2.324e-07   9.071e-08
50-150  7.009e-07   3.626e-07
15-150  1.071e-06   4.005e-07
Peak spectrum fit
Power-law model
Time interval is from   -0.292 sec. to    0.708 sec.

Spectral model in power-law:
------------------------------------------------------------
Parameters  : value       lower 90%   higher 90%
Photon index: 1.50681     ( -0.25477   0.258534 )
Norm@50keV  : 2.01453E-02    ( -0.00317887   0.00315567 )
------------------------------------------------------------
#Fit statistic  : Chi-Squared                   47.96     using 59 bins.
 Reduced chi-squared = 0.841404
# Null hypothesis probability of 7.98e-01 with 57 degrees of freedom

Photon flux (15-150 keV)    in 1 sec: 2.51962 ( -0.39594  0.3965 ) ph/cm2/s
Energy fluence (15-150 keV)             : 1.90924e-07 ( -3.24128e-08  3.26596e-08 ) ergs/cm2
Cutoff power-law model

Time interval is from   -0.292 sec. to    0.708 sec.
Spectral model in the cutoff power-law:
------------------------------------------------------------
Parameters  : value       lower 90%   higher 90%
Photon index: 1.19560     ( -1.11673   0.552802 )
Epeak [keV] : 131.899      ( -131.899 -131.899 )
Norm@50keV  : 2.89601E-02    ( -0.0289601   0.0730205 )
------------------------------------------------------------
#Fit statistic  : Chi-Squared                   47.65     using 59 bins.
 Reduced chi-squared = 0.850893
# Null hypothesis probability of 7.79e-01 with 56 degrees of freedom

Photon flux (15-150 keV)    in 1 sec: 2.49858 ( -0.40289  0.4018 ) ph/cm2/s
Energy fluence (15-150 keV)             : 1.88005e-07 ( -3.39733e-08  3.38402e-08 ) ergs/cm2
Band function

Time interval is from   -0.292 sec. to    0.708 sec.


Spectral model in the Band function:
------------------------------------------------------------
Parameters  : value       lower 90%   higher 90%
alpha       :    (     )
beta        :     (     )
Epeak [keV] :       (   )
Norm@50keV   :     (     )
------------------------------------------------------------

Photon flux (15-150 keV)    in  sec:  (    ) ph/cm2/s
Energy fluence (15-150 keV)             : 0 ( 0  0 ) ergs/cm2
Single BB
Spectral model blackbody:
------------------------------------------------------------
Parameters  : value    Lower 90%  Upper 90%
kT [keV]    : 15.5850  (-2.8709  3.59056)
R^2/D10^2   : 0.254324  (-0.132052   0.267093)
(R is the radius in km and D10 is the distance to the source in units of 10 kpc)
------------------------------------------------------------
#Fit statistic  : Chi-Squared                   58.53     using 59 bins.
 Reduced chi-squared =
# Null hypothesis probability of 4.19e-01 with 57 degrees of freedom

Energy  Fluence     90% Error
[keV]   [erg/cm2]   [erg/cm2]
15- 25  1.284e-08   3.867e-09
25- 50  5.282e-08   1.336e-08
50-150  8.876e-08   2.840e-08
15-150  1.544e-07   3.650e-08
Thermal bremsstrahlung (OTTB)
Spectral model: thermal bremsstrahlung
------------------------------------------------------------
Parameters  : value         Lower 90%    Upper 90%
kT [keV]    : 199.363       (-88.9586      -199.363)
Norm        : 10.3793       (-1.59053     1.59095)
------------------------------------------------------------
#Fit statistic  : Chi-Squared                   47.79     using 59 bins.
 Reduced chi-squared =
# Null hypothesis probability of 8.03e-01 with 57 degrees of freedom

Energy  Fluence     90% Error
[keV]   [erg/cm2]   [erg/cm2]
15- 25  2.585e-08   1.499e-08
25- 50  4.972e-08   2.801e-08
50-150  1.090e-07   5.980e-08
15-150  1.846e-07   1.044e-07
Double BB

Spectral model: bbodyrad<1> + bbodyrad<2>
------------------------------------------------------------
Parameters  : value         Lower 90%    Upper 90%
kT1 [keV]   : 5.97588        (-2.48198      4.05416)
R1^2/D10^2  : 4.38663        (-3.57379      34.4928)
kT2 [keV]   : 23.7535        (-6.49847      20.8446)
R2^2/D10^2  : 4.79171E-02    (-0.0425631   0.11076)
------------------------------------------------------------
#Fit statistic  : Chi-Squared                   47.39     using 59 bins.
 Reduced chi-squared =
# Null hypothesis probability of 7.57e-01 with 55 degrees of freedom

Energy  Fluence     90% Error
[keV]   [erg/cm2]   [erg/cm2]
15- 25  2.552e-08   1.415e-08
25- 50  4.709e-08   2.557e-08
50-150  1.139e-07   6.700e-08
15-150  1.865e-07   8.782e-08
Pre-slew spectrum (Pre-slew PHA with pre-slew DRM)
Power-law model
Spectral model in power-law:
------------------------------------------------------------
Parameters  : value       lower 90%   higher 90%
Photon index: 1.41325     ( -0.186704   0.185768 )
Norm@50keV  : 6.23186E-03    ( -0.000645462   0.00064323 )
------------------------------------------------------------
#Fit statistic  : Chi-Squared                   66.11     using 59 bins.
 Reduced chi-squared =
# Null hypothesis probability of 1.91e-01 with 57 degrees of freedom

Photon flux (15-150 keV)    in 17.33 sec: 0.761239 ( -0.0815137  0.0818102 ) ph/cm2/s
Energy fluence (15-150 keV)             : 1.04076e-06 ( -1.1778e-07  1.1844e-07 ) ergs/cm2
Cutoff power-law model

Spectral model in the cutoff power-law:
------------------------------------------------------------
Parameters  : value       lower 90%   higher 90%
Photon index: 1.41208     ( -0.406301   1.2946 )
Epeak [keV] : 9999.32      ( -9999.36 -9999.36 )
Norm@50keV  : 6.25262E-03    ( -0.00625275   0.0033095 )
------------------------------------------------------------
#Fit statistic  : Chi-Squared                   66.13     using 59 bins.
 Reduced chi-squared =
# Null hypothesis probability of 1.67e-01 with 56 degrees of freedom

Photon flux (15-150 keV)    in 17.33 sec: 0.763069 ( -0.08399  0.079929 ) ph/cm2/s
Energy fluence (15-150 keV)             : 1.03452e-06 ( -1.12265e-07  1.25724e-07 ) ergs/cm2
Band function

Spectral model in the Band function:
------------------------------------------------------------
Parameters  : value       lower 90%   higher 90%
alpha       :    (     )
beta        :     (     )
Epeak [keV] :       (   )
Norm@50keV   :     (     )
------------------------------------------------------------

Photon flux (15-150 keV)    in  sec:  (    ) ph/cm2/s
Energy fluence (15-150 keV)             : 0 ( 0  0 ) ergs/cm2
S(25-50 keV) vs. S(50-100 keV) plot
S(25-50 keV)  = 2.46e-07
S(50-100 keV) = 3.71e-07
T90 vs. Hardness ratio plot
T90                                   = 13.6160000562668 sec.
Hardness ratio (energy fluence ratio) = 1.50813
Color vs. Color plot
Count Ratio  (25-50 keV) / (15-25 keV) = 1.1352
Count Ratio (50-100 keV) / (15-25 keV) = 1.10171
Mask shadow pattern
IMX = 4.692482888128566E-01, IMY = -5.470022311397643E-01
TIME vs. PHA plot around the trigger time
Blue+Cyan dotted lines: Time interval of the scaled map
From 0.000000 to 1.024000
TIME vs. DetID plot around the trigger time
Blue+Cyan dotted lines: Time interval of the scaled map
From 0.000000 to 1.024000
100 us light curve (15-350 keV)
Blue+Cyan dotted lines: Time interval of the scaled map
From 0.000000 to 1.024000
Spacecraft aspect plot

Bright source in the pre-burst/pre-slew/post-slew images
Pre-burst image of 15-350 keV band
Time interval of the image:
-239.560000 -5.976000

# RAcent  DECcent POSerr Theta    Phi  PeakCts   SNR AngSep     Name
#  [deg]    [deg]    ['] [deg]  [deg]                   [']
135.4859 -40.5616    4.8  52.3 -162.7   1.5077   2.4    2.0	Vela X-1
165.2079  37.3644    4.7  37.0  -23.9   0.7658   2.5 ------	UNKNOWN
162.5793  32.1826    2.8  32.4  -29.6   1.1541   4.2 ------	UNKNOWN
140.6376  43.5508    2.9  50.6  -44.6   4.0582   4.0 ------	UNKNOWN
123.1315 -25.1463    2.5  52.9 -139.3   5.4244   4.6 ------	UNKNOWN
Pre-slew background subtracted image of 15-350 keV band
Time interval of the image:
-5.976000 11.352000

# RAcent  DECcent POSerr Theta    Phi  PeakCts   SNR AngSep     Name
#  [deg]    [deg]    ['] [deg]  [deg]                   [']
135.5831 -40.5569   34.9  52.3 -162.7  -0.0420  -0.3    2.5	Vela X-1
204.2840  14.4757    0.8  35.8   49.4   1.5432  14.2 ------	UNKNOWN
166.9932 -46.2050    2.3  47.1  167.2   0.6484   5.0 ------	UNKNOWN
182.6464  35.0359    2.4  36.0    0.1   0.3179   4.8 ------	UNKNOWN
161.3248 -29.0210    2.3  31.1  179.8   0.2847   4.9 ------	UNKNOWN
133.2568  21.2531    2.2  42.0  -74.6   0.9500   5.4 ------	UNKNOWN
Post-slew image of 15-350 keV band
Time interval of the image:
73.740590 890.840600

# RAcent  DECcent POSerr Theta    Phi  PeakCts   SNR AngSep     Name
#  [deg]    [deg]    ['] [deg]  [deg]                   [']
254.4399  35.3219   51.1  49.4   21.6  -0.4750  -0.2    1.5	Her X-1
254.8792  30.0931    2.9  48.9   28.5   9.3534   4.0 ------	UNKNOWN
179.3968 -26.1972    3.2  47.3  176.8   5.6758   3.6 ------	UNKNOWN
197.2968  31.8101    2.9  18.4  -53.1   2.6305   4.0 ------	UNKNOWN
156.2117   5.9855    2.3  48.0 -129.1  13.9383   5.0 ------	UNKNOWN
157.6578  12.1746    2.7  45.3 -121.1  10.9511   4.3 ------	UNKNOWN
Plot creation:
Sat Jul 30 06:59:26 EDT 2022