Estimated redshift from machine learning (Ukwatta et al. 2016) - may take a few minute to calcaulte
Image
Pre-slew 15.0-350.0 keV image (Event data)

#   RAcent    DECcent   POSerr    Theta     Phi              Peak Cts       SNR   Name
  243.9285    14.3985   0.0047    38.3319    43.0422        19.8607083     40.786 TRIG_01054681

Foreground time interval of the image:
-12.040  13.613 (delta_t =  25.653 [sec])
Background time interval of the image:
-239.688 -12.040 (delta_t = 227.648 [sec])
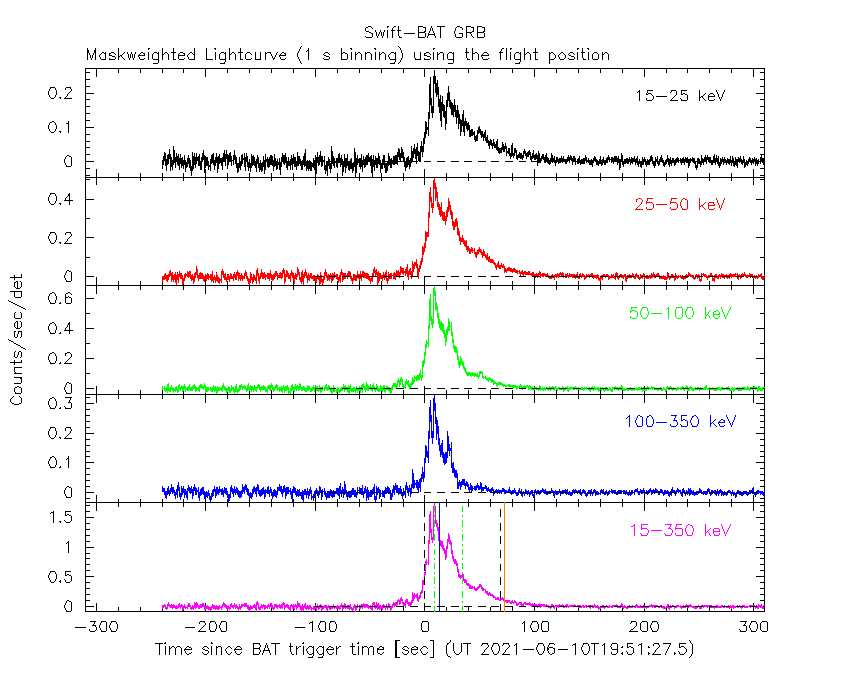
Lightcurves
Notes:
- 1) The mask-weighted light curves are using the flight position.
- 2) Multiple plots of different time binning/intervals are shown to cover all scenarios of short/long GRBs, rate/image triggers, and real/false positives.
- 3) For all the mask-weighted lightcurves, the y-axis units are counts/sec/det where a det is 0.4 x 0.4 = 0.16 sq cm.
- 4) The verticle lines correspond to following: green dotted lines are T50 interval, black dotted lines are T90 interval, blue solid line(s) is a spacecraft slew start time, and orange solid line(s) is a spacecraft slew end time.
- 5) Time of each bin is in the middle of the bin.
1 s binning
From T0-310 s to T0+310 s
From T100_start - 20 s to T100_end + 30 s

Full time interval

64 ms binning
Full time interval

From T100_start to T100_end

From T0-5 sec to T0+5 sec

16 ms binning
From T100_start-5 s to T100_start+5 s

8 ms binning
From T100_start-3 s to T100_start+3 s

2 ms binning
From T100_start-1 s to T100_start+1 s

SN=5 or 10 sec. binning (whichever binning is satisfied first)

SN=5 or 10 sec. binning (T < 200 sec)

Quad-rate summed light curves (from T0-300s to T0+1000s)

Spectral Evolution

Spectra
Notes:
- 1) The fitting includes the systematic errors.
- 2) When the burst includes telescope slew time periods, the fitting uses an average response file made from multiple 5-s response files through out the slew time plus single time preiod for the non-slew times, and weighted by the total counts in the corresponding time period using addrmf. An average response file is needed becuase a spectral fit using the pre-slew DRM will introduce some errors in both a spectral shape and a normalization if the PHA file contains a lot of the slew/post-slew time interval.
- 3) For fits to more complicated models (e.g. a power-law over a cutoff power-law), the BAT team has decided to require a chi-square improvement of more than 6 for each extra dof.
Time averaged spectrum fit using the average DRM
Power-law model

Time interval is from  -12.040 sec. to  142.472 sec.

Spectral model in power-law:
------------------------------------------------------------
Parameters  : value       lower 90%   higher 90%
Photon index: 1.13132     ( -0.0270876   0.0269844 )
Norm@50keV  : 2.26312E-02    ( -0.000350687   0.000349993 )
------------------------------------------------------------
#Fit statistic  : Chi-Squared                   32.22     using 59 bins.
 Reduced chi-squared = 0.565263
# Null hypothesis probability of 9.97e-01 with 57 degrees of freedom

Photon flux (15-150 keV)    in 154.5 sec: 2.63362 ( -0.04432  0.04442 ) ph/cm2/s
Energy fluence (15-150 keV)             : 3.62041e-05 ( -5.25484e-07  5.24809e-07 ) ergs/cm2
Cutoff power-law model

Time interval is from  -12.040 sec. to  142.472 sec.
Spectral model in the cutoff power-law:
------------------------------------------------------------
Parameters  : value       lower 90%   higher 90%
Photon index: 0.977445     ( -0.11223   0.105688 )
Epeak [keV] : 428.312      ( -151.283 901.742 )
Norm@50keV  : 2.59879E-02    ( -0.00127949   0.00268712 )
------------------------------------------------------------
#Fit statistic  : Chi-Squared                   26.49     using 59 bins.
 Reduced chi-squared = 0.473036
# Null hypothesis probability of 1.00e+00 with 56 degrees of freedom

Photon flux (15-150 keV)    in 154.5 sec: 2.60512 ( -0.04813  0.04836 ) ph/cm2/s
Energy fluence (15-150 keV)             : 3.60594e-05 ( -5.36467e-07  5.37037e-07 ) ergs/cm2
Band function

Time interval is from  -12.040 sec. to  142.472 sec.


Spectral model in the Band function:
------------------------------------------------------------
Parameters  : value       lower 90%   higher 90%
alpha       :    (     )
beta        :     (     )
Epeak [keV] :       (   )
Norm@50keV   :     (     )
------------------------------------------------------------

Photon flux (15-150 keV)    in  sec:  (    ) ph/cm2/s
Energy fluence (15-150 keV)             : 0 ( 0  0 ) ergs/cm2
Single BB
Spectral model blackbody:
------------------------------------------------------------
Parameters  : value    Lower 90%  Upper 90%
kT [keV]    : 23.5674  (  )
R^2/D10^2   : 7.21141E-02  (   )
(R is the radius in km and D10 is the distance to the source in units of 10 kpc)
------------------------------------------------------------
#Fit statistic  : Chi-Squared                  799.84     using 59 bins.
 Reduced chi-squared =
# Null hypothesis probability of 1.39e-131 with 57 degrees of freedom

Energy  Fluence     90% Error
[keV]   [erg/cm2]   [erg/cm2]
15- 25  1.108e-06   3.569e-08
25- 50  6.094e-06   1.514e-07
50-150  2.525e-05   4.558e-07
15-150  3.245e-05   5.098e-07
Thermal bremsstrahlung (OTTB)

Spectral model: thermal bremsstrahlung
------------------------------------------------------------
Parameters  : value         Lower 90%    Upper 90%
kT [keV]    : 199.363       (      )
Norm        : 11.7195       (     )
------------------------------------------------------------
#Fit statistic  : Chi-Squared                  871.78     using 59 bins.
 Reduced chi-squared =
# Null hypothesis probability of 3.54e-146 with 57 degrees of freedom

Energy  Fluence     90% Error
[keV]   [erg/cm2]   [erg/cm2]
15- 25  4.509e-06   7.493e-08
25- 50  8.673e-06   1.483e-07
50-150  1.902e-05   3.090e-07
15-150  3.220e-05   5.176e-07
Double BB

Spectral model: bbodyrad<1> + bbodyrad<2>
------------------------------------------------------------
Parameters  : value         Lower 90%    Upper 90%
kT1 [keV]   : 9.31645        (-0.609146      0.64135)
R1^2/D10^2  : 0.808238        (-0.149011      0.192933)
kT2 [keV]   : 37.3827        (-2.16517      2.62324)
R2^2/D10^2  : 1.40045E-02    (-0.00274514   0.00303282)
------------------------------------------------------------
#Fit statistic  : Chi-Squared                   27.11     using 59 bins.
 Reduced chi-squared =
# Null hypothesis probability of 9.99e-01 with 55 degrees of freedom

Energy  Fluence     90% Error
[keV]   [erg/cm2]   [erg/cm2]
15- 25  2.555e-06   1.475e-07
25- 50  7.545e-06   2.325e-07
50-150  2.602e-05   7.262e-07
15-150  3.612e-05   8.575e-07
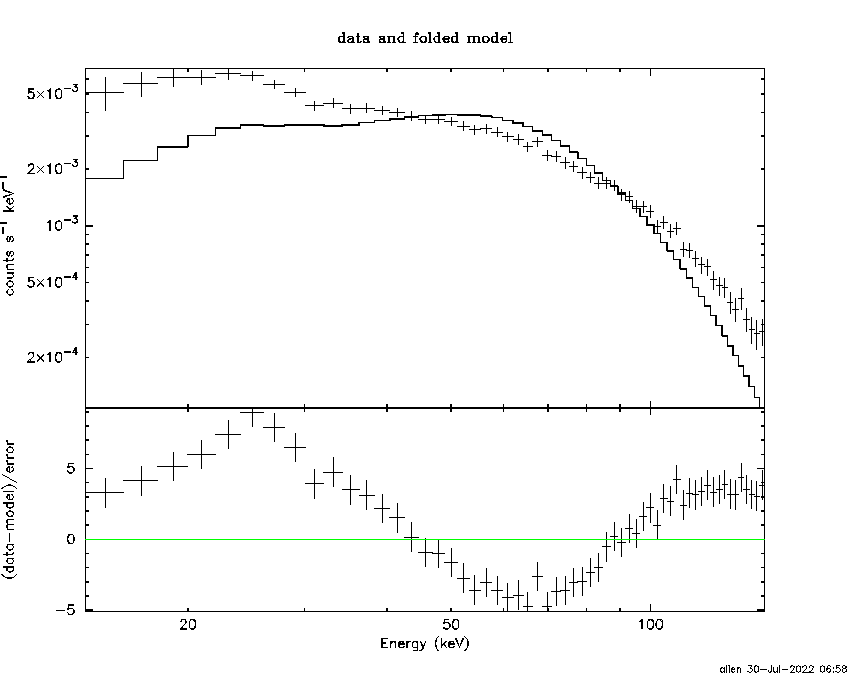
Peak spectrum fit
Power-law model
Time interval is from    7.948 sec. to    8.948 sec.

Spectral model in power-law:
------------------------------------------------------------
Parameters  : value       lower 90%   higher 90%
Photon index: 0.665326     ( -0.0955809   0.0936348 )
Norm@50keV  : 0.116409    ( -0.00654709   0.00649662 )
------------------------------------------------------------
#Fit statistic  : Chi-Squared                   70.06     using 59 bins.
 Reduced chi-squared = 1.22912
# Null hypothesis probability of 1.15e-01 with 57 degrees of freedom

Photon flux (15-150 keV)    in 1 sec: 0.692270 ( -0.019182  0.43008 ) ph/cm2/s
Energy fluence (15-150 keV)             : 1.44371e-06 ( -8.19518e-08  8.21335e-08 ) ergs/cm2
Cutoff power-law model

Time interval is from    7.948 sec. to    8.948 sec.
Spectral model in the cutoff power-law:
------------------------------------------------------------
Parameters  : value       lower 90%   higher 90%
Photon index: 0.658243     ( -0.097362   0.0933276 )
Epeak [keV] : 9999.36      ( -9999.36 -9999.36 )
Norm@50keV  : 0.117346    ( -0.00621124   0.0409666 )
------------------------------------------------------------
#Fit statistic  : Chi-Squared                   70.07     using 59 bins.
 Reduced chi-squared = 1.25125
# Null hypothesis probability of 9.78e-02 with 56 degrees of freedom

Photon flux (15-150 keV)    in 1 sec: 13.5069 ( -0.8248  0.7958 ) ph/cm2/s
Energy fluence (15-150 keV)             : 1.44451e-06 ( -9.54539e-08  6.21318e-08 ) ergs/cm2
Band function

Time interval is from    7.948 sec. to    8.948 sec.


Spectral model in the Band function:
------------------------------------------------------------
Parameters  : value       lower 90%   higher 90%
alpha       :    (     )
beta        :     (     )
Epeak [keV] :       (   )
Norm@50keV   :     (     )
------------------------------------------------------------

Photon flux (15-150 keV)    in  sec:  (    ) ph/cm2/s
Energy fluence (15-150 keV)             : 0 ( 0  0 ) ergs/cm2
Single BB

Spectral model blackbody:
------------------------------------------------------------
Parameters  : value    Lower 90%  Upper 90%
kT [keV]    : 28.6411  (  )
R^2/D10^2   : 0.240195  (   )
(R is the radius in km and D10 is the distance to the source in units of 10 kpc)
------------------------------------------------------------
#Fit statistic  : Chi-Squared                  123.84     using 59 bins.
 Reduced chi-squared =
# Null hypothesis probability of 7.43e-07 with 57 degrees of freedom

Energy  Fluence     90% Error
[keV]   [erg/cm2]   [erg/cm2]
15- 25  3.170e-08   3.380e-09
25- 50  1.918e-07   1.645e-08
50-150  1.130e-06   8.850e-08
15-150  1.353e-06   9.200e-08
Thermal bremsstrahlung (OTTB)

Spectral model: thermal bremsstrahlung
------------------------------------------------------------
Parameters  : value         Lower 90%    Upper 90%
kT [keV]    : 199.363       (      )
Norm        : 49.1917       (     )
------------------------------------------------------------
#Fit statistic  : Chi-Squared                  294.42     using 59 bins.
 Reduced chi-squared =
# Null hypothesis probability of 1.04e-33 with 57 degrees of freedom

Energy  Fluence     90% Error
[keV]   [erg/cm2]   [erg/cm2]
15- 25  1.225e-07   7.850e-09
25- 50  2.356e-07   2.590e-08
50-150  5.168e-07   1.354e-07
15-150  8.749e-07   1.970e-07
Double BB
Spectral model: bbodyrad<1> + bbodyrad<2>
------------------------------------------------------------
Parameters  : value         Lower 90%    Upper 90%
kT1 [keV]   : 12.6520        (-3.28031      3.06093)
R1^2/D10^2  : 1.44730        (-0.614554      1.44019)
kT2 [keV]   : 68.5691        (-26.8493      -71.9493)
R2^2/D10^2  : 2.04360E-02    (-0.0101615   0.0411632)
------------------------------------------------------------
#Fit statistic  : Chi-Squared                   70.83     using 59 bins.
 Reduced chi-squared =
# Null hypothesis probability of 7.40e-02 with 55 degrees of freedom

Energy  Fluence     90% Error
[keV]   [erg/cm2]   [erg/cm2]
15- 25  5.725e-08   1.518e-08
25- 50  2.266e-07   5.930e-08
50-150  1.152e-06   4.899e-07
15-150  1.436e-06   5.503e-07
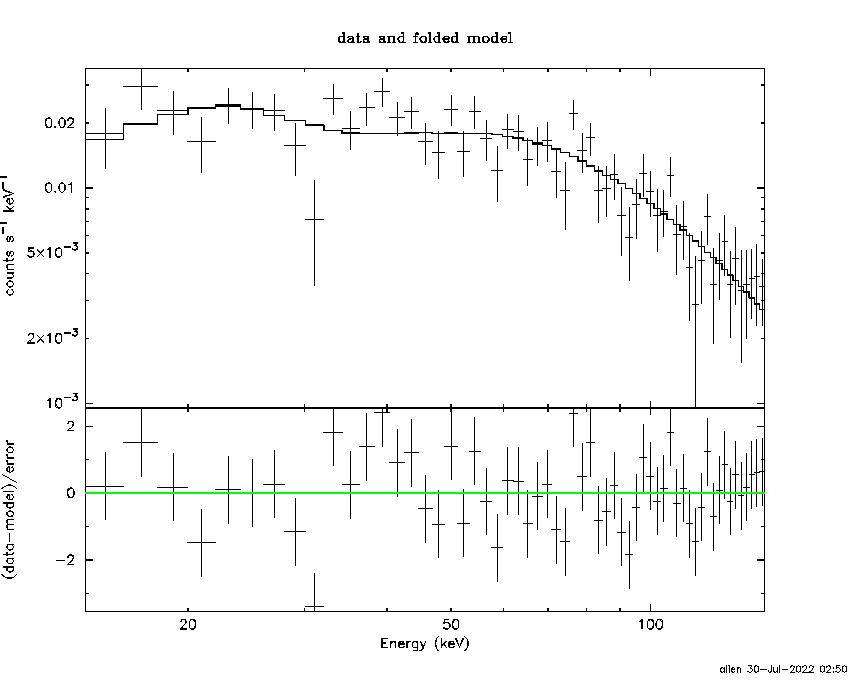
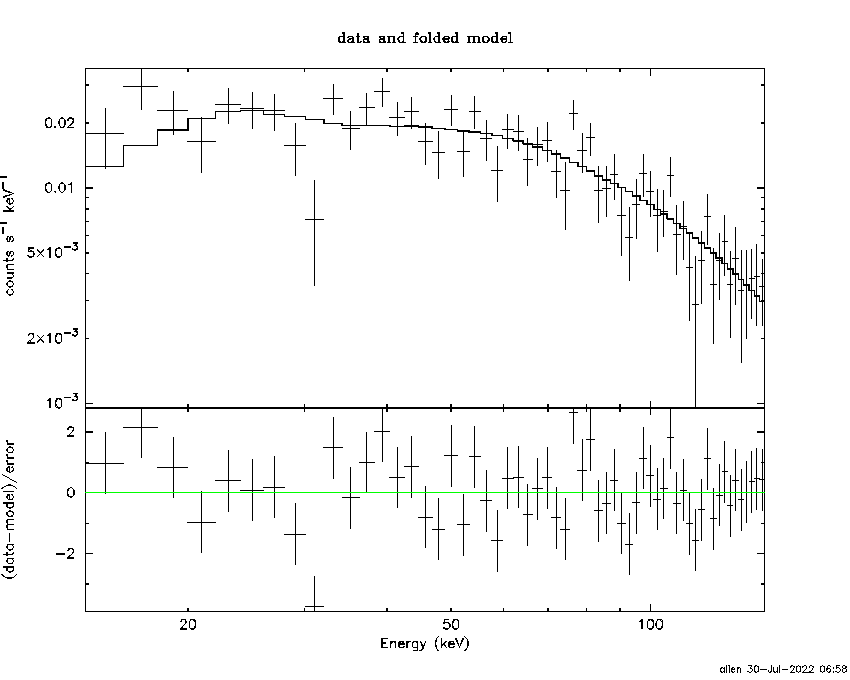
Pre-slew spectrum (Pre-slew PHA with pre-slew DRM)
Power-law model

Spectral model in power-law:
------------------------------------------------------------
Parameters  : value       lower 90%   higher 90%
Photon index: 0.806162     ( -0.0370019   0.0367172 )
Norm@50keV  : 5.17088E-02    ( -0.00112893   0.00112478 )
------------------------------------------------------------
#Fit statistic  : Chi-Squared                   46.04     using 59 bins.
 Reduced chi-squared =
# Null hypothesis probability of 8.50e-01 with 57 degrees of freedom

Photon flux (15-150 keV)    in 25.65 sec: 5.94174 ( -0.126391  0.126578 ) ph/cm2/s
Energy fluence (15-150 keV)             : 1.54594e-05 ( -3.15362e-07  3.15474e-07 ) ergs/cm2
Cutoff power-law model

Spectral model in the cutoff power-law:
------------------------------------------------------------
Parameters  : value       lower 90%   higher 90%
Photon index: 0.722541     ( -0.148336   0.11839 )
Epeak [keV] : 998.500      ( -999.834 -999.834 )
Norm@50keV  : 5.57153E-02    ( -0.00468544   0.00767837 )
------------------------------------------------------------
#Fit statistic  : Chi-Squared                   45.10     using 59 bins.
 Reduced chi-squared =
# Null hypothesis probability of 8.51e-01 with 56 degrees of freedom

Photon flux (15-150 keV)    in 25.65 sec: 5.92065 ( -0.13101  0.12892 ) ph/cm2/s
Energy fluence (15-150 keV)             : 1.54502e-05 ( -3.18291e-07  3.17547e-07 ) ergs/cm2
Band function

Spectral model in the Band function:
------------------------------------------------------------
Parameters  : value       lower 90%   higher 90%
alpha       :    (     )
beta        :     (     )
Epeak [keV] :       (   )
Norm@50keV   :     (     )
------------------------------------------------------------

Photon flux (15-150 keV)    in  sec:  (    ) ph/cm2/s
Energy fluence (15-150 keV)             : 0 ( 0  0 ) ergs/cm2
S(25-50 keV) vs. S(50-100 keV) plot

S(25-50 keV)  = 7.29e-06
S(50-100 keV) = 1.33e-05
T90 vs. Hardness ratio plot

T90                                   = 69.3839999437332 sec.
Hardness ratio (energy fluence ratio) = 1.82442
Color vs. Color plot

Count Ratio  (25-50 keV) / (15-25 keV) = 1.80071
Count Ratio (50-100 keV) / (15-25 keV) = 1.86276
Mask shadow pattern

IMX = 5.778535244441950E-01, IMY = -5.396527728179455E-01
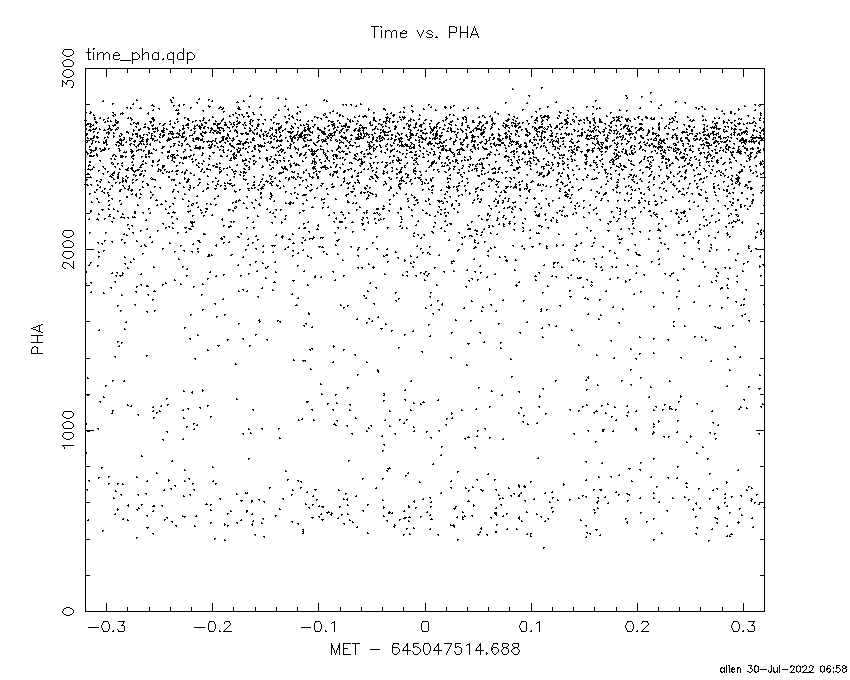
TIME vs. PHA plot around the trigger time
TIME vs. DetID plot around the trigger time

100 us light curve (15-350 keV)

Spacecraft aspect plot

Bright source in the pre-burst/pre-slew/post-slew images
Pre-burst image of 15-350 keV band
Time interval of the image:
-239.688000 -12.040000

# RAcent  DECcent POSerr Theta    Phi  PeakCts   SNR AngSep     Name
#  [deg]    [deg]    ['] [deg]  [deg]                   [']
254.5696  35.5188    0.0  49.5   13.4   0.3378   0.6   11.9	Her X-1
230.5493  19.3091    2.3  25.6   33.5   1.3517   5.0 ------	UNKNOWN
251.7571  43.1883    2.8  49.6    2.9   2.0056   4.2 ------	UNKNOWN
Pre-slew background subtracted image of 15-350 keV band
Time interval of the image:
-12.040000 13.612600

# RAcent  DECcent POSerr Theta    Phi  PeakCts   SNR AngSep     Name
#  [deg]    [deg]    ['] [deg]  [deg]                   [']
254.5696  35.5188    0.0  49.5   13.4  -0.0423  -0.1   11.9	Her X-1
243.9285  14.3985    0.3  38.3   43.0  19.8619  40.8 ------	UNKNOWN
203.2302 -12.0390    3.0  26.5  140.4   0.8588   3.9 ------	UNKNOWN
178.7643  53.0800    3.5  43.5  -64.0   1.7285   3.4 ------	UNKNOWN
158.1695  20.0544    2.5  44.3 -117.9   2.2277   4.6 ------	UNKNOWN
Post-slew image of 15-350 keV band
Time interval of the image:
73.012600 720.022000
720.312000 962.370100

# RAcent  DECcent POSerr Theta    Phi  PeakCts   SNR AngSep     Name
#  [deg]    [deg]    ['] [deg]  [deg]                   [']
244.9959 -15.6382    0.6  30.1  110.2  25.0915  20.1    1.0	Sco X-1
254.3252  35.2185    8.4  22.8  -45.4  -1.1856  -1.4    9.9	Her X-1
268.5353  -1.5375    0.0  29.1   53.4  -1.8837  -1.5   11.3	SW J1753.5-0127
274.1072 -13.9388    3.9  41.2   64.4   7.5718   3.0    8.3	GX 17+2
288.7695  10.8892   12.6  43.8   21.4   1.2665   0.9    3.8	GRS 1915+105
299.6203  35.2066    1.6  53.9  -11.1  15.0327   7.1    1.5	Cyg X-1
281.8400  44.5264    3.0  44.0  -28.7   5.4389   3.8 ------	UNKNOWN
217.5038  37.0600    5.4  32.6 -108.9   3.0868   2.1 ------	UNKNOWN
194.6708  30.7475    3.1  47.9 -129.1  13.7120   3.8 ------	UNKNOWN
Plot creation:
Sat Jul 30 06:58:54 EDT 2022