Estimated redshift from machine learning (Ukwatta et al. 2016) - may take a few minutes to calcaulte
Image
Pre-slew 15-350 keV image (Event data; bkg subtracted)

#   RAcent  DECcent POSerr  Theta    Phi     Peak Cts     SNR  Name
  238.7715 -54.0856 0.0285    0.0  171.1       0.0172     6.7  TRIG_01057131
------------------------------------------

Foreground time interval of the image:
 -0.004   0.012 (delta_t =   0.016 [sec])
Background time interval of the image:
-60.192  -0.004 (delta_t =  60.188 [sec])
Lightcurves
Notes:
- 1) All plots contain as much data as has been downloaded to date.
- 2) The mask-weighted light curves are using the flight position.
- 3) Multiple plots of different time binning/intervals are shown to cover all scenarios of short/long GRBs, rate/image triggers, and real/false positives.
- 4) For all the mask-weighted lightcurves, the y-axis units are counts/sec/det where a det is 0.4 x 0.4 = 0.16 sq cm.
- 5) The verticle lines correspond to following: green dotted lines are T50 interval, black dotted lines are T90 interval, blue solid line(s) is a spacecraft slew start time, and orange solid line(s) is a spacecraft slew end time.
- 6) Time of each bin is in the middle of the bin.
1 s binning
From T0-310 s to T0+310 s

From T100_start - 20 s to T100_end + 30 s

Full time interval

64 ms binning
Full time interval

From T100_start to T100_end

From T0-5 sec to T0+5 sec

16 ms binning
From T100_start-5 s to T100_start+5 s

Blue+Cyan dotted lines: Time interval of the scaled map
From 0.000000 to 0.008000
8 ms binning
From T100_start-3 s to T100_start+3 s

Blue+Cyan dotted lines: Time interval of the scaled map
From 0.000000 to 0.008000
2 ms binning
From T100_start-1 s to T100_start+1 s

Blue+Cyan dotted lines: Time interval of the scaled map
From 0.000000 to 0.008000
SN=5 or 10 sec. binning (whichever binning is satisfied first)

SN=5 or 10 sec. binning (T < 200 sec)

Spectra
Notes:
- 1) The fitting includes the systematic errors.
- 2) For long bursts, a spectral fit of the pre-slew DRM will introduce some errors in both a spectral shape and a normalization if the PHA file contains a lot of the slew/post-slew time interval.
- 3) For fits to more complicated models (e.g. a power-law over a cutoff power-law), the BAT team has decided to require a chi-square improvement of more than 6 for each extra dof.
- 4) For short bursts (T90<1sec), the specrtum is also fit with Blackbody, OTTB, and Double Blackbody.
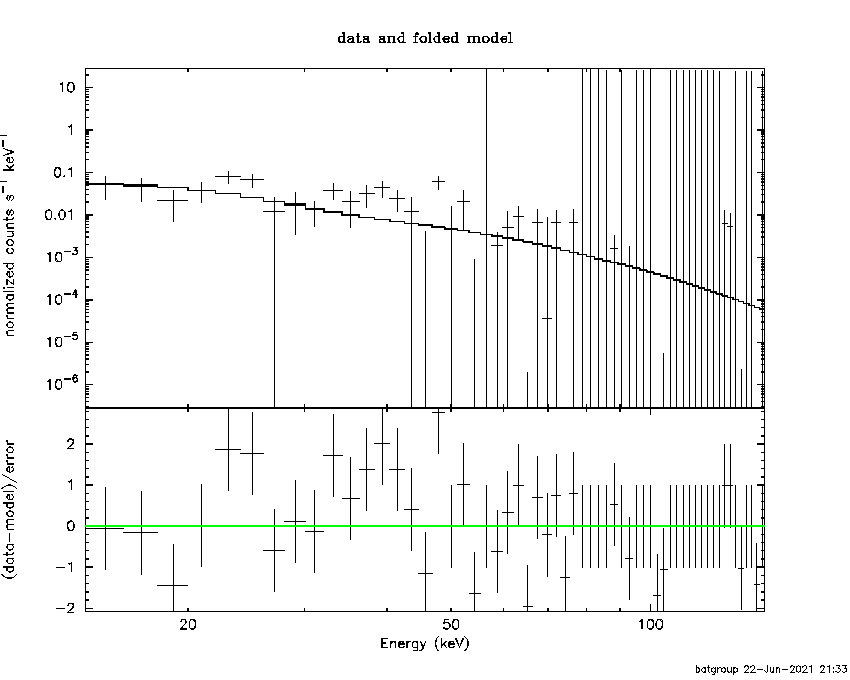
Time averaged spectrum fit using the pre-slew DRM
Power-law model

Time interval is from   -0.004 sec. to    0.012 sec.

Spectral model in power-law:
------------------------------------------------------------
Parameters  : value       lower 90%   higher 90%
Photon index: 2.67881     ( -0.488924   0.615318 )
Norm@50keV  : 3.05123E-02    ( -0.013326   0.0134304 )
------------------------------------------------------------
#Fit statistic  : Chi-Squared                   51.76     using 59 bins.
 Reduced chi-squared =
# Null hypothesis probability of 6.71e-01 with 57 degrees of freedom

Photon flux (15-150 keV)    in 0.016 sec: 6.71525 ( -1.80967  1.80977 ) ph/cm2/s
Energy fluence (15-150 keV)             : 5.15618e-09 ( -1.60088e-09  1.68406e-09 ) ergs/cm2
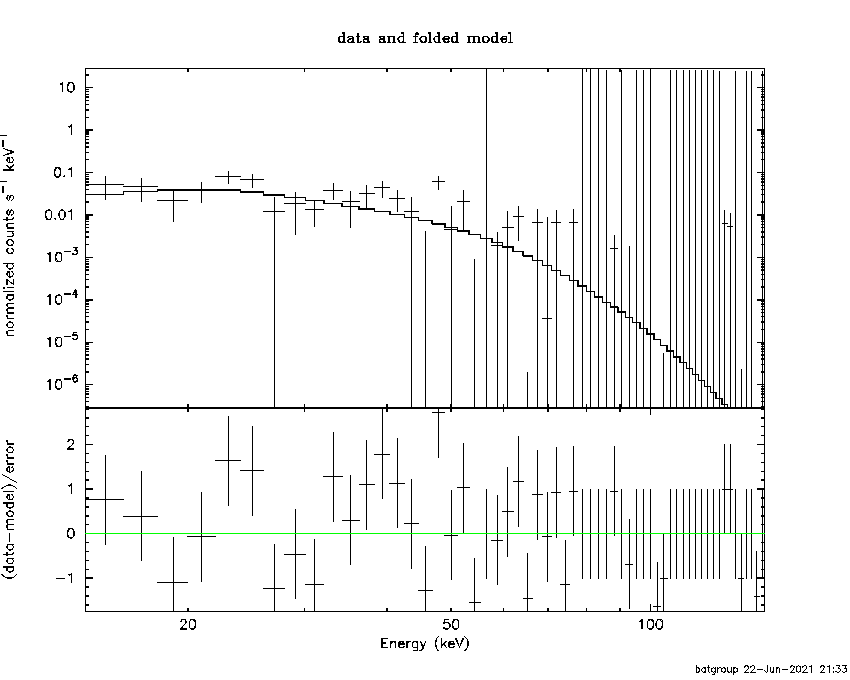
Cutoff power-law model

Time interval is from   -0.004 sec. to    0.012 sec.
Spectral model in the cutoff power-law:
------------------------------------------------------------
Parameters  : value       lower 90%   higher 90%
Photon index: -1.41012     ( -5.4983   3.20643 )
Epeak [keV] : 28.6635      ( -19.0875 6.69456 )
Norm@50keV  : 13.5743    ( -16.2186   46638.1 )
------------------------------------------------------------
#Fit statistic  : Chi-Squared                   47.21     using 59 bins.
 Reduced chi-squared =
# Null hypothesis probability of 7.92e-01 with 56 degrees of freedom

Photon flux (15-150 keV)    in 0.016 sec: 6.75278 ( -1.78221  1.78533 ) ph/cm2/s
Energy fluence (15-150 keV)             : 4.86717e-09 ( -1.33637e-09  1.35846e-09 ) ergs/cm2
Band function

Time interval is from   -0.004 sec. to    0.012 sec.
XSPEC12>exit
 XSPEC: quit


Spectral model in the Band function:
------------------------------------------------------------
Parameters  : value       lower 90%   higher 90%
alpha       : 1.70536   ( -3.19263   -1.43437 )
beta        : -10.0000    ( 10   0 )
Epeak [keV] : 29.3435      ( -5.99461 5.83307 )
Norm@50keV   : 20.1346    ( -17.0125   2499.55 )
------------------------------------------------------------

Photon flux (15-150 keV)    in 0.016 sec:  (    ) ph/cm2/s
Energy fluence (15-150 keV)             : 0 ( 0  0 ) ergs/cm2
Single BB

Spectral model blackbody:
------------------------------------------------------------
Parameters  : value    Lower 90%  Upper 90%
kT [keV]    : 7.45859  (-1.52342  1.51871)
R^2/D10^2   : 11.2155  (-6.245   16.9727)
(R is the radius in km and D10 is the distance to the source in units of 10 kpc)
------------------------------------------------------------
#Fit statistic  : Chi-Squared                   47.10     using 59 bins.
 Reduced chi-squared =
# Null hypothesis probability of 8.22e-01 with 57 degrees of freedom

Energy  Fluence     90% Error
[keV]   [erg/cm2]   [erg/cm2]
15- 25  1.705e-09   7.829e-10
25- 50  2.632e-09   1.220e-09
50-150  5.458e-10   4.256e-10
15-150  4.883e-09   2.156e-09
Thermal bremsstrahlung (OTTB)

Spectral model: thermal bremsstrahlung
------------------------------------------------------------
Parameters  : value         Lower 90%    Upper 90%
kT [keV]    : 26.1375       (-9.70915      16.7965)
Norm        : 64.2158       (-26.2405     45.0011)
------------------------------------------------------------
#Fit statistic  : Chi-Squared                   49.31     using 59 bins.
 Reduced chi-squared =
# Null hypothesis probability of 7.56e-01 with 57 degrees of freedom

Energy  Fluence     90% Error
[keV]   [erg/cm2]   [erg/cm2]
15- 25  1.935e-09   7.026e-10
25- 50  2.040e-09   8.490e-10
50-150  9.252e-10   6.966e-10
15-150  4.900e-09   2.290e-09
Double BB

Spectral model: bbodyrad<1> + bbodyrad<2>
------------------------------------------------------------
Parameters  : value         Lower 90%    Upper 90%
kT1 [keV]   : 0.809103        (-0.799458      3.28617)
R1^2/D10^2  : 7.23535E+07        (-1.06665e+08      1.58506e+13)
kT2 [keV]   : 7.62755        (-1.5539      1.58299)
R2^2/D10^2  : 9.97159    (-5.88447   14.4847)
------------------------------------------------------------
#Fit statistic  : Chi-Squared                   46.42     using 59 bins.
 Reduced chi-squared =
# Null hypothesis probability of 7.88e-01 with 55 degrees of freedom

Energy  Fluence     90% Error
[keV]   [erg/cm2]   [erg/cm2]
15- 25  1.672e-09   9.936e-10
25- 50  2.600e-09   1.565e-09
50-150  5.820e-10   4.575e-10
15-150  4.854e-09   2.862e-09
Peak spectrum fit
Power-law model

Time interval is from   -0.494 sec. to    0.506 sec.

Spectral model in power-law:
------------------------------------------------------------
Parameters  : value       lower 90%   higher 90%
Photon index: 2.72442     ( -1.58776   -2.70032 )
Norm@50keV  : 7.24560E-04    ( -0.000726425   0.00125396 )
------------------------------------------------------------
#Fit statistic  : Chi-Squared                   64.36     using 59 bins.
 Reduced chi-squared =
# Null hypothesis probability of 2.35e-01 with 57 degrees of freedom

Photon flux (15-150 keV)    in 1 sec: 0.164526 ( -0.148691  0.149676 ) ph/cm2/s
Energy fluence (15-150 keV)             : 7.73386e-09 ( -7.8907e-09  1.03254e-08 ) ergs/cm2
Cutoff power-law model

Time interval is from   -0.494 sec. to    0.506 sec.
Spectral model in the cutoff power-law:
------------------------------------------------------------
Parameters  : value       lower 90%   higher 90%
Photon index: -9.79336     ( 9.83446   11.9288 )
Epeak [keV] : 29.8925      ( -11.542 33.6345 )
Norm@50keV  : 1.40317E+05    ( -168160   4.3972e+07 )
------------------------------------------------------------
#Fit statistic  : Chi-Squared                   63.04     using 59 bins.
 Reduced chi-squared =
# Null hypothesis probability of 2.41e-01 with 56 degrees of freedom

Photon flux (15-150 keV)    in 1 sec: 0.158554 0.157290 (    ) ph/cm2/s
Energy fluence (15-150 keV)             : 7.10462e-09 ( -5.3179e-09  8.19638e-09 ) ergs/cm2
Band function

Time interval is from   -0.494 sec. to    0.506 sec.
 Parameter 3 is pegged at 6.88905 due to zero or negative pivot element, likely
 caused by the fit being insensitive to the parameter.


Spectral model in the Band function:
------------------------------------------------------------
Parameters  : value       lower 90%   higher 90%
alpha       : 4.86464   ( -6.85619   -4.86464 )
beta        : -9.37155    ( 9.37155   19.354 )
Epeak [keV] : 29.3110      ( -14.16 20.5382 )
Norm@50keV   : 78.5042    (     )
------------------------------------------------------------

Photon flux (15-150 keV)    in 1 sec:  (    ) ph/cm2/s
Energy fluence (15-150 keV)             : 0 ( 0  0 ) ergs/cm2
Single BB

Spectral model blackbody:
------------------------------------------------------------
Parameters  : value    Lower 90%  Upper 90%
kT [keV]    : 7.22059  (-4.34171  7.65669)
R^2/D10^2   : 0.332522  (-0.330754   16.6594)
(R is the radius in km and D10 is the distance to the source in units of 10 kpc)
------------------------------------------------------------
#Fit statistic  : Chi-Squared                   63.33     using 59 bins.
 Reduced chi-squared =
# Null hypothesis probability of 2.63e-01 with 57 degrees of freedom

Energy  Fluence     90% Error
[keV]   [erg/cm2]   [erg/cm2]
15- 25  2.873e-09   1.989e-09
25- 50  4.175e-09   3.211e-09
50-150  7.731e-10   7.325e-10
15-150  7.821e-09   5.285e-09
Thermal bremsstrahlung (OTTB)

Spectral model: thermal bremsstrahlung
------------------------------------------------------------
Parameters  : value         Lower 90%    Upper 90%
kT [keV]    : 25.8611       (-25.3038      -25.3038)
Norm        : 1.64806       (-1.65252     65.2105)
------------------------------------------------------------
#Fit statistic  : Chi-Squared                   63.84     using 59 bins.
 Reduced chi-squared =
# Null hypothesis probability of 2.49e-01 with 57 degrees of freedom

Energy  Fluence     90% Error
[keV]   [erg/cm2]   [erg/cm2]
15- 25  3.084e-09   2.314e-09
25- 50  3.229e-09   2.499e-09
50-150  1.442e-09   1.526e-09
15-150  7.756e-09   6.545e-09
Double BB

Spectral model: bbodyrad<1> + bbodyrad<2>
------------------------------------------------------------
Parameters  : value         Lower 90%    Upper 90%
kT1 [keV]   : 0.423538        (-7.24612      -7.24612)
R1^2/D10^2  : 2.56399E+12        (-2.90894e+12      4.09925e+16)
kT2 [keV]   : 7.54452        (-4.42966      8.91973)
R2^2/D10^2  : 0.266293    (-0.259467   11.3364)
------------------------------------------------------------
#Fit statistic  : Chi-Squared                   63.15     using 59 bins.
 Reduced chi-squared =
# Null hypothesis probability of 2.11e-01 with 55 degrees of freedom

Energy  Fluence     90% Error
[keV]   [erg/cm2]   [erg/cm2]
15- 25  2.876e-09   6.335e-02
25- 50  4.178e-09   5.275e-01
50-150  7.730e-10   1.355e+01
15-150  7.827e-09   1.331e+01
Pre-slew spectrum (Pre-slew PHA with pre-slew DRM)
Power-law model
Spectral model in power-law:
------------------------------------------------------------
Parameters  : value       lower 90%   higher 90%
Photon index: 2.67881     ( -0.488924   0.615318 )
Norm@50keV  : 3.05123E-02    ( -0.013326   0.0134304 )
------------------------------------------------------------
#Fit statistic  : Chi-Squared                   51.76     using 59 bins.
 Reduced chi-squared =
# Null hypothesis probability of 6.71e-01 with 57 degrees of freedom

Photon flux (15-150 keV)    in 0.016 sec: 6.71525 ( -1.80967  1.80977 ) ph/cm2/s
Energy fluence (15-150 keV)             : 5.15618e-09 ( -1.60088e-09  1.68406e-09 ) ergs/cm2
Cutoff power-law model
Spectral model in the cutoff power-law:
------------------------------------------------------------
Parameters  : value       lower 90%   higher 90%
Photon index: -1.41012     ( -5.4983   3.20643 )
Epeak [keV] : 28.6635      ( -19.0875 6.69456 )
Norm@50keV  : 13.5743    ( -16.2186   46638.1 )
------------------------------------------------------------
#Fit statistic  : Chi-Squared                   47.21     using 59 bins.
 Reduced chi-squared =
# Null hypothesis probability of 7.92e-01 with 56 degrees of freedom

Photon flux (15-150 keV)    in 0.016 sec: 6.75278 ( -1.78221  1.78533 ) ph/cm2/s
Energy fluence (15-150 keV)             : 4.86717e-09 ( -1.33637e-09  1.35846e-09 ) ergs/cm2
Band function

XSPEC12>exit
 XSPEC: quit


Spectral model in the Band function:
------------------------------------------------------------
Parameters  : value       lower 90%   higher 90%
alpha       : 1.70536   ( -3.19263   -1.43437 )
beta        : -10.0000    ( 10   2.13163e-14 )
Epeak [keV] : 29.3435      ( -5.99461 5.83307 )
Norm@50keV   : 20.1346    ( -17.0125   1998.93 )
------------------------------------------------------------

Photon flux (15-150 keV)    in 0.016 sec:  (    ) ph/cm2/s
Energy fluence (15-150 keV)             : 0 ( 0  0 ) ergs/cm2
S(25-50 keV) vs. S(50-100 keV) plot

S(25-50 keV)  = 1.73e-09
S(50-100 keV) = 1.08e-09
T90 vs. Hardness ratio plot

T90                                   = 0.0119999647140503 sec.
Hardness ratio (energy fluence ratio) = 0.624277
Color vs. Color plot

Count Ratio  (25-50 keV) / (15-25 keV) = 1.17734
Count Ratio (50-100 keV) / (15-25 keV) = 0.159417
Mask shadow pattern

IMX = -1.657289115721856E-04, IMY = -2.585411986132202E-05
TIME vs. PHA plot around the trigger time

Blue+Cyan dotted lines: Time interval of the scaled map
From 0.000000 to 0.008000
TIME vs. DetID plot around the trigger time

Blue+Cyan dotted lines: Time interval of the scaled map
From 0.000000 to 0.008000
100 us light curve (15-350 keV)

Blue+Cyan dotted lines: Time interval of the scaled map
From 0.000000 to 0.008000
Spacecraft aspect plot

Bright source in the pre-burst/pre-slew/post-slew images
Pre-burst image of 15-350 keV band
Time interval of the image:
-60.192000 -0.004000

# RAcent  DECcent POSerr Theta    Phi  PeakCts   SNR AngSep     Name
#  [deg]    [deg]    ['] [deg]  [deg]                   [']
170.2944 -60.7472    5.6  35.7  -87.0   0.6261   2.1    7.5	Cen X-3
186.6174 -62.6364    4.8  27.8  -87.0   0.4071   2.4    8.1	GX 301-2
244.9824 -15.6447    1.0  38.7   51.5   3.3204  11.1    0.3	Sco X-1
256.0394 -38.0273    8.8  19.9   85.3   0.1900   1.3   11.3	4U 1700-377
256.1838 -36.4643    0.0  21.3   83.4  -0.3626  -2.4   12.4	GX 349+2
262.9934 -24.9082    5.4  34.3   83.3   0.6171   2.2    9.8	GX 1+4
264.5050 -44.5251    6.0  19.2  112.6  -0.2632  -1.9   11.1	4U 1735-44
270.3172 -25.2108   10.9  37.1   93.6  -0.3748  -1.1    8.1	GX 5-1
270.3237 -25.5838    9.1  36.8   93.9   0.4258   1.3    9.6	GRS 1758-258
275.9411 -30.4014    9.8  35.6  105.4   0.3222   1.2    2.2	H1820-303
263.0165 -33.8441   24.1  26.5   91.9   0.0850   0.5    1.5	GX 354-0
331.1891 -58.5664    2.1  47.3  176.8   1.3694   5.5 ------	UNKNOWN
207.0991 -26.5824    2.4  36.0  -11.1   0.7010   4.8 ------	UNKNOWN
Pre-slew background subtracted image of 15-350 keV band
Time interval of the image:
-0.004000 0.012000

# RAcent  DECcent POSerr Theta    Phi  PeakCts   SNR AngSep     Name
#  [deg]    [deg]    ['] [deg]  [deg]                   [']
170.0231 -60.7060   18.1  35.9  -87.0   0.0044   0.6    9.9	Cen X-3
186.6615 -62.6930    3.8  27.8  -87.1  -0.0120  -3.0    4.6	GX 301-2
245.1828 -15.6508    7.8  38.8   51.8   0.0094   1.5   11.8	Sco X-1
256.1635 -37.8913    6.7  20.1   85.3   0.0051   1.7    8.8	4U 1700-377
256.4275 -36.2359    8.6  21.6   83.5  -0.0041  -1.3   11.2	GX 349+2
262.9934 -24.7610   24.7  34.4   83.2   0.0028   0.5    1.3	GX 1+4
264.8654 -44.4877    4.1  19.4  113.0   0.0080   2.8    5.7	4U 1735-44
270.3268 -25.1945    3.8  37.2   93.6   0.0236   3.0    7.3	GX 5-1
270.4383 -25.7667    5.8  36.7   94.2   0.0146   2.0    7.5	GRS 1758-258
276.0568 -30.4182    6.8  35.7  105.6  -0.0099  -1.7    7.5	H1820-303
262.9364 -33.9149   22.1  26.4   91.9   0.0021   0.5    5.5	GX 354-0
230.9753 -27.8767    2.1  26.8   26.5   0.0159   5.5 ------	UNKNOWN
238.7725 -54.0846    1.7   0.0  164.1   0.0173   6.8 ------	UNKNOWN
Post-slew image of 15-350 keV band
Time interval of the image:
Plot creation:
Tue Jun 22 21:33:31 EDT 2021