Estimated redshift from machine learning (Ukwatta et al. 2016) - may take a few minute to calcaulte
Image
Pre-slew 15.0-350.0 keV image (Event data)
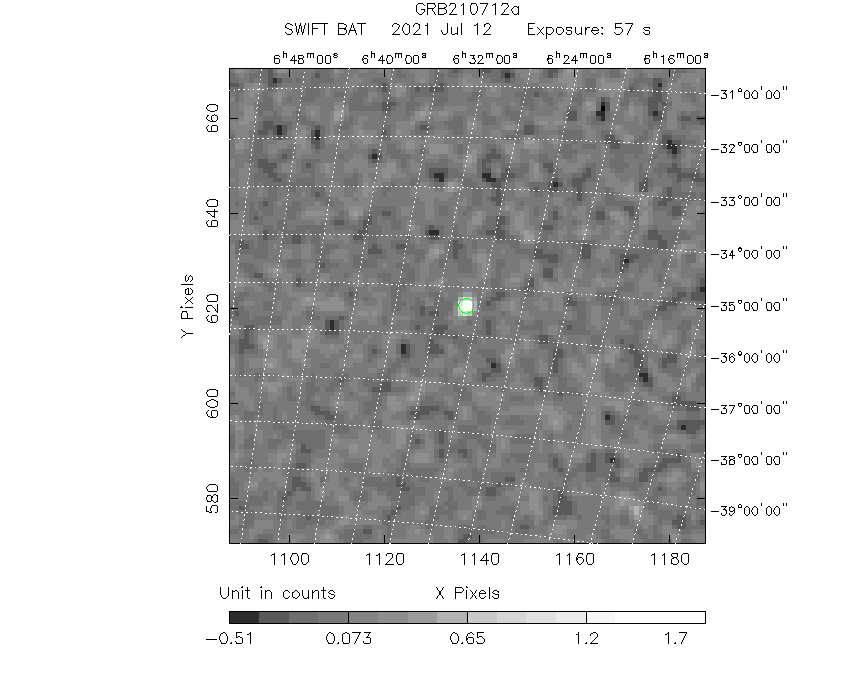
#   RAcent    DECcent   POSerr    Theta     Phi              Peak Cts       SNR   Name
   97.3206   -35.3786   0.0130    31.7968  -150.8061         2.0088879     14.714 TRIG_01059881

Foreground time interval of the image:
-40.076  17.037 (delta_t =  57.113 [sec])
Background time interval of the image:
-239.264 -40.076 (delta_t = 199.188 [sec])
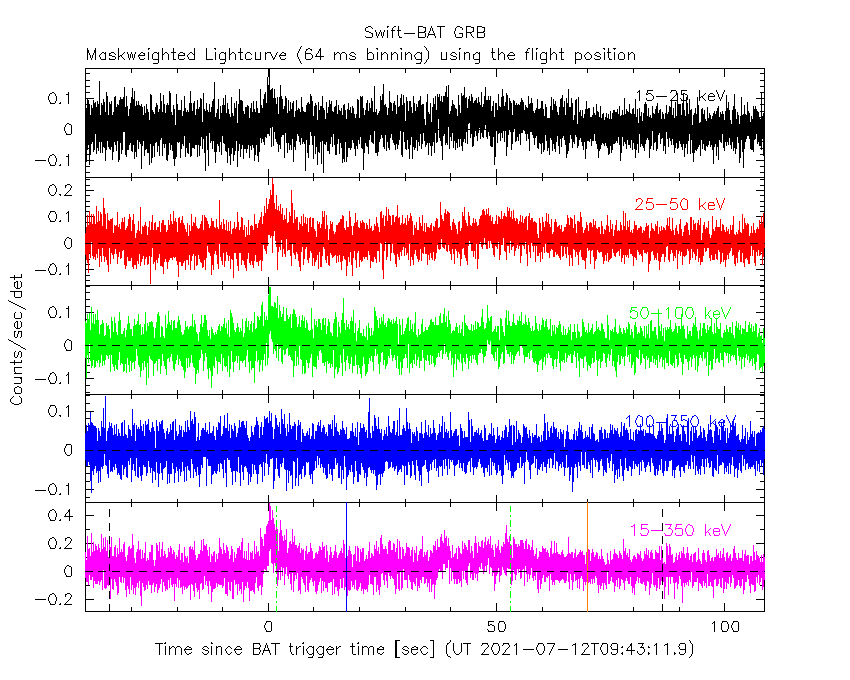
Lightcurves
Notes:
- 1) The mask-weighted light curves are using the flight position.
- 2) Multiple plots of different time binning/intervals are shown to cover all scenarios of short/long GRBs, rate/image triggers, and real/false positives.
- 3) For all the mask-weighted lightcurves, the y-axis units are counts/sec/det where a det is 0.4 x 0.4 = 0.16 sq cm.
- 4) The verticle lines correspond to following: green dotted lines are T50 interval, black dotted lines are T90 interval, blue solid line(s) is a spacecraft slew start time, and orange solid line(s) is a spacecraft slew end time.
- 5) Time of each bin is in the middle of the bin.
1 s binning
From T0-310 s to T0+310 s
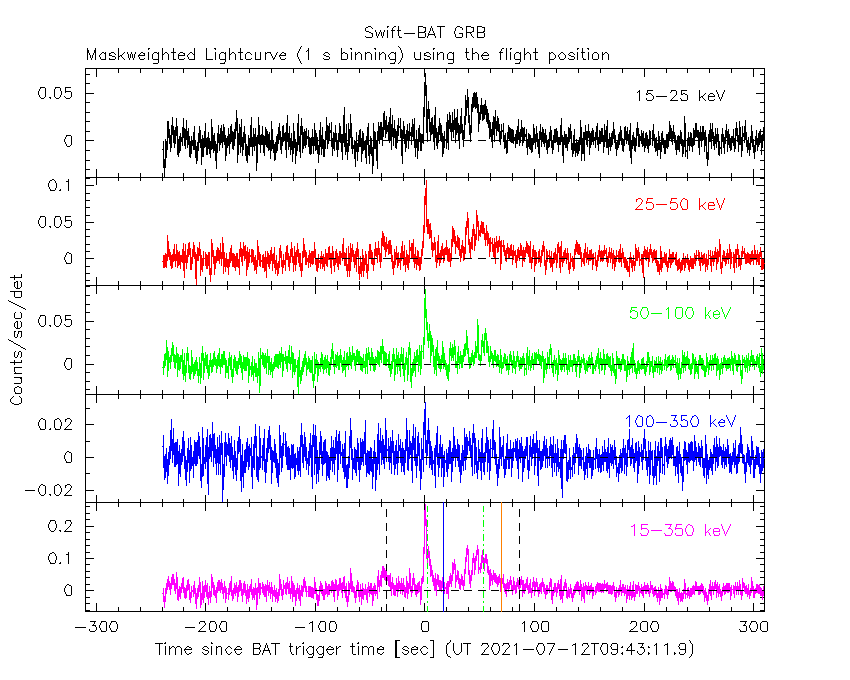
From T100_start - 20 s to T100_end + 30 s

Full time interval

64 ms binning
Full time interval

From T100_start to T100_end
From T0-5 sec to T0+5 sec

16 ms binning
From T100_start-5 s to T100_start+5 s

8 ms binning
From T100_start-3 s to T100_start+3 s

2 ms binning
From T100_start-1 s to T100_start+1 s

SN=5 or 10 sec. binning (whichever binning is satisfied first)

SN=5 or 10 sec. binning (T < 200 sec)

Quad-rate summed light curves (from T0-300s to T0+1000s)

Spectral Evolution

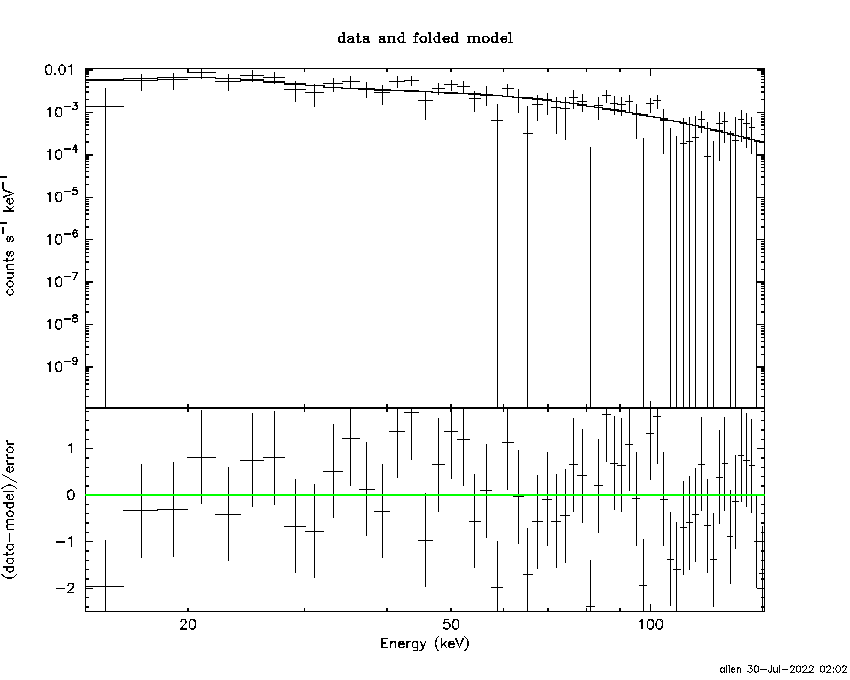
Spectra
Notes:
- 1) The fitting includes the systematic errors.
- 2) When the burst includes telescope slew time periods, the fitting uses an average response file made from multiple 5-s response files through out the slew time plus single time preiod for the non-slew times, and weighted by the total counts in the corresponding time period using addrmf. An average response file is needed becuase a spectral fit using the pre-slew DRM will introduce some errors in both a spectral shape and a normalization if the PHA file contains a lot of the slew/post-slew time interval.
- 3) For fits to more complicated models (e.g. a power-law over a cutoff power-law), the BAT team has decided to require a chi-square improvement of more than 6 for each extra dof.
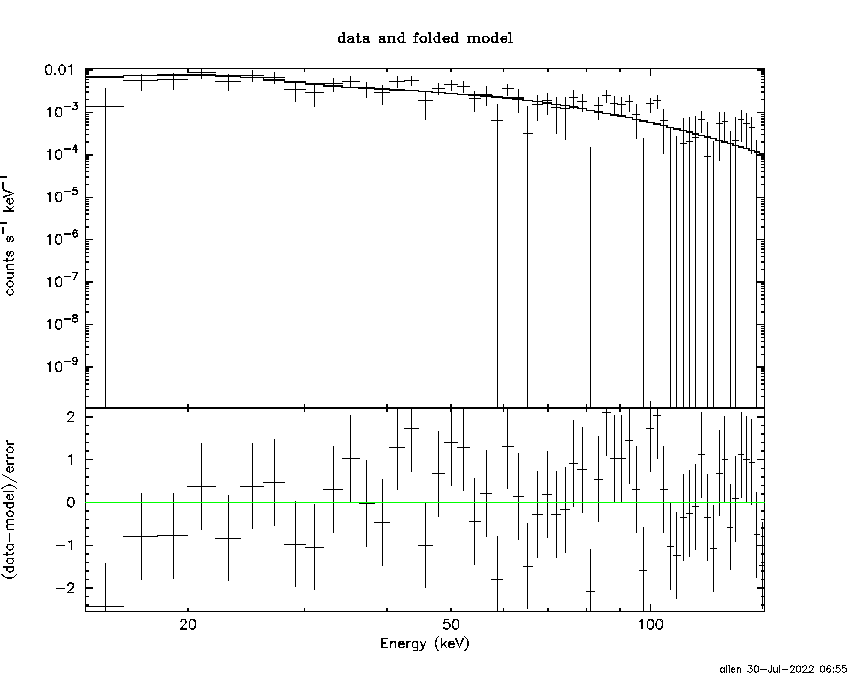
Time averaged spectrum fit using the average DRM
Power-law model

Time interval is from  -40.076 sec. to  108.740 sec.

Spectral model in power-law:
------------------------------------------------------------
Parameters  : value       lower 90%   higher 90%
Photon index: 1.82825     ( -0.101906   0.103493 )
Norm@50keV  : 2.20505E-03    ( -0.000138944   0.000137814 )
------------------------------------------------------------
#Fit statistic  : Chi-Squared                   63.44     using 59 bins.
 Reduced chi-squared = 1.11298
# Null hypothesis probability of 2.60e-01 with 57 degrees of freedom

Photon flux (15-150 keV)    in 148.8 sec: 0.307260 ( -0.017606  0.017627 ) ph/cm2/s
Energy fluence (15-150 keV)             : 3.01859e-06 ( -1.91735e-07  1.93468e-07 ) ergs/cm2
Cutoff power-law model

Time interval is from  -40.076 sec. to  108.740 sec.
Spectral model in the cutoff power-law:
------------------------------------------------------------
Parameters  : value       lower 90%   higher 90%
Photon index: 1.09888     ( -0.513994   0.453431 )
Epeak [keV] : 54.6026      ( -8.30257 20.782 )
Norm@50keV  : 5.55578E-03    ( -0.00239209   0.00506099 )
------------------------------------------------------------
#Fit statistic  : Chi-Squared                   55.38     using 59 bins.
 Reduced chi-squared = 0.988929
# Null hypothesis probability of 4.98e-01 with 56 degrees of freedom

Photon flux (15-150 keV)    in 148.8 sec: 0.296274 ( -0.018802  0.018802 ) ph/cm2/s
Energy fluence (15-150 keV)             : 2.80281e-06 ( -2.24871e-07  2.29912e-07 ) ergs/cm2
Band function

Time interval is from  -40.076 sec. to  108.740 sec.


Spectral model in the Band function:
------------------------------------------------------------
Parameters  : value       lower 90%   higher 90%
alpha       :    (     )
beta        :     (     )
Epeak [keV] :       (   )
Norm@50keV   :     (     )
------------------------------------------------------------

Photon flux (15-150 keV)    in  sec:  (    ) ph/cm2/s
Energy fluence (15-150 keV)             : 0 ( 0  0 ) ergs/cm2
Single BB

Spectral model blackbody:
------------------------------------------------------------
Parameters  : value    Lower 90%  Upper 90%
kT [keV]    : 11.3557  (-0.723165  0.781796)
R^2/D10^2   : 8.92526E-02  (-0.0199967   0.0254493)
(R is the radius in km and D10 is the distance to the source in units of 10 kpc)
------------------------------------------------------------
#Fit statistic  : Chi-Squared                   99.59     using 59 bins.
 Reduced chi-squared =
# Null hypothesis probability of 4.15e-04 with 57 degrees of freedom

Energy  Fluence     90% Error
[keV]   [erg/cm2]   [erg/cm2]
15- 25  3.598e-07   3.482e-08
25- 50  1.059e-06   7.314e-08
50-150  7.903e-07   1.092e-07
15-150  2.209e-06   1.466e-07
Thermal bremsstrahlung (OTTB)

Spectral model: thermal bremsstrahlung
------------------------------------------------------------
Parameters  : value         Lower 90%    Upper 90%
kT [keV]    : 91.3459       (-16.7822      23.7041)
Norm        : 1.38550       (-0.114897     0.128733)
------------------------------------------------------------
#Fit statistic  : Chi-Squared                   55.75     using 59 bins.
 Reduced chi-squared =
# Null hypothesis probability of 5.22e-01 with 57 degrees of freedom

Energy  Fluence     90% Error
[keV]   [erg/cm2]   [erg/cm2]
15- 25  5.382e-07   5.245e-08
25- 50  9.132e-07   5.454e-08
50-150  1.403e-06   4.396e-07
15-150  2.854e-06   4.442e-07
Double BB

Spectral model: bbodyrad<1> + bbodyrad<2>
------------------------------------------------------------
Parameters  : value         Lower 90%    Upper 90%
kT1 [keV]   : 7.62263        (-1.43047      1.18588)
R1^2/D10^2  : 0.287590        (-0.109915      0.254311)
kT2 [keV]   : 24.6374        (-6.36994      13.4024)
R2^2/D10^2  : 3.08835E-03    (-0.00241835   0.00750066)
------------------------------------------------------------
#Fit statistic  : Chi-Squared                   54.84     using 59 bins.
 Reduced chi-squared =
# Null hypothesis probability of 4.81e-01 with 55 degrees of freedom

Energy  Fluence     90% Error
[keV]   [erg/cm2]   [erg/cm2]
15- 25  4.816e-07   8.526e-08
25- 50  9.702e-07   1.916e-07
50-150  1.395e-06   6.296e-07
15-150  2.847e-06   8.077e-07
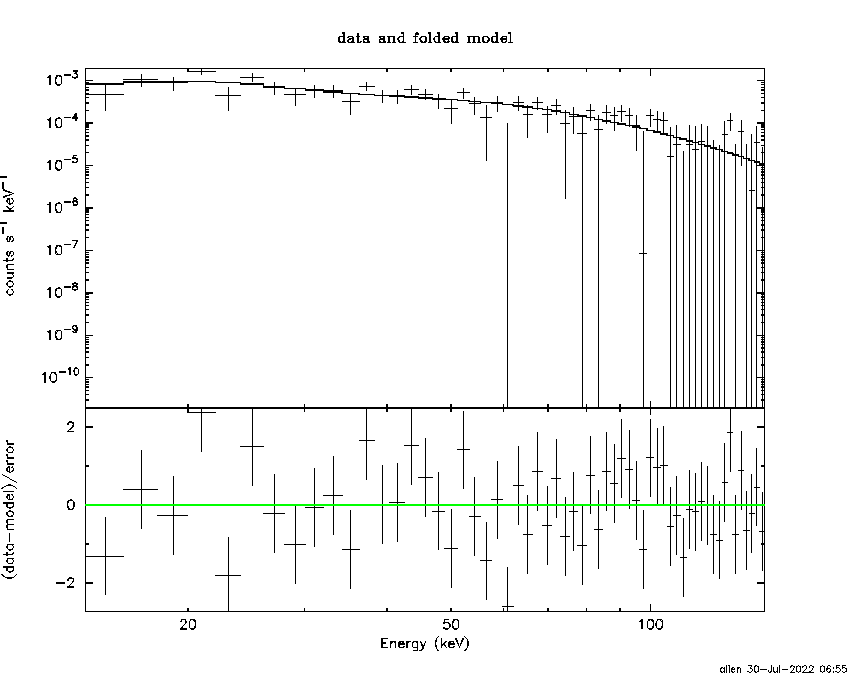
Peak spectrum fit
Power-law model
Time interval is from    0.088 sec. to    1.088 sec.

Spectral model in power-law:
------------------------------------------------------------
Parameters  : value       lower 90%   higher 90%
Photon index: 1.29130     ( -0.187622   0.18543 )
Norm@50keV  : 1.89953E-02    ( -0.00215414   0.00215205 )
------------------------------------------------------------
#Fit statistic  : Chi-Squared                   63.06     using 59 bins.
 Reduced chi-squared = 1.10632
# Null hypothesis probability of 2.71e-01 with 57 degrees of freedom

Photon flux (15-150 keV)    in 1 sec: 2.26262 ( -0.26213  0.26256 ) ph/cm2/s
Energy fluence (15-150 keV)             : 1.88131e-07 ( -2.34286e-08  2.36076e-08 ) ergs/cm2
Cutoff power-law model

Time interval is from    0.088 sec. to    1.088 sec.
Spectral model in the cutoff power-law:
------------------------------------------------------------
Parameters  : value       lower 90%   higher 90%
Photon index: 0.673076     ( -0.866308   0.687572 )
Epeak [keV] : 109.557      ( -37.8387 -109.558 )
Norm@50keV  : 3.87457E-02    ( -0.0206344   0.064246 )
------------------------------------------------------------
#Fit statistic  : Chi-Squared                   60.90     using 59 bins.
 Reduced chi-squared = 1.0875
# Null hypothesis probability of 3.04e-01 with 56 degrees of freedom

Photon flux (15-150 keV)    in 1 sec: 2.21741 ( -0.26835  0.26819 ) ph/cm2/s
Energy fluence (15-150 keV)             : 1.80393e-07 ( -2.58355e-08  2.55561e-08 ) ergs/cm2
Band function

Time interval is from    0.088 sec. to    1.088 sec.


Spectral model in the Band function:
------------------------------------------------------------
Parameters  : value       lower 90%   higher 90%
alpha       :    (     )
beta        :     (     )
Epeak [keV] :       (   )
Norm@50keV   :     (     )
------------------------------------------------------------

Photon flux (15-150 keV)    in  sec:  (    ) ph/cm2/s
Energy fluence (15-150 keV)             : 0 ( 0  0 ) ergs/cm2
Single BB

Spectral model blackbody:
------------------------------------------------------------
Parameters  : value    Lower 90%  Upper 90%
kT [keV]    : 16.3416  (-2.31135  2.84691)
R^2/D10^2   : 0.202224  (-0.0853723   0.139873)
(R is the radius in km and D10 is the distance to the source in units of 10 kpc)
------------------------------------------------------------
#Fit statistic  : Chi-Squared                   73.30     using 59 bins.
 Reduced chi-squared =
# Null hypothesis probability of 7.18e-02 with 57 degrees of freedom

Energy  Fluence     90% Error
[keV]   [erg/cm2]   [erg/cm2]
15- 25  1.111e-08   2.452e-09
25- 50  4.760e-08   8.095e-09
50-150  8.955e-08   2.064e-08
15-150  1.483e-07   2.555e-08
Thermal bremsstrahlung (OTTB)
Spectral model: thermal bremsstrahlung
------------------------------------------------------------
Parameters  : value         Lower 90%    Upper 90%
kT [keV]    : 200.000       (-40.4339      -200)
Norm        : 9.40498       (-1.07248     1.07248)
------------------------------------------------------------
#Fit statistic  : Chi-Squared                   66.61     using 59 bins.
 Reduced chi-squared =
# Null hypothesis probability of 1.80e-01 with 57 degrees of freedom

Energy  Fluence     90% Error
[keV]   [erg/cm2]   [erg/cm2]
15- 25  2.342e-08   1.301e-08
25- 50  4.505e-08   2.499e-08
50-150  9.879e-08   5.470e-08
15-150  1.672e-07   9.170e-08
Double BB

Spectral model: bbodyrad<1> + bbodyrad<2>
------------------------------------------------------------
Parameters  : value         Lower 90%    Upper 90%
kT1 [keV]   : 9.65963        (-2.89561      3.23342)
R1^2/D10^2  : 0.812719        (-0.451474      1.4088)
kT2 [keV]   : 36.2331        (-25.9846      159.51)
R2^2/D10^2  : 1.01541E-02    (-0.00987803   0.0420189)
------------------------------------------------------------
#Fit statistic  : Chi-Squared                   58.52     using 59 bins.
 Reduced chi-squared =
# Null hypothesis probability of 3.48e-01 with 55 degrees of freedom

Energy  Fluence     90% Error
[keV]   [erg/cm2]   [erg/cm2]
15- 25  1.709e-08   8.867e-09
25- 50  4.827e-08   2.486e-08
50-150  1.196e-07   6.593e-08
15-150  1.849e-07   8.725e-08
Pre-slew spectrum (Pre-slew PHA with pre-slew DRM)
Power-law model

Spectral model in power-law:
------------------------------------------------------------
Parameters  : value       lower 90%   higher 90%
Photon index: 1.57473     ( -0.17532   0.17654 )
Norm@50keV  : 2.26251E-03    ( -0.000239783   0.000238047 )
------------------------------------------------------------
#Fit statistic  : Chi-Squared                   57.88     using 59 bins.
 Reduced chi-squared =
# Null hypothesis probability of 4.42e-01 with 57 degrees of freedom

Photon flux (15-150 keV)    in 57.11 sec: 0.288513 ( -0.0298298  0.0298737 ) ph/cm2/s
Energy fluence (15-150 keV)             : 1.21229e-06 ( -1.37837e-07  1.39332e-07 ) ergs/cm2
Cutoff power-law model
Spectral model in the cutoff power-law:
------------------------------------------------------------
Parameters  : value       lower 90%   higher 90%
Photon index: 1.13451     ( -0.784615   0.563642 )
Epeak [keV] : 93.0758      ( -34.4657 -93.076 )
Norm@50keV  : 3.87103E-03    ( -0.00177836   0.00604591 )
------------------------------------------------------------
#Fit statistic  : Chi-Squared                   56.62     using 59 bins.
 Reduced chi-squared =
# Null hypothesis probability of 4.52e-01 with 56 degrees of freedom

Photon flux (15-150 keV)    in 57.11 sec: 0.283295 ( -0.030936  0.030889 ) ph/cm2/s
Energy fluence (15-150 keV)             : 1.16591e-06 ( -1.55339e-07  1.56082e-07 ) ergs/cm2
Band function

Spectral model in the Band function:
------------------------------------------------------------
Parameters  : value       lower 90%   higher 90%
alpha       :    (     )
beta        :     (     )
Epeak [keV] :       (   )
Norm@50keV   :     (     )
------------------------------------------------------------

Photon flux (15-150 keV)    in  sec:  (    ) ph/cm2/s
Energy fluence (15-150 keV)             : 0 ( 0  0 ) ergs/cm2
S(25-50 keV) vs. S(50-100 keV) plot
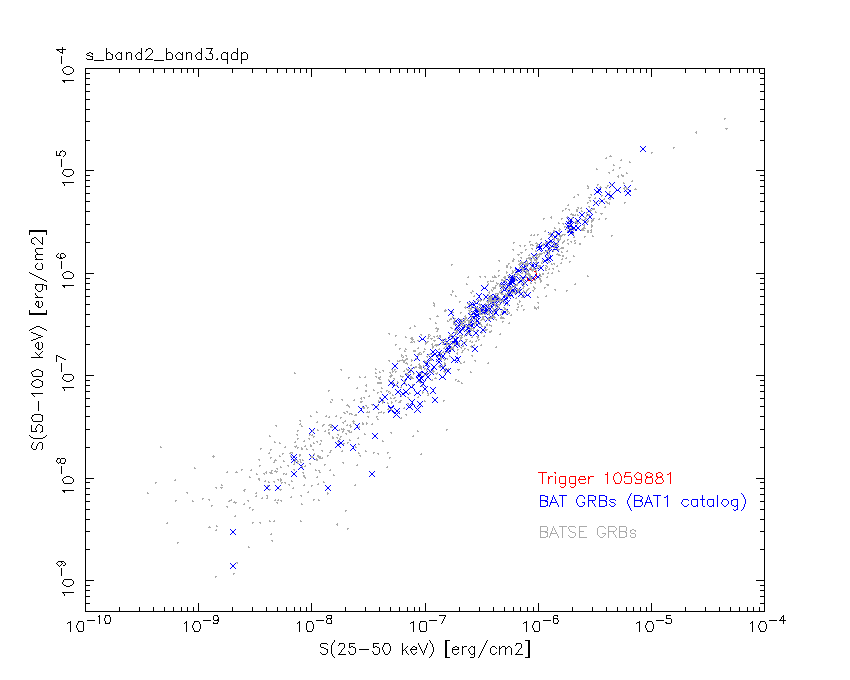
S(25-50 keV)  = 8.59e-07
S(50-100 keV) = 9.67e-07
T90 vs. Hardness ratio plot

T90                                   = 121.283999919891 sec.
Hardness ratio (energy fluence ratio) = 1.12573
Color vs. Color plot

Count Ratio  (25-50 keV) / (15-25 keV) = 1.24982
Count Ratio (50-100 keV) / (15-25 keV) = 0.635289
Mask shadow pattern
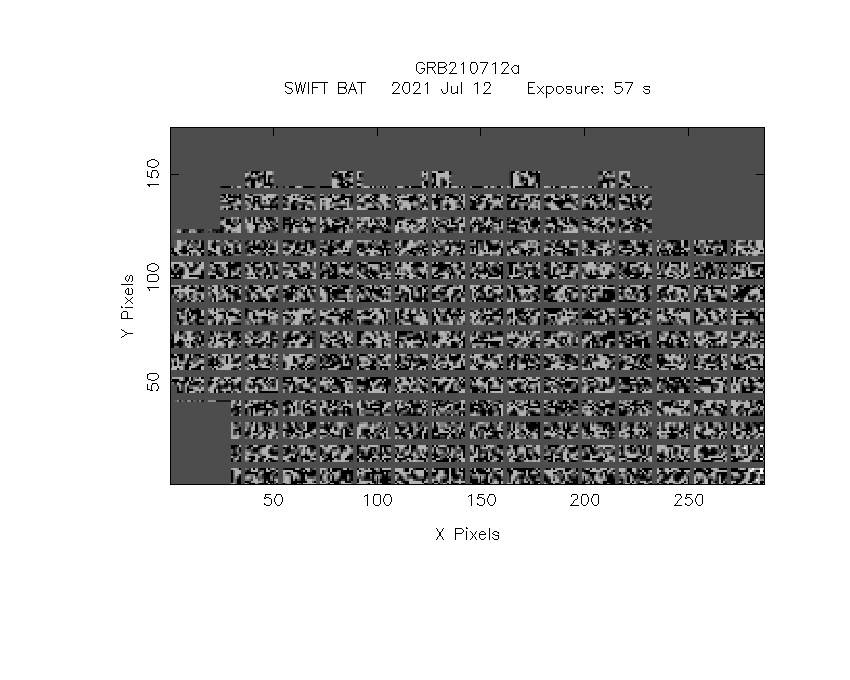
IMX = -5.411982822283098E-01, IMY = 3.023903508242055E-01
TIME vs. PHA plot around the trigger time

TIME vs. DetID plot around the trigger time

100 us light curve (15-350 keV)

Spacecraft aspect plot
Bright source in the pre-burst/pre-slew/post-slew images
Pre-burst image of 15-350 keV band
Time interval of the image:
-239.264000 -40.076000

# RAcent  DECcent POSerr Theta    Phi  PeakCts   SNR AngSep     Name
#  [deg]    [deg]    ['] [deg]  [deg]                   [']
135.5372 -40.5609    0.5   7.9  -77.9   6.0702  24.9    0.5	Vela X-1
169.9114 -60.6254    0.0  22.4   65.3   0.2196   0.7   11.9	Cen X-3
186.6325 -62.7601    1.5  30.5   66.5   3.2598   7.7    0.9	GX 301-2
 54.3139 -41.3423    2.4  56.1  173.7   6.0084   4.7 ------	UNKNOWN
189.3066  -9.9845    2.9  58.1   -3.3   6.6919   4.0 ------	UNKNOWN
124.9573 -12.3130    2.6  37.4  -89.6   3.5771   4.5 ------	UNKNOWN
Pre-slew background subtracted image of 15-350 keV band
Time interval of the image:
-40.076000 17.036600

# RAcent  DECcent POSerr Theta    Phi  PeakCts   SNR AngSep     Name
#  [deg]    [deg]    ['] [deg]  [deg]                   [']
135.6647 -40.6364    4.9   7.8  -77.3   0.2765   2.3    7.9	Vela X-1
170.2122 -60.4557    3.0  22.4   64.8   0.5557   3.9   10.5	Cen X-3
186.6689 -62.8815    5.4  30.5   66.7   0.4564   2.1    6.7	GX 301-2
 97.3206 -35.3786    0.8  31.8 -150.8   2.0089  14.7 ------	UNKNOWN
181.8537  -5.6799    2.6  57.2  -13.4   2.1447   4.5 ------	UNKNOWN
Post-slew image of 15-350 keV band
Time interval of the image:
69.836600 612.036600

# RAcent  DECcent POSerr Theta    Phi  PeakCts   SNR AngSep     Name
#  [deg]    [deg]    ['] [deg]  [deg]                   [']
135.5435 -40.5710    0.4  30.3    5.8  15.2131  25.8    1.2	Vela X-1
 52.9705 -67.7966    2.6  40.8   98.2   8.2865   4.5 ------	UNKNOWN
169.0387 -39.4388    2.5  55.5   11.6  13.9579   4.7 ------	UNKNOWN
157.6391 -12.3991    3.3  58.7  -22.7   9.6970   3.5 ------	UNKNOWN
Plot creation:
Sat Jul 30 06:56:08 EDT 2022