Click here for the BAT GCN circular template
Image
Pre-slew 15.0-350.0 keV image (Event data)
#   RAcent    DECcent   POSerr    Theta     Phi              Peak Cts       SNR   Name
  348.4109    49.3224   0.0245    24.3862   -68.0497         0.6626284      7.828 TRIG_00106106

Foreground time interval of the image:
 -0.324  51.165 (delta_t =  51.489 [sec])
Background time interval of the image:
-119.936  -0.324 (delta_t = 119.612 [sec])
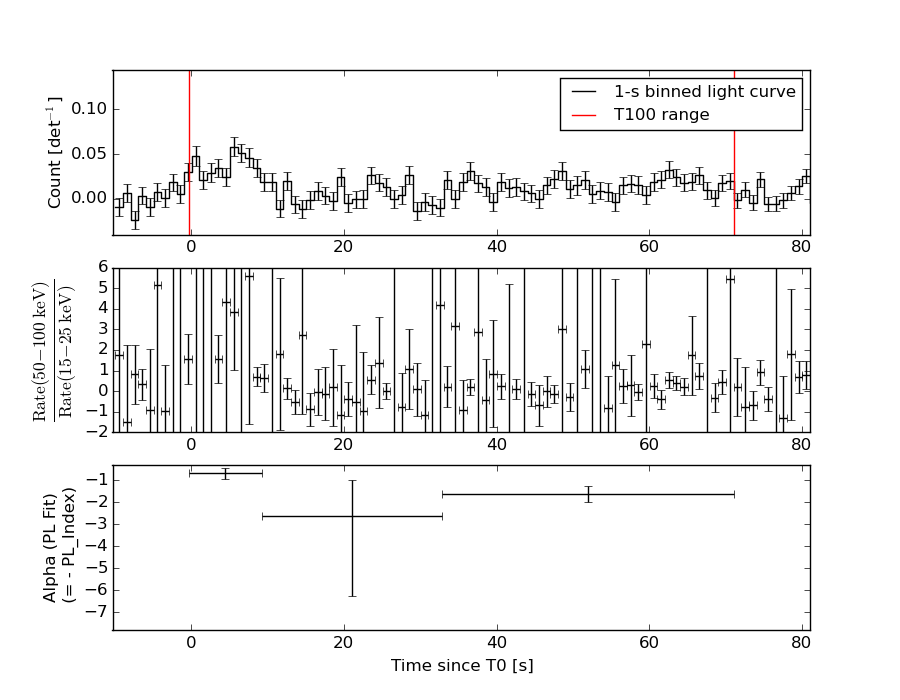
Lightcurves
Notes:
- 1) The mask-weighted light curves are using the flight position.
- 2) Multiple plots of different time binning/intervals are shown to cover all scenarios of short/long GRBs, rate/image triggers, and real/false positives.
- 3) For all the mask-weighted lightcurves, the y-axis units are counts/sec/det where a det is 0.4 x 0.4 = 0.16 sq cm.
- 4) The verticle lines correspond to following: green dotted lines are T50 interval, black dotted lines are T90 interval, blue solid line(s) is a spacecraft slew start time, and orange solid line(s) is a spacecraft slew end time.
- 5) Time of each bin is in the middle of the bin.
1 s binning
From T0-310 s to T0+310 s
From T100_start - 20 s to T100_end + 30 s
Full time interval
64 ms binning
Full time interval
From T100_start to T100_end
From T0-5 sec to T0+5 sec
16 ms binning
From T100_start-5 s to T100_start+5 s
8 ms binning
From T100_start-3 s to T100_start+3 s
2 ms binning
From T100_start-1 s to T100_start+1 s
SN=5 or 10 sec. binning (whichever binning is satisfied first)
SN=5 or 10 sec. binning (T < 200 sec)
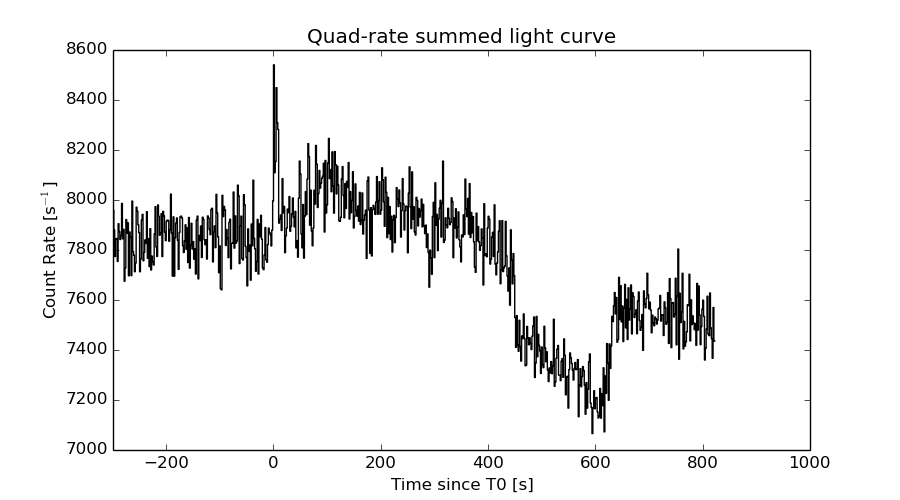
Quad-rate summed light curves (from T0-300s to T0+1000s)
Spectral Evolution
Spectra
Notes:
- 1) The fitting includes the systematic errors.
- 2) When the burst includes telescope slew time periods, the fitting uses an average response file made from multiple 5-s response files through out the slew time plus single time preiod for the non-slew times, and weighted by the total counts in the corresponding time period using addrmf. An average response file is needed becuase a spectral fit using the pre-slew DRM will introduce some errors in both a spectral shape and a normalization if the PHA file contains a lot of the slew/post-slew time interval.
- 3) For fits to more complicated models (e.g. a power-law over a cutoff power-law), the BAT team has decided to require a chi-square improvement of more than 6 for each extra dof.
Time averaged spectrum fit using the average DRM
Power-law model
Time interval is from   -0.324 sec. to   71.068 sec.

Spectral model in power-law:
------------------------------------------------------------
Parameters  : value       lower 90%   higher 90%
Photon index: 1.32620     ( -0.266772   0.261294 )
Norm@50keV  : 9.10793E-04    ( -0.000123989   0.000123682 )
------------------------------------------------------------
#Fit statistic : Chi-Squared =          43.01 using 59 PHA bins.
# Reduced chi-squared =         0.7546 for     57 degrees of freedom
# Null hypothesis probability =   9.149243e-01

Photon flux (15-150 keV)    in 71.39 sec: 0.109202 ( -0.0152447  0.0152876 ) ph/cm2/s
Energy fluence (15-150 keV)             : 6.38521e-07 ( -9.8314e-08  9.94541e-08 ) ergs/cm2
Cutoff power-law model
Time interval is from   -0.324 sec. to   71.068 sec.
Spectral model in the cutoff power-law:
------------------------------------------------------------
Parameters  : value       lower 90%   higher 90%
Photon index: 1.32369     ( -0.287521   0.245266 )
Epeak [keV] : 1.00000E+04      (   )
Norm@50keV  : 9.14343E-04    ( -0.000124702   0.00012354 )
------------------------------------------------------------
#Fit statistic : Chi-Squared =          43.04 using 59 PHA bins.
# Reduced chi-squared =         0.7686 for     56 degrees of freedom
# Null hypothesis probability =   8.979407e-01

Photon flux (15-150 keV)    in 71.39 sec: 0.109655 ( -0.0158853  0.014899 ) ph/cm2/s
Energy fluence (15-150 keV)             : 6.37158e-07 ( -9.56762e-08  9.86803e-08 ) ergs/cm2
Band function
Time interval is from   -0.324 sec. to   71.068 sec.

Spectral model in the Band function:
------------------------------------------------------------
Parameters  : value       lower 90%   higher 90%
alpha       : 4.98137   ( -4.98137   -4.98137 )
beta        : -1.36529    ( -0.292871   0.283404 )
Epeak [keV] : 22.2715      ( -22.2715 7.45007 )
Norm@50keV   : 162.595    ( -21.9458   394140 )
------------------------------------------------------------
#Fit statistic : Chi-Squared =          42.74 using 59 PHA bins.
# Reduced chi-squared =         0.7771 for     55 degrees of freedom
# Null hypothesis probability =   8.857697e-01

Photon flux (15-150 keV)    in 71.39 sec:  (    ) ph/cm2/s
Energy fluence (15-150 keV)             : 0 ( 0  0 ) ergs/cm2
Single BB
Spectral model blackbody:
------------------------------------------------------------
Parameters  : value    Lower 90%  Upper 90%
kT [keV]    : 18.7937  (-4.82186  6.76941)
R^2/D10^2   : 5.56286E-03  (-0.00548336   0.00945709)
(R is the radius in km and D10 is the distance to the source in units of 10 kpc)
------------------------------------------------------------
#Fit statistic : Chi-Squared =          71.06 using 59 PHA bins.
# Reduced chi-squared =          1.247 for     57 degrees of freedom
# Null hypothesis probability =   9.967855e-02

Energy  Fluence     90% Error
[keV]   [erg/cm2]   [erg/cm2]
15- 25  2.768e-08   8.849e-09
25- 50  1.321e-07   3.680e-08
50-150  3.422e-07   9.588e-08
15-150  5.019e-07   1.244e-07
Thermal bremsstrahlung (OTTB)
Spectral model: thermal bremsstrahlung
------------------------------------------------------------
Parameters  : value         Lower 90%    Upper 90%
kT [keV]    : 200.000       (      )
Norm        : 0.449206       (-0.0615939     0.0615878)
------------------------------------------------------------
#Fit statistic : Chi-Squared =          47.23 using 59 PHA bins.
# Reduced chi-squared =         0.8287 for     57 degrees of freedom
# Null hypothesis probability =   8.184304e-01

Energy  Fluence     90% Error
[keV]   [erg/cm2]   [erg/cm2]
15- 25  7.989e-08   4.523e-08
25- 50  1.537e-07   8.681e-08
50-150  3.370e-07   1.885e-07
15-150  5.706e-07   3.159e-07
Double BB
Spectral model: bbodyrad<1> + bbodyrad<2>
------------------------------------------------------------
Parameters  : value         Lower 90%    Upper 90%
kT1 [keV]   : 6.71826        (-1.53127      2.02934)
R1^2/D10^2  : 0.159098        (-0.0992848      0.273113)
kT2 [keV]   : 51.3724        (-20.0906      -51.3724)
R2^2/D10^2  : 2.55177E-04    (-0.000223263   0.000419145)
------------------------------------------------------------
#Fit statistic : Chi-Squared =          36.83 using 59 PHA bins.
# Reduced chi-squared =         0.6696 for     55 degrees of freedom
# Null hypothesis probability =   9.716817e-01

Energy  Fluence     90% Error
[keV]   [erg/cm2]   [erg/cm2]
15- 25  8.390e-08   4.561e-08
25- 50  1.368e-07   6.047e-08
50-150  4.829e-07   2.562e-07
15-150  7.036e-07   3.319e-07
Peak spectrum fit
Power-law model
Time interval is from    5.620 sec. to    6.620 sec.

Spectral model in power-law:
------------------------------------------------------------
Parameters  : value       lower 90%   higher 90%
Photon index: 0.787459     ( -0.510085   0.439857 )
Norm@50keV  : 4.26827E-03    ( -0.00118319   0.00112241 )
------------------------------------------------------------
#Fit statistic : Chi-Squared =          53.68 using 59 PHA bins.
# Reduced chi-squared =         0.9418 for     57 degrees of freedom
# Null hypothesis probability =   6.002816e-01

Photon flux (15-150 keV)    in 1 sec: 0.490791 ( -0.126383  0.128212 ) ph/cm2/s
Energy fluence (15-150 keV)             : 5.01434e-08 ( -1.26287e-08  1.27341e-08 ) ergs/cm2
Cutoff power-law model
Time interval is from    5.620 sec. to    6.620 sec.
Spectral model in the cutoff power-law:
------------------------------------------------------------
Parameters  : value       lower 90%   higher 90%
Photon index: 0.670095     ( -2.10114   -0.669589 )
Epeak [keV] : 691.320      ( -690.536 -690.536 )
Norm@50keV  : 4.77717E-03    ( -0.00145993   0.0230203 )
------------------------------------------------------------
#Fit statistic : Chi-Squared =          53.67 using 59 PHA bins.
# Reduced chi-squared =         0.9583 for     56 degrees of freedom
# Null hypothesis probability =   5.637145e-01

Photon flux (15-150 keV)    in 1 sec: 0.488352 ( -0.129723  0.1298 ) ph/cm2/s
Energy fluence (15-150 keV)             : 4.99393e-08 ( -1.32645e-08  1.29172e-08 ) ergs/cm2
Band function
Time interval is from    5.620 sec. to    6.620 sec.

Spectral model in the Band function:
------------------------------------------------------------
Parameters  : value       lower 90%   higher 90%
alpha       : 5.00000   ( -5   -5 )
beta        : -0.929080    ( -0.543982   0.552344 )
Epeak [keV] : 31.0783      ( -31.073 19.5864 )
Norm@50keV   : 76.4811    ( -18.2261   790307 )
------------------------------------------------------------
#Fit statistic : Chi-Squared =          52.52 using 59 PHA bins.
# Reduced chi-squared =         0.9550 for     55 degrees of freedom
# Null hypothesis probability =   5.698526e-01

Photon flux (15-150 keV)    in 1 sec:  (    ) ph/cm2/s
Energy fluence (15-150 keV)             : 0 ( 0  0 ) ergs/cm2
Single BB
Spectral model blackbody:
------------------------------------------------------------
Parameters  : value    Lower 90%  Upper 90%
kT [keV]    : 28.1282  (-8.73437  17.2008)
R^2/D10^2   : 8.65870E-03  (-0.00865365   0.0181243)
(R is the radius in km and D10 is the distance to the source in units of 10 kpc)
------------------------------------------------------------
#Fit statistic : Chi-Squared =          56.14 using 59 PHA bins.
# Reduced chi-squared =         0.9848 for     57 degrees of freedom
# Null hypothesis probability =   5.074724e-01

Energy  Fluence     90% Error
[keV]   [erg/cm2]   [erg/cm2]
15- 25  1.114e-09   6.767e-10
25- 50  6.686e-09   3.762e-09
50-150  3.821e-08   2.179e-08
15-150  4.601e-08   2.613e-08
Thermal bremsstrahlung (OTTB)
Spectral model: thermal bremsstrahlung
------------------------------------------------------------
Parameters  : value         Lower 90%    Upper 90%
kT [keV]    : 200.000       (      )
Norm        : 2.02418       (-0.535716     0.53565)
------------------------------------------------------------
#Fit statistic : Chi-Squared =          61.71 using 59 PHA bins.
# Reduced chi-squared =          1.083 for     57 degrees of freedom
# Null hypothesis probability =   3.113551e-01

Energy  Fluence     90% Error
[keV]   [erg/cm2]   [erg/cm2]
15- 25  5.045e-09   3.113e-09
25- 50  9.704e-09   5.910e-09
50-150  2.128e-08   1.299e-08
15-150  3.603e-08   2.154e-08
Double BB
Spectral model: bbodyrad<1> + bbodyrad<2>
------------------------------------------------------------
Parameters  : value         Lower 90%    Upper 90%
kT1 [keV]   : 8.28851        (-4.0565      16.1717)
R1^2/D10^2  : 0.201593        (-0.193378      2.62222)
kT2 [keV]   : 43.0814        (-40.9731      -43.108)
R2^2/D10^2  : 2.32652E-03    (-0.00229388   0.00605262)
------------------------------------------------------------
#Fit statistic : Chi-Squared =          52.88 using 59 PHA bins.
# Reduced chi-squared =         0.9614 for     55 degrees of freedom
# Null hypothesis probability =   5.561631e-01

Energy  Fluence     90% Error
[keV]   [erg/cm2]   [erg/cm2]
15- 25  3.096e-09   1.942e-09
25- 50  8.451e-09   4.768e-09
50-150  3.978e-08   2.256e-08
15-150  5.133e-08   2.706e-08
Pre-slew spectrum (Pre-slew PHA with pre-slew DRM)
Power-law model
Spectral model in power-law:
------------------------------------------------------------
Parameters  : value       lower 90%   higher 90%
Photon index: 1.20230     ( -0.321755   0.30573 )
Norm@50keV  : 9.10885E-04    ( -0.000147274   0.000147051 )
------------------------------------------------------------
#Fit statistic : Chi-Squared =          53.31 using 59 PHA bins.
# Reduced chi-squared =         0.9353 for     57 degrees of freedom
# Null hypothesis probability =   6.142913e-01

Photon flux (15-150 keV)    in 51.49 sec: 0.106953 ( -0.0180442  0.0180913 ) ph/cm2/s
Energy fluence (15-150 keV)             : 4.75524e-07 ( -8.51758e-08  8.61e-08 ) ergs/cm2
Cutoff power-law model
Spectral model in the cutoff power-law:
------------------------------------------------------------
Parameters  : value       lower 90%   higher 90%
Photon index: 1.21557     ( -0.468026   0.29215 )
Epeak [keV] : 9999.36      ( -9999.36 -9999.36 )
Norm@50keV  : 9.10005E-04    ( -0.000147613   0.000508344 )
------------------------------------------------------------
#Fit statistic : Chi-Squared =          53.34 using 59 PHA bins.
# Reduced chi-squared =         0.9525 for     56 degrees of freedom
# Null hypothesis probability =   5.761408e-01

Photon flux (15-150 keV)    in 51.49 sec: 0.107429 ( -0.0274166  0.017646 ) ph/cm2/s
Energy fluence (15-150 keV)             : 4.77005e-07 ( -8.6135e-08  8.09407e-08 ) ergs/cm2
Band function
Spectral model in the Band function:
------------------------------------------------------------
Parameters  : value       lower 90%   higher 90%
alpha       : 4.90565   ( -4.90565   -4.90565 )
beta        : -1.25286    ( -0.404022   0.343596 )
Epeak [keV] : 23.7707      ( -23.7707 11.2472 )
Norm@50keV   : 86.0456    ( -13.8568   334372 )
------------------------------------------------------------
#Fit statistic : Chi-Squared =          52.94 using 59 PHA bins.
# Reduced chi-squared =         0.9625 for     55 degrees of freedom
# Null hypothesis probability =   5.538634e-01

Photon flux (15-150 keV)    in 51.49 sec:  (    ) ph/cm2/s
Energy fluence (15-150 keV)             : 0 ( 0  0 ) ergs/cm2
S(25-50 keV) vs. S(50-100 keV) plot
S(25-50 keV)  = 1.44e-07
S(50-100 keV) = 2.30e-07
T90 vs. Hardness ratio plot
T90                                   = 66.4120000004768 sec.
Hardness ratio (energy fluence ratio) = 1.59722
Color vs. Color plot
Count Ratio  (25-50 keV) / (15-25 keV) = 1.25353
Count Ratio (50-100 keV) / (15-25 keV) = 1.10336
Mask shadow pattern
IMX = 1.694554930874460E-01, IMY = 4.204669412646664E-01
TIME vs. PHA plot around the trigger time
TIME vs. DetID plot around the trigger time
100 us light curve (15-350 keV)
Spacecraft aspect plot
Bright source in the pre-burst/pre-slew/post-slew images
Pre-burst image of 15-350 keV band
Time interval of the image:
-119.936000 -0.324000

# RAcent  DECcent POSerr Theta    Phi  PeakCts   SNR AngSep     Name
#  [deg]    [deg]    ['] [deg]  [deg]                   [']
308.0336  40.9913    7.2  49.5  -41.5   0.6736   1.6    4.2	Cyg X-3
326.0201  38.2619  114.1  43.2  -59.0   0.0391   0.1    8.0	Cyg X-2
 53.7740  53.1575    1.0  16.8  143.3   1.0986  11.2 ------	UNKNOWN
 45.7450  39.9551    2.2  24.7  177.9   0.5070   5.2 ------	UNKNOWN
 33.4168   5.2275    2.2  56.8 -153.3   2.7048   5.3 ------	UNKNOWN
Pre-slew background subtracted image of 15-350 keV band
Time interval of the image:
-0.324000 51.164600

# RAcent  DECcent POSerr Theta    Phi  PeakCts   SNR AngSep     Name
#  [deg]    [deg]    ['] [deg]  [deg]                   [']
308.0382  40.9139    5.3  49.6  -41.6  -0.5848  -2.2    4.0	Cyg X-3
326.3313  38.2240    7.0  43.1  -59.3   0.4074   1.7    9.5	Cyg X-2
257.7175  73.4689    2.0  40.5   15.0   0.6486   5.8 ------	UNKNOWN
 38.0753  29.5359    2.8  33.1 -163.6   0.3189   4.1 ------	UNKNOWN
348.4108  49.3224    1.5  24.4  -68.0   0.6626   7.8 ------	UNKNOWN
Post-slew image of 15-350 keV band
Time interval of the image:
95.964600 302.123600

# RAcent  DECcent POSerr Theta    Phi  PeakCts   SNR AngSep     Name
#  [deg]    [deg]    ['] [deg]  [deg]                   [']
299.5886  35.1992    0.3  38.0  -24.4   6.9257  35.6    0.2	Cyg X-1
308.0407  40.9325    2.0  29.3  -22.6   0.8990   5.7    3.4	Cyg X-3
326.0458  38.4294    7.7  19.4  -47.3   0.2284   1.5    8.8	Cyg X-2
 42.4158  70.3633    3.1  32.5   99.0   1.0659   3.7 ------	UNKNOWN
 32.2905  68.6278    2.8  28.6  100.5   1.0612   4.2 ------	UNKNOWN
294.9228  59.8042    3.2  31.7   18.3   0.5875   3.6 ------	UNKNOWN
327.3993  15.5517    2.9  37.9  -77.1   1.6251   4.0 ------	UNKNOWN
Plot creation:
Sun May 31 17:34:53 EDT 2015