Estimated redshift from machine learning (Ukwatta et al. 2016) - may take a few minute to calcaulte
Image
Pre-slew 15.0-350.0 keV image (Event data)
#   RAcent    DECcent   POSerr    Theta     Phi              Peak Cts       SNR   Name
   27.0307    -6.3472   0.0078    41.5243    -0.5153         2.8098263     24.758 TRIG_01061223

Foreground time interval of the image:
 -4.404  13.861 (delta_t =  18.265 [sec])
Background time interval of the image:
-239.440  -4.404 (delta_t = 235.036 [sec])
Lightcurves
Notes:
- 1) The mask-weighted light curves are using the flight position.
- 2) Multiple plots of different time binning/intervals are shown to cover all scenarios of short/long GRBs, rate/image triggers, and real/false positives.
- 3) For all the mask-weighted lightcurves, the y-axis units are counts/sec/det where a det is 0.4 x 0.4 = 0.16 sq cm.
- 4) The verticle lines correspond to following: green dotted lines are T50 interval, black dotted lines are T90 interval, blue solid line(s) is a spacecraft slew start time, and orange solid line(s) is a spacecraft slew end time.
- 5) Time of each bin is in the middle of the bin.
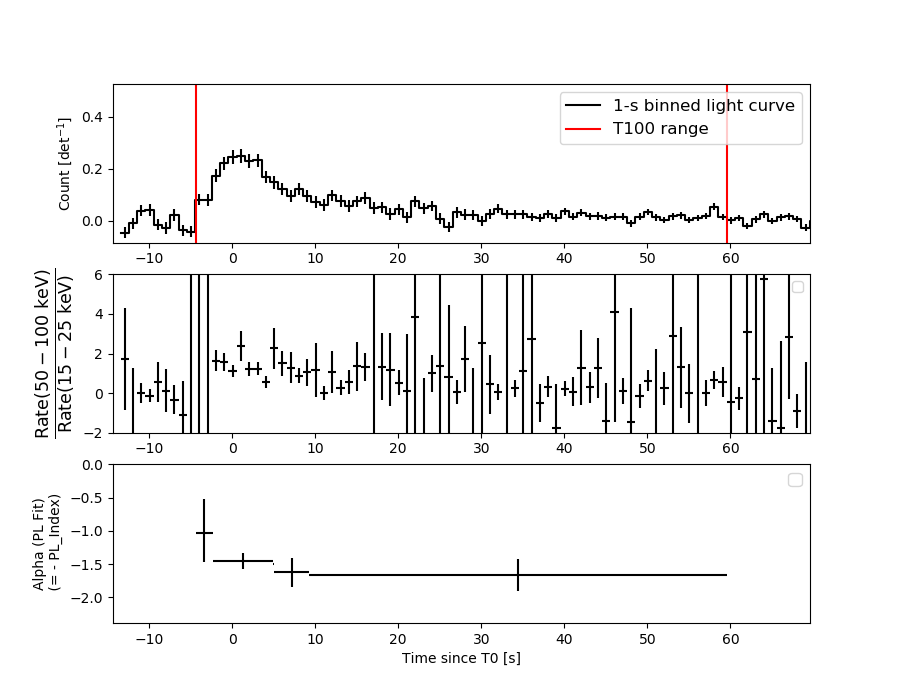
1 s binning
From T0-310 s to T0+310 s
From T100_start - 20 s to T100_end + 30 s
Full time interval

64 ms binning
Full time interval
From T100_start to T100_end
From T0-5 sec to T0+5 sec
16 ms binning
From T100_start-5 s to T100_start+5 s
Blue+Cyan dotted lines: Time interval of the scaled map
From 0.000000 to 1.024000
8 ms binning
From T100_start-3 s to T100_start+3 s
Blue+Cyan dotted lines: Time interval of the scaled map
From 0.000000 to 1.024000
2 ms binning
From T100_start-1 s to T100_start+1 s
Blue+Cyan dotted lines: Time interval of the scaled map
From 0.000000 to 1.024000
SN=5 or 10 sec. binning (whichever binning is satisfied first)
SN=5 or 10 sec. binning (T < 200 sec)

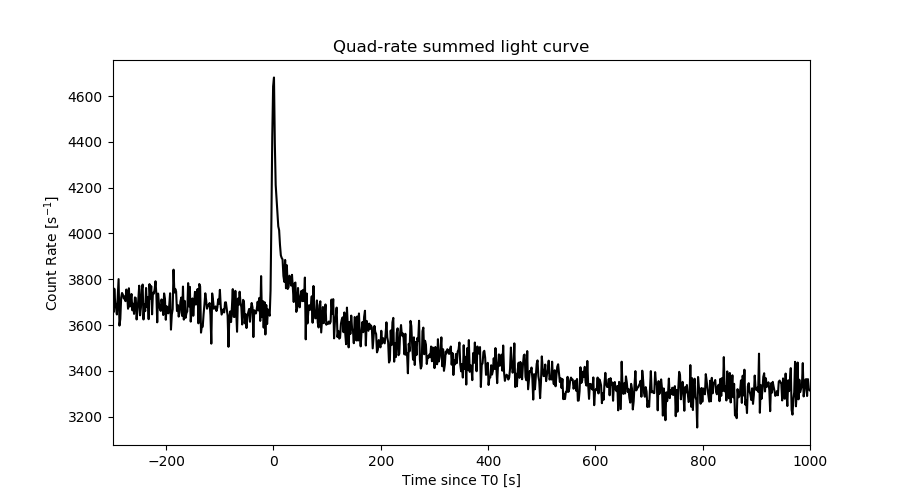
Quad-rate summed light curves (from T0-300s to T0+1000s)
Spectral Evolution
Spectra
Notes:
- 1) The fitting includes the systematic errors.
- 2) When the burst includes telescope slew time periods, the fitting uses an average response file made from multiple 5-s response files through out the slew time plus single time preiod for the non-slew times, and weighted by the total counts in the corresponding time period using addrmf. An average response file is needed becuase a spectral fit using the pre-slew DRM will introduce some errors in both a spectral shape and a normalization if the PHA file contains a lot of the slew/post-slew time interval.
- 3) For fits to more complicated models (e.g. a power-law over a cutoff power-law), the BAT team has decided to require a chi-square improvement of more than 6 for each extra dof.
Time averaged spectrum fit using the average DRM
Power-law model
Time interval is from   -4.404 sec. to   59.592 sec.

Spectral model in power-law:
------------------------------------------------------------
Parameters  : value       lower 90%   higher 90%
Photon index: 1.53653     ( -0.113846   0.114705 )
Norm@50keV  : 4.05934E-03    ( -0.000273729   0.000273063 )
------------------------------------------------------------
#Fit statistic  : Chi-Squared                   62.79     using 59 bins.
 Reduced chi-squared = 1.10158
# Null hypothesis probability of 2.79e-01 with 57 degrees of freedom

Photon flux (15-150 keV)    in 64 sec: 0.511922 ( -0.035126  0.035193 ) ph/cm2/s
Energy fluence (15-150 keV)             : 2.45087e-06 ( -1.77341e-07  1.78371e-07 ) ergs/cm2
Cutoff power-law model

Time interval is from   -4.404 sec. to   59.592 sec.
Spectral model in the cutoff power-law:
------------------------------------------------------------
Parameters  : value       lower 90%   higher 90%
Photon index: 0.986298     ( -0.5144   0.459836 )
Epeak [keV] : 94.8136      ( -23.9729 188.343 )
Norm@50keV  : 7.57978E-03    ( -0.00302044   0.00578788 )
------------------------------------------------------------
#Fit statistic  : Chi-Squared                   58.53     using 59 bins.
 Reduced chi-squared = 1.04518
# Null hypothesis probability of 3.83e-01 with 56 degrees of freedom

Photon flux (15-150 keV)    in 64 sec: 0.498875 ( -0.036779  0.03679 ) ph/cm2/s
Energy fluence (15-150 keV)             : 2.36876e-06 ( -1.91597e-07  1.91775e-07 ) ergs/cm2
Band function

Time interval is from   -4.404 sec. to   59.592 sec.


Spectral model in the Band function:
------------------------------------------------------------
Parameters  : value       lower 90%   higher 90%
alpha       :    (     )
beta        :     (     )
Epeak [keV] :       (   )
Norm@50keV   :     (     )
------------------------------------------------------------

Photon flux (15-150 keV)    in  sec:  (    ) ph/cm2/s
Energy fluence (15-150 keV)             : 0 ( 0  0 ) ergs/cm2
Single BB

Spectral model blackbody:
------------------------------------------------------------
Parameters  : value    Lower 90%  Upper 90%
kT [keV]    : 15.3721  (-1.20421  1.32085)
R^2/D10^2   : 5.32437E-02  (-0.0135464   0.0179338)
(R is the radius in km and D10 is the distance to the source in units of 10 kpc)
------------------------------------------------------------
#Fit statistic  : Chi-Squared                   98.75     using 59 bins.
 Reduced chi-squared =
# Null hypothesis probability of 5.04e-04 with 57 degrees of freedom

Energy  Fluence     90% Error
[keV]   [erg/cm2]   [erg/cm2]
15- 25  1.679e-07   2.262e-08
25- 50  6.820e-07   5.443e-08
50-150  1.108e-06   1.424e-07
15-150  1.958e-06   1.510e-07
Thermal bremsstrahlung (OTTB)
Spectral model: thermal bremsstrahlung
------------------------------------------------------------
Parameters  : value         Lower 90%    Upper 90%
kT [keV]    : 199.326       (-50.6269      -199.338)
Norm        : 2.09483       (-0.137847     0.138061)
------------------------------------------------------------
#Fit statistic  : Chi-Squared                   59.56     using 59 bins.
 Reduced chi-squared =
# Null hypothesis probability of 3.83e-01 with 57 degrees of freedom

Energy  Fluence     90% Error
[keV]   [erg/cm2]   [erg/cm2]
15- 25  3.338e-07   2.691e-08
25- 50  6.422e-07   5.930e-08
50-150  1.408e-06   3.242e-07
15-150  2.384e-06   4.179e-07
Double BB

Spectral model: bbodyrad<1> + bbodyrad<2>
------------------------------------------------------------
Parameters  : value         Lower 90%    Upper 90%
kT1 [keV]   : 6.36897        (-1.75796      2.2487)
R1^2/D10^2  : 0.645836        (-0.399651      1.52453)
kT2 [keV]   : 22.3846        (-3.60639      6.78622)
R2^2/D10^2  : 1.15306E-02    (-0.00743827   0.011547)
------------------------------------------------------------
#Fit statistic  : Chi-Squared                   59.71     using 59 bins.
 Reduced chi-squared =
# Null hypothesis probability of 3.09e-01 with 55 degrees of freedom

Energy  Fluence     90% Error
[keV]   [erg/cm2]   [erg/cm2]
15- 25  3.094e-07   1.220e-07
25- 50  6.362e-07   1.551e-07
50-150  1.390e-06   4.093e-07
15-150  2.335e-06   6.707e-07
Peak spectrum fit
Power-law model
Time interval is from    1.000 sec. to    2.000 sec.

Spectral model in power-law:
------------------------------------------------------------
Parameters  : value       lower 90%   higher 90%
Photon index: 1.57217     ( -0.272666   0.284476 )
Norm@50keV  : 1.74605E-02    ( -0.00294683   0.00290165 )
------------------------------------------------------------
#Fit statistic  : Chi-Squared                   50.58     using 59 bins.
 Reduced chi-squared = 0.887368
# Null hypothesis probability of 7.13e-01 with 57 degrees of freedom

Photon flux (15-150 keV)    in 1 sec: 2.22492 ( -0.3607  0.36134 ) ph/cm2/s
Energy fluence (15-150 keV)             : 1.63897e-07 ( -2.95834e-08  2.98969e-08 ) ergs/cm2
Cutoff power-law model

Time interval is from    1.000 sec. to    2.000 sec.
Spectral model in the cutoff power-law:
------------------------------------------------------------
Parameters  : value       lower 90%   higher 90%
Photon index: 1.40439     ( -1.13249   1.30672 )
Epeak [keV] : 182.340      ( -182.336 -182.336 )
Norm@50keV  : 2.12046E-02    ( -0.00661531   0.0545299 )
------------------------------------------------------------
#Fit statistic  : Chi-Squared                   50.49     using 59 bins.
 Reduced chi-squared = 0.901607
# Null hypothesis probability of 6.83e-01 with 56 degrees of freedom

Photon flux (15-150 keV)    in 1 sec: 2.21258 ( -0.3686  0.36754 ) ph/cm2/s
Energy fluence (15-150 keV)             : 1.62547e-07 ( -3.10154e-08  3.0241e-08 ) ergs/cm2
Band function

Time interval is from    1.000 sec. to    2.000 sec.


Spectral model in the Band function:
------------------------------------------------------------
Parameters  : value       lower 90%   higher 90%
alpha       :    (     )
beta        :     (     )
Epeak [keV] :       (   )
Norm@50keV   :     (     )
------------------------------------------------------------

Photon flux (15-150 keV)    in  sec:  (    ) ph/cm2/s
Energy fluence (15-150 keV)             : 0 ( 0  0 ) ergs/cm2
Single BB

Spectral model blackbody:
------------------------------------------------------------
Parameters  : value    Lower 90%  Upper 90%
kT [keV]    : 15.1701  (-3.23553  3.92788)
R^2/D10^2   : 0.239135  (-0.131468   0.311849)
(R is the radius in km and D10 is the distance to the source in units of 10 kpc)
------------------------------------------------------------
#Fit statistic  : Chi-Squared                   62.33     using 59 bins.
 Reduced chi-squared =
# Null hypothesis probability of 2.92e-01 with 57 degrees of freedom

Energy  Fluence     90% Error
[keV]   [erg/cm2]   [erg/cm2]
15- 25  1.150e-08   3.617e-09
25- 50  4.617e-08   1.325e-08
50-150  7.267e-08   2.778e-08
15-150  1.303e-07   3.369e-08
Thermal bremsstrahlung (OTTB)

Spectral model: thermal bremsstrahlung
------------------------------------------------------------
Parameters  : value         Lower 90%    Upper 90%
kT [keV]    : 199.362       (-104.032      -199.363)
Norm        : 9.06649       (-1.44348     1.6905)
------------------------------------------------------------
#Fit statistic  : Chi-Squared                   50.57     using 59 bins.
 Reduced chi-squared =
# Null hypothesis probability of 7.14e-01 with 57 degrees of freedom

Energy  Fluence     90% Error
[keV]   [erg/cm2]   [erg/cm2]
15- 25  2.258e-08   1.280e-08
25- 50  4.343e-08   2.476e-08
50-150  9.525e-08   5.440e-08
15-150  1.612e-07   9.095e-08
Double BB

Spectral model: bbodyrad<1> + bbodyrad<2>
------------------------------------------------------------
Parameters  : value         Lower 90%    Upper 90%
kT1 [keV]   : 5.59734        (-2.4138      3.63697)
R1^2/D10^2  : 5.26064        (-4.31062      58.2475)
kT2 [keV]   : 23.4858        (-6.49963      17.9657)
R2^2/D10^2  : 4.32696E-02    (-0.0374285   0.099913)
------------------------------------------------------------
#Fit statistic  : Chi-Squared                   50.22     using 59 bins.
 Reduced chi-squared =
# Null hypothesis probability of 6.57e-01 with 55 degrees of freedom

Energy  Fluence     90% Error
[keV]   [erg/cm2]   [erg/cm2]
15- 25  2.396e-08   1.361e-08
25- 50  4.031e-08   2.173e-08
50-150  9.787e-08   5.790e-08
15-150  1.621e-07   8.585e-08
Pre-slew spectrum (Pre-slew PHA with pre-slew DRM)
Power-law model

Spectral model in power-law:
------------------------------------------------------------
Parameters  : value       lower 90%   higher 90%
Photon index: 1.51662     ( -0.106614   0.107183 )
Norm@50keV  : 9.99519E-03    ( -0.000641319   0.000640253 )
------------------------------------------------------------
#Fit statistic  : Chi-Squared                   59.88     using 59 bins.
 Reduced chi-squared =
# Null hypothesis probability of 3.72e-01 with 57 degrees of freedom

Photon flux (15-150 keV)    in 18.26 sec: 1.25345 ( -0.0823742  0.0825143 ) ph/cm2/s
Energy fluence (15-150 keV)             : 1.7268e-06 ( -1.18843e-07  1.19307e-07 ) ergs/cm2
Cutoff power-law model

Spectral model in the cutoff power-law:
------------------------------------------------------------
Parameters  : value       lower 90%   higher 90%
Photon index: 0.908321     ( -0.479773   0.433277 )
Epeak [keV] : 92.7927      ( -20.9145 95.4329 )
Norm@50keV  : 1.99181E-02    ( -0.00757303   0.0138406 )
------------------------------------------------------------
#Fit statistic  : Chi-Squared                   53.91     using 59 bins.
 Reduced chi-squared =
# Null hypothesis probability of 5.54e-01 with 56 degrees of freedom

Photon flux (15-150 keV)    in 18.26 sec: 1.22123 ( -0.08543  0.08549 ) ph/cm2/s
Energy fluence (15-150 keV)             : 1.66895e-06 ( -1.27267e-07  1.27201e-07 ) ergs/cm2
Band function

Spectral model in the Band function:
------------------------------------------------------------
Parameters  : value       lower 90%   higher 90%
alpha       :    (     )
beta        :     (     )
Epeak [keV] :       (   )
Norm@50keV   :     (     )
------------------------------------------------------------

Photon flux (15-150 keV)    in  sec:  (    ) ph/cm2/s
Energy fluence (15-150 keV)             : 0 ( 0  0 ) ergs/cm2
S(25-50 keV) vs. S(50-100 keV) plot
S(25-50 keV)  = 6.17e-07
S(50-100 keV) = 8.51e-07
T90 vs. Hardness ratio plot
T90                                   = 50.2039999961853 sec.
Hardness ratio (energy fluence ratio) = 1.37925
Color vs. Color plot
Count Ratio  (25-50 keV) / (15-25 keV) = 1.40665
Count Ratio (50-100 keV) / (15-25 keV) = 1.17249
Mask shadow pattern
IMX = 8.854468711545050E-01, IMY = 7.963226404710136E-03
TIME vs. PHA plot around the trigger time

Blue+Cyan dotted lines: Time interval of the scaled map
From 0.000000 to 1.024000
TIME vs. DetID plot around the trigger time
Blue+Cyan dotted lines: Time interval of the scaled map
From 0.000000 to 1.024000
100 us light curve (15-350 keV)
Blue+Cyan dotted lines: Time interval of the scaled map
From 0.000000 to 1.024000
Spacecraft aspect plot

Bright source in the pre-burst/pre-slew/post-slew images
Pre-burst image of 15-350 keV band
Time interval of the image:
-239.440000 -4.404000

# RAcent  DECcent POSerr Theta    Phi  PeakCts   SNR AngSep     Name
#  [deg]    [deg]    ['] [deg]  [deg]                   [']
308.3168  40.9909    0.0  46.9  154.2   1.1688   1.2    9.6	Cyg X-3
326.1351  38.4693    5.9  33.2  150.3   0.8567   1.9    9.0	Cyg X-2
357.6059   0.2310    2.8  29.9   48.6   1.6618   4.1  144.3	UNKNOWN
324.1488  47.5409    3.4  36.2  165.6   1.4584   3.4 ------	UNKNOWN
341.9383  53.8753    2.2  29.7 -173.8   1.5844   5.3 ------	UNKNOWN
307.9870  80.7470    3.0  56.0 -155.5   5.3774   3.9 ------	UNKNOWN
Pre-slew background subtracted image of 15-350 keV band
Time interval of the image:
-4.404000 13.860590

# RAcent  DECcent POSerr Theta    Phi  PeakCts   SNR AngSep     Name
#  [deg]    [deg]    ['] [deg]  [deg]                   [']
308.1181  40.8689    5.5  47.0  154.1   0.4502   2.1    5.0	Cyg X-3
325.9988  38.2608    7.8  33.3  149.9  -0.1525  -1.5    8.9	Cyg X-2
 27.0307  -6.3472    0.5  41.5   -0.5   2.8101  24.8 ------	UNKNOWN
 36.8104  19.5576    2.6  30.5  -44.8   0.3468   4.4 ------	UNKNOWN
 44.7716   8.9320    1.9  42.5  -35.7   0.7414   6.2 ------	UNKNOWN
 52.1616   1.3201    2.4  52.9  -33.1   1.5749   4.9 ------	UNKNOWN
 55.1526  12.4193    2.4  49.5  -47.2   1.4207   4.8 ------	UNKNOWN
Post-slew image of 15-350 keV band
Time interval of the image:
73.860600 962.683800

# RAcent  DECcent POSerr Theta    Phi  PeakCts   SNR AngSep     Name
#  [deg]    [deg]    ['] [deg]  [deg]                   [']
346.1008  -3.2565    2.1  40.9  112.1  12.6709   5.5 ------	UNKNOWN
359.1017  -4.9481    2.3  27.8  111.1   5.1137   5.1  301.7	UNKNOWN
 13.9578 -26.3812    3.9  23.6   50.1   2.3747   2.9 ------	UNKNOWN
359.6116  30.9422    4.1  45.6  166.1   5.5172   2.8 ------	UNKNOWN
 29.0740 -41.1915    2.9  34.9   17.0   4.0116   4.0 ------	UNKNOWN
 19.8460   6.3906    3.7  14.6  170.2   2.1465   3.2 ------	UNKNOWN
 72.1505 -11.6355    3.1  44.8  -60.2  11.2279   3.7 ------	UNKNOWN
Plot creation:
Sat Jul 30 06:55:37 EDT 2022