Estimated redshift from machine learning (Ukwatta et al. 2016) - may take a few minute to calcaulte
Image
Pre-slew 15.0-350.0 keV image (Event data)

#   RAcent    DECcent   POSerr    Theta     Phi              Peak Cts       SNR   Name
  227.4310    -6.2737   0.0147    46.8952    -5.8255         2.9981924     13.068 TRIG_01061482

Foreground time interval of the image:
-33.816  15.272 (delta_t =  49.088 [sec])
Background time interval of the image:
-239.672 -33.816 (delta_t = 205.856 [sec])
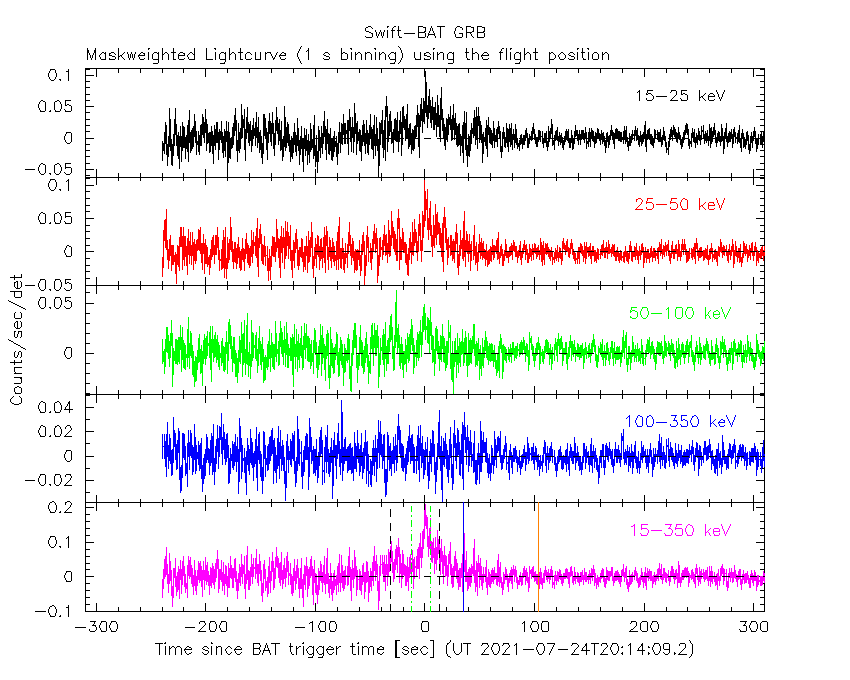
Lightcurves
Notes:
- 1) The mask-weighted light curves are using the flight position.
- 2) Multiple plots of different time binning/intervals are shown to cover all scenarios of short/long GRBs, rate/image triggers, and real/false positives.
- 3) For all the mask-weighted lightcurves, the y-axis units are counts/sec/det where a det is 0.4 x 0.4 = 0.16 sq cm.
- 4) The verticle lines correspond to following: green dotted lines are T50 interval, black dotted lines are T90 interval, blue solid line(s) is a spacecraft slew start time, and orange solid line(s) is a spacecraft slew end time.
- 5) Time of each bin is in the middle of the bin.
1 s binning
From T0-310 s to T0+310 s
From T100_start - 20 s to T100_end + 30 s

Full time interval

64 ms binning
Full time interval

From T100_start to T100_end

From T0-5 sec to T0+5 sec

16 ms binning
From T100_start-5 s to T100_start+5 s

Blue+Cyan dotted lines: Time interval of the scaled map
From 0.000000 to 4.096000
8 ms binning
From T100_start-3 s to T100_start+3 s

Blue+Cyan dotted lines: Time interval of the scaled map
From 0.000000 to 4.096000
2 ms binning
From T100_start-1 s to T100_start+1 s

Blue+Cyan dotted lines: Time interval of the scaled map
From 0.000000 to 4.096000
SN=5 or 10 sec. binning (whichever binning is satisfied first)

SN=5 or 10 sec. binning (T < 200 sec)

Quad-rate summed light curves (from T0-300s to T0+1000s)

Spectral Evolution

Spectra
Notes:
- 1) The fitting includes the systematic errors.
- 2) When the burst includes telescope slew time periods, the fitting uses an average response file made from multiple 5-s response files through out the slew time plus single time preiod for the non-slew times, and weighted by the total counts in the corresponding time period using addrmf. An average response file is needed becuase a spectral fit using the pre-slew DRM will introduce some errors in both a spectral shape and a normalization if the PHA file contains a lot of the slew/post-slew time interval.
- 3) For fits to more complicated models (e.g. a power-law over a cutoff power-law), the BAT team has decided to require a chi-square improvement of more than 6 for each extra dof.
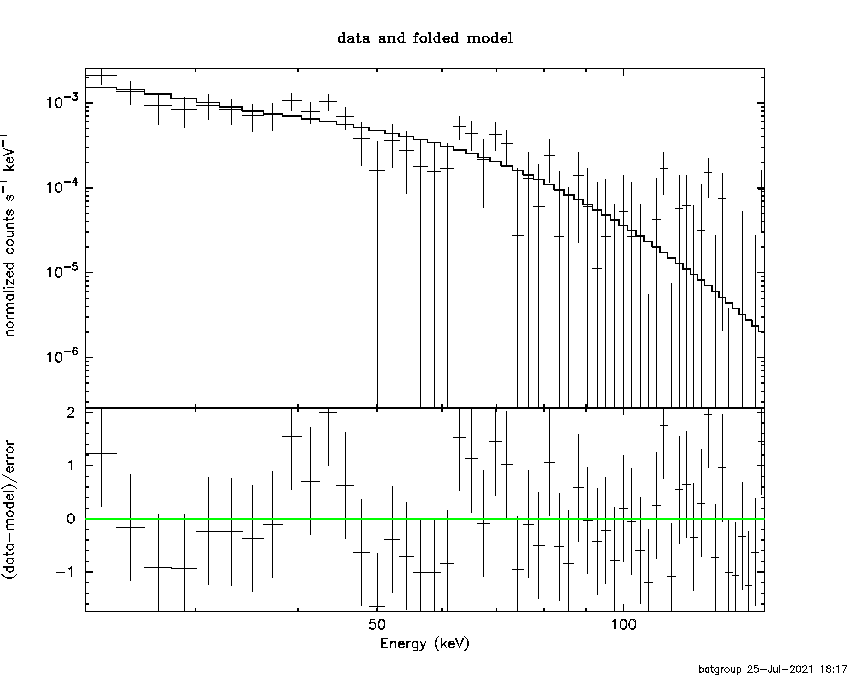
Time averaged spectrum fit using the average DRM
Power-law model

Time interval is from  -33.816 sec. to   15.272 sec.

Spectral model in power-law:
------------------------------------------------------------
Parameters  : value       lower 90%   higher 90%
Photon index: 2.22024     ( -0.203727   0.216689 )
Norm@50keV  : 3.52018E-03    ( -0.000485273   0.000473224 )
------------------------------------------------------------
#Fit statistic  : Chi-Squared                   48.63     using 59 bins.
 Reduced chi-squared = 0.853158
# Null hypothesis probability of 7.77e-01 with 57 degrees of freedom

Photon flux (15-150 keV)    in 49.09 sec: 0.589110 ( -0.066183  0.066387 ) ph/cm2/s
Energy fluence (15-150 keV)             : 1.62983e-06 ( -1.94134e-07  1.96304e-07 ) ergs/cm2
Cutoff power-law model

Time interval is from  -33.816 sec. to   15.272 sec.
Spectral model in the cutoff power-law:
------------------------------------------------------------
Parameters  : value       lower 90%   higher 90%
Photon index: 1.54842     ( -1.06609   0.453609 )
Epeak [keV] : 29.0786      ( -27.7491 15.4754 )
Norm@50keV  : 8.37193E-03    ( -0.00837194   0.0247397 )
------------------------------------------------------------
#Fit statistic  : Chi-Squared                   46.88     using 59 bins.
 Reduced chi-squared = 0.837143
# Null hypothesis probability of 8.02e-01 with 56 degrees of freedom

Photon flux (15-150 keV)    in 49.09 sec: 0.571339 ( -0.070325  0.070185 ) ph/cm2/s
Energy fluence (15-150 keV)             : 1.55036e-06 ( -2.12463e-07  2.19516e-07 ) ergs/cm2
Band function

Time interval is from  -33.816 sec. to   15.272 sec.


Spectral model in the Band function:
------------------------------------------------------------
Parameters  : value       lower 90%   higher 90%
alpha       :    (     )
beta        :     (     )
Epeak [keV] :       (   )
Norm@50keV   :     (     )
------------------------------------------------------------

Photon flux (15-150 keV)    in  sec:  (    ) ph/cm2/s
Energy fluence (15-150 keV)             : 0 ( 0  0 ) ergs/cm2
Single BB

Spectral model blackbody:
------------------------------------------------------------
Parameters  : value    Lower 90%  Upper 90%
kT [keV]    : 9.91228  (-1.18163  1.33009)
R^2/D10^2   : 0.269564  (-0.10693   0.179243)
(R is the radius in km and D10 is the distance to the source in units of 10 kpc)
------------------------------------------------------------
#Fit statistic  : Chi-Squared                   61.96     using 59 bins.
 Reduced chi-squared =
# Null hypothesis probability of 3.04e-01 with 57 degrees of freedom

Energy  Fluence     90% Error
[keV]   [erg/cm2]   [erg/cm2]
15- 25  2.640e-07   5.297e-08
25- 50  6.482e-07   8.910e-08
50-150  3.298e-07   8.898e-08
15-150  1.242e-06   1.780e-07
Thermal bremsstrahlung (OTTB)

Spectral model: thermal bremsstrahlung
------------------------------------------------------------
Parameters  : value         Lower 90%    Upper 90%
kT [keV]    : 51.5103       (-12.5731      19.3455)
Norm        : 3.24042       (-0.588774     0.764102)
------------------------------------------------------------
#Fit statistic  : Chi-Squared                   47.05     using 59 bins.
 Reduced chi-squared =
# Null hypothesis probability of 8.23e-01 with 57 degrees of freedom

Energy  Fluence     90% Error
[keV]   [erg/cm2]   [erg/cm2]
15- 25  3.915e-07   6.134e-08
25- 50  5.683e-07   6.814e-08
50-150  5.673e-07   1.482e-07
15-150  1.527e-06   2.133e-07
Double BB

Spectral model: bbodyrad<1> + bbodyrad<2>
------------------------------------------------------------
Parameters  : value         Lower 90%    Upper 90%
kT1 [keV]   : 3.44346        (-1.24426      2.60466)
R1^2/D10^2  : 13.3640        (-12.1232      55.3945)
kT2 [keV]   : 12.7714        (-2.15118      5.00626)
R2^2/D10^2  : 8.39895E-02    (-0.0665211   0.064715)
------------------------------------------------------------
#Fit statistic  : Chi-Squared                   47.17     using 59 bins.
 Reduced chi-squared =
# Null hypothesis probability of 7.64e-01 with 55 degrees of freedom

Energy  Fluence     90% Error
[keV]   [erg/cm2]   [erg/cm2]
15- 25  4.176e-07   2.016e-07
25- 50  5.452e-07   2.096e-07
50-150  4.920e-07   2.171e-07
15-150  1.455e-06   5.302e-07
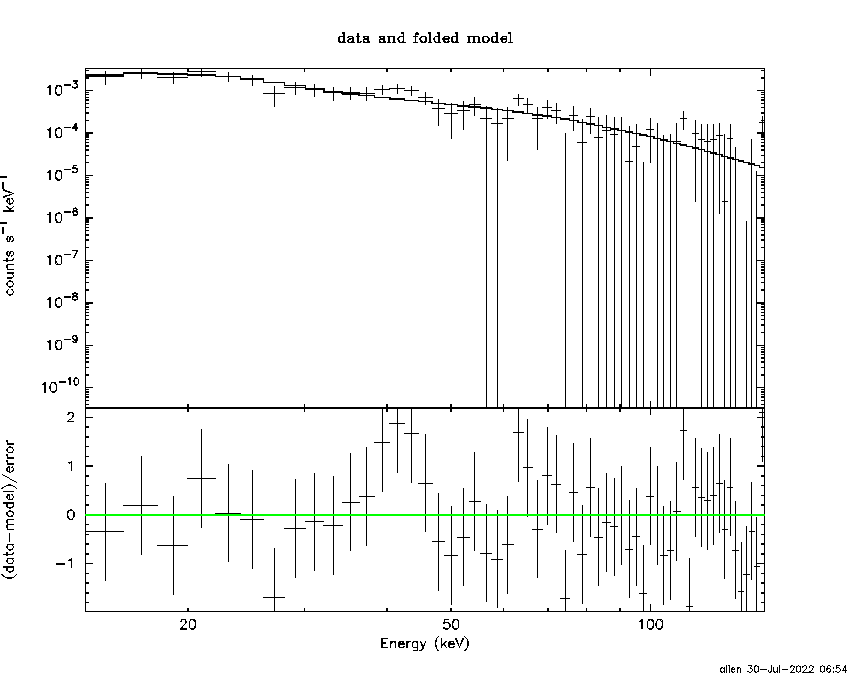
Peak spectrum fit
Power-law model
Time interval is from   -0.516 sec. to    0.484 sec.

Spectral model in power-law:
------------------------------------------------------------
Parameters  : value       lower 90%   higher 90%
Photon index: 2.28046     ( -0.379963   0.432577 )
Norm@50keV  : 1.05175E-02    ( -0.0031781   0.00308379 )
------------------------------------------------------------
#Fit statistic  : Chi-Squared                   60.41     using 59 bins.
 Reduced chi-squared = 1.05982
# Null hypothesis probability of 3.54e-01 with 57 degrees of freedom

Photon flux (15-150 keV)    in 1 sec: 1.81856 ( -0.45436  0.45598 ) ph/cm2/s
Energy fluence (15-150 keV)             : 1.00166e-07 ( -2.62259e-08  2.66547e-08 ) ergs/cm2
Cutoff power-law model

Time interval is from   -0.516 sec. to    0.484 sec.
Spectral model in the cutoff power-law:
------------------------------------------------------------
Parameters  : value       lower 90%   higher 90%
Photon index: -0.433023     ( -5.06036   2.20821 )
Epeak [keV] : 34.5804      ( -24.5073 11.0889 )
Norm@50keV  : 0.452898    ( -0.622963   745.547 )
------------------------------------------------------------
#Fit statistic  : Chi-Squared                   56.08     using 59 bins.
 Reduced chi-squared = 1.00143
# Null hypothesis probability of 4.72e-01 with 56 degrees of freedom

Photon flux (15-150 keV)    in 1 sec: 1.72063 ( -0.45846  0.46389 ) ph/cm2/s
Energy fluence (15-150 keV)             : 8.73957e-08 ( -2.41822e-08  2.77108e-08 ) ergs/cm2
Band function

Time interval is from   -0.516 sec. to    0.484 sec.


Spectral model in the Band function:
------------------------------------------------------------
Parameters  : value       lower 90%   higher 90%
alpha       :    (     )
beta        :     (     )
Epeak [keV] :       (   )
Norm@50keV   :     (     )
------------------------------------------------------------

Photon flux (15-150 keV)    in  sec:  (    ) ph/cm2/s
Energy fluence (15-150 keV)             : 0 ( 0  0 ) ergs/cm2
Single BB

Spectral model blackbody:
------------------------------------------------------------
Parameters  : value    Lower 90%  Upper 90%
kT [keV]    : 8.94064  (-1.84573  2.28836)
R^2/D10^2   : 1.38730  (-0.848086   2.16625)
(R is the radius in km and D10 is the distance to the source in units of 10 kpc)
------------------------------------------------------------
#Fit statistic  : Chi-Squared                   56.28     using 59 bins.
 Reduced chi-squared =
# Null hypothesis probability of 5.02e-01 with 57 degrees of freedom

Energy  Fluence     90% Error
[keV]   [erg/cm2]   [erg/cm2]
15- 25  2.152e-08   1.022e-08
25- 50  4.526e-08   1.901e-08
50-150  1.692e-08   1.040e-08
15-150  8.369e-08   3.540e-08
Thermal bremsstrahlung (OTTB)

Spectral model: thermal bremsstrahlung
------------------------------------------------------------
Parameters  : value         Lower 90%    Upper 90%
kT [keV]    : 43.5008       (-17.0273      34.8347)
Norm        : 11.5799       (-4.08128     6.35953)
------------------------------------------------------------
#Fit statistic  : Chi-Squared                   57.57     using 59 bins.
 Reduced chi-squared =
# Null hypothesis probability of 4.54e-01 with 57 degrees of freedom

Energy  Fluence     90% Error
[keV]   [erg/cm2]   [erg/cm2]
15- 25  2.730e-08   8.860e-09
25- 50  3.720e-08   1.461e-08
50-150  3.147e-08   1.910e-08
15-150  9.597e-08   3.486e-08
Double BB

Spectral model: bbodyrad<1> + bbodyrad<2>
------------------------------------------------------------
Parameters  : value         Lower 90%    Upper 90%
kT1 [keV]   : 8.20314        (-8.25806      2.67089)
R1^2/D10^2  : 1.82062        (-1.77405      -1.77405)
kT2 [keV]   : 28.3462        (-31.6611      -31.6611)
R2^2/D10^2  : 3.17349E-03    (-0.00206592   -0.00206592)
------------------------------------------------------------
#Fit statistic  : Chi-Squared                   55.64     using 59 bins.
 Reduced chi-squared =
# Null hypothesis probability of 4.50e-01 with 55 degrees of freedom

Energy  Fluence     90% Error
[keV]   [erg/cm2]   [erg/cm2]
15- 25  2.297e-08   1.407e-08
25- 50  4.370e-08   2.747e-08
50-150  2.614e-08   1.464e-08
15-150  9.281e-08   5.220e-08
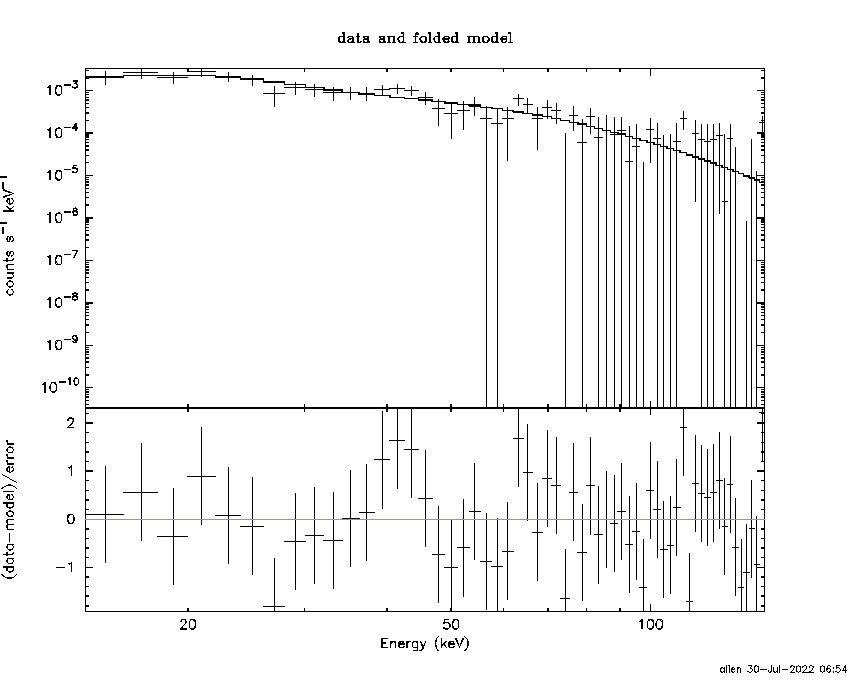
Pre-slew spectrum (Pre-slew PHA with pre-slew DRM)
Power-law model
Spectral model in power-law:
------------------------------------------------------------
Parameters  : value       lower 90%   higher 90%
Photon index: 2.22024     ( -0.203727   0.216689 )
Norm@50keV  : 3.52018E-03    ( -0.000485273   0.000473224 )
------------------------------------------------------------
#Fit statistic  : Chi-Squared                   48.63     using 59 bins.
 Reduced chi-squared =
# Null hypothesis probability of 7.77e-01 with 57 degrees of freedom

Photon flux (15-150 keV)    in 49.09 sec: 0.589050 ( -0.0661727  0.0663751 ) ph/cm2/s
Energy fluence (15-150 keV)             : 1.62952e-06 ( -1.94099e-07  1.96286e-07 ) ergs/cm2
Cutoff power-law model
Spectral model in the cutoff power-law:
------------------------------------------------------------
Parameters  : value       lower 90%   higher 90%
Photon index: 1.54842     ( -1.06609   0.655823 )
Epeak [keV] : 29.0785      ( -27.909 15.4733 )
Norm@50keV  : 8.37193E-03    ( -0.00837193   0.0247397 )
------------------------------------------------------------
#Fit statistic  : Chi-Squared                   46.88     using 59 bins.
 Reduced chi-squared =
# Null hypothesis probability of 8.02e-01 with 56 degrees of freedom

Photon flux (15-150 keV)    in 49.09 sec: 0.571193 ( -0.070287  0.070085 ) ph/cm2/s
Energy fluence (15-150 keV)             : 1.55069e-06 ( -2.12727e-07  2.19339e-07 ) ergs/cm2
Band function
Spectral model in the Band function:
------------------------------------------------------------
Parameters  : value       lower 90%   higher 90%
alpha       :    (     )
beta        :     (     )
Epeak [keV] :       (   )
Norm@50keV   :     (     )
------------------------------------------------------------

Photon flux (15-150 keV)    in  sec:  (    ) ph/cm2/s
Energy fluence (15-150 keV)             : 0 ( 0  0 ) ergs/cm2
S(25-50 keV) vs. S(50-100 keV) plot

S(25-50 keV)  = 5.20e-07
S(50-100 keV) = 4.45e-07
T90 vs. Hardness ratio plot

T90                                   = 44.1759999990463 sec.
Hardness ratio (energy fluence ratio) = 0.855769
Color vs. Color plot

Count Ratio  (25-50 keV) / (15-25 keV) = 0.960107
Count Ratio (50-100 keV) / (15-25 keV) = 0.445921
Mask shadow pattern

IMX = 1.062925553726042E+00, IMY = 1.084459794156913E-01
TIME vs. PHA plot around the trigger time

Blue+Cyan dotted lines: Time interval of the scaled map
From 0.000000 to 4.096000
TIME vs. DetID plot around the trigger time

Blue+Cyan dotted lines: Time interval of the scaled map
From 0.000000 to 4.096000
100 us light curve (15-350 keV)

Blue+Cyan dotted lines: Time interval of the scaled map
From 0.000000 to 4.096000
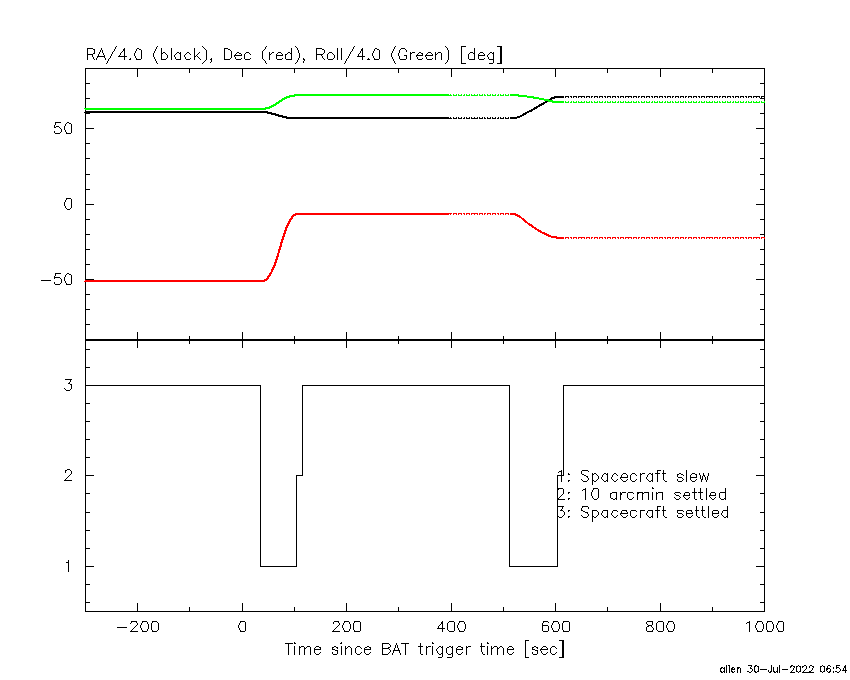
Spacecraft aspect plot
Bright source in the pre-burst/pre-slew/post-slew images
Pre-burst image of 15-350 keV band
Time interval of the image:
-239.672000 -33.816000

# RAcent  DECcent POSerr Theta    Phi  PeakCts   SNR AngSep     Name
#  [deg]    [deg]    ['] [deg]  [deg]                   [']
170.4805 -60.5606   16.7  40.3 -115.6   0.5403   0.7    6.1	Cen X-3
186.6619 -62.7708    0.4  32.3 -116.2  14.7124  29.6    0.1	GX 301-2
244.9798 -15.6365    0.9  35.4   18.6   6.2839  13.6    0.2	Sco X-1
255.9934 -37.7963    2.6  15.6   54.0   1.5162   4.4    2.9	4U 1700-377
256.1860 -36.3546    0.0  16.9   52.1   0.7956   2.2   12.7	GX 349+2
263.1885 -24.7970    7.5  29.9   53.5   0.6785   1.5   10.3	GX 1+4
264.8100 -44.2473    0.0  15.3   89.3  -0.4199  -1.1   12.5	4U 1735-44
270.0544 -25.0481    0.0  32.6   64.4   0.6443   1.3   12.6	GX 5-1
270.3003 -25.6954    5.4  32.1   65.4   1.0734   2.1    2.9	GRS 1758-258
275.9252 -30.3669  166.3  31.2   78.2  -0.0352  -0.1    0.0	H1820-303
263.0552 -33.6439    0.0  22.1   62.8   0.4129   1.1   11.9	GX 354-0
232.7837 -41.9412    2.5  12.0  -28.1   1.4649   4.7 ------	UNKNOWN
Pre-slew background subtracted image of 15-350 keV band
Time interval of the image:
-33.816000 15.272000

# RAcent  DECcent POSerr Theta    Phi  PeakCts   SNR AngSep     Name
#  [deg]    [deg]    ['] [deg]  [deg]                   [']
170.1716 -60.7322    7.3  40.4 -115.9   0.4896   1.6    7.8	Cen X-3
186.7443 -62.7762    1.7  32.3 -116.2   1.1113   6.6    2.4	GX 301-2
245.0167 -15.5189    6.2  35.5   18.6  -0.3240  -1.9    7.6	Sco X-1
255.8993 -38.0370    0.0  15.3   54.2  -0.2049  -1.6   12.3	4U 1700-377
256.2075 -36.3886    4.9  16.9   52.2  -0.3014  -2.3   11.2	GX 349+2
262.8108 -24.7314    5.9  29.9   52.8  -0.3235  -1.9   10.8	GX 1+4
264.9266 -44.5378   32.8  15.2   90.4   0.0435   0.4    9.5	4U 1735-44
270.4484 -25.1441    3.5  32.7   65.1   0.6909   3.3    9.7	GX 5-1
270.2413 -25.6671    6.6  32.1   65.3  -0.3632  -1.8    5.6	GRS 1758-258
275.7939 -30.4356    5.0  31.1   78.2   0.4820   2.3    7.9	H1820-303
262.9349 -33.7608   10.6  21.9   62.8  -0.1584  -1.1    5.2	GX 354-0
348.6593 -59.4259    2.2  53.8  159.9   2.9969   5.1 ------	UNKNOWN
227.4315  -6.2740    0.9  46.9   -5.8   3.0003  13.1 ------	UNKNOWN
148.9744 -80.2594    2.4  40.9 -147.6   0.8115   4.9 ------	UNKNOWN
 84.6793 -68.5182    2.1  59.5 -154.0   4.0029   5.5 ------	UNKNOWN
117.8697 -68.5602    2.9  54.1 -141.2   2.4584   3.9 ------	UNKNOWN
Post-slew image of 15-350 keV band
Time interval of the image:
103.828630 511.828640

# RAcent  DECcent POSerr Theta    Phi  PeakCts   SNR AngSep     Name
#  [deg]    [deg]    ['] [deg]  [deg]                   [']
244.9876 -15.6305    0.5  19.6  101.4  13.2327  23.5    0.7	Sco X-1
254.4651  35.3047    6.0  48.8   11.0   1.9944   1.9    2.3	Her X-1
256.1377 -37.7843    5.0  40.9  126.0   3.8624   2.3    8.0	4U 1700-377
256.3739 -36.5464    6.4  40.2  124.4   2.7512   1.8    8.0	GX 349+2
263.1132 -24.6991    5.0  38.8  103.7   3.0136   2.3    6.3	GX 1+4
258.5219   1.6126    3.2  32.0   58.2   2.7204   3.6 ------	UNKNOWN
236.3008 -28.0922    3.2  23.4  141.4   2.0466   3.6 ------	UNKNOWN
231.9703  16.1558    3.2  22.9   -7.2   1.6351   3.6 ------	UNKNOWN
195.8312 -30.0657    2.8  38.0 -151.2   2.8239   4.1 ------	UNKNOWN
215.9630  50.3761    3.6  57.5  -27.2  10.4079   3.2 ------	UNKNOWN
195.9317  26.4934    3.3  44.8  -60.1   8.0293   3.5 ------	UNKNOWN
Plot creation:
Sat Jul 30 06:54:36 EDT 2022