Estimated redshift from machine learning (Ukwatta et al. 2016) - may take a few minute to calcaulte
Image
Pre-slew 15.0-350.0 keV image (Event data)

#   RAcent    DECcent   POSerr    Theta     Phi              Peak Cts       SNR   Name
  192.8909    17.1018   0.0342    11.4447   147.5529         0.5221035      5.647 TRIG_01061554

Foreground time interval of the image:
  0.096  43.845 (delta_t =  43.749 [sec])
Background time interval of the image:
-239.456   0.096 (delta_t = 239.552 [sec])
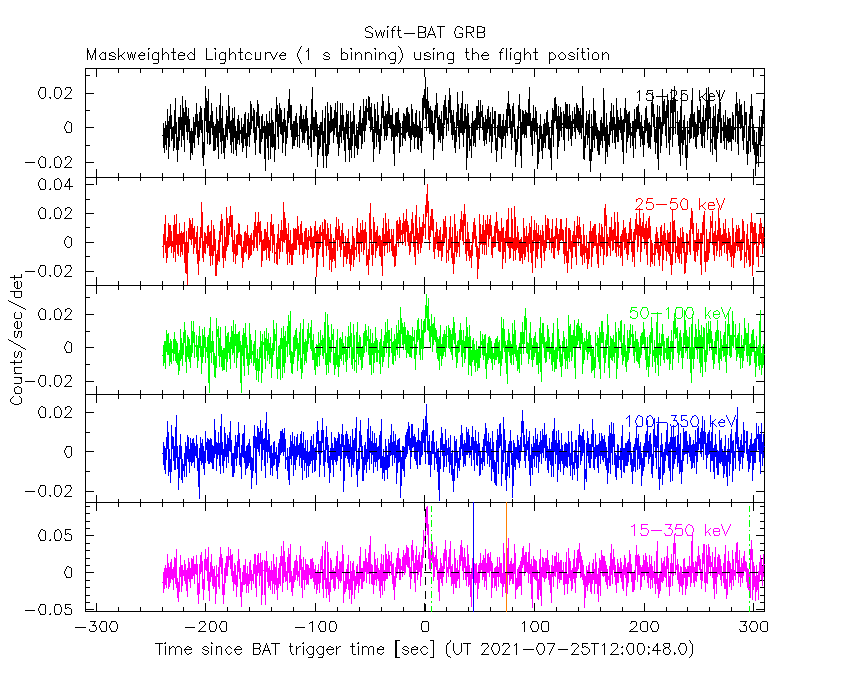
Lightcurves
Notes:
- 1) The mask-weighted light curves are using the flight position.
- 2) Multiple plots of different time binning/intervals are shown to cover all scenarios of short/long GRBs, rate/image triggers, and real/false positives.
- 3) For all the mask-weighted lightcurves, the y-axis units are counts/sec/det where a det is 0.4 x 0.4 = 0.16 sq cm.
- 4) The verticle lines correspond to following: green dotted lines are T50 interval, black dotted lines are T90 interval, blue solid line(s) is a spacecraft slew start time, and orange solid line(s) is a spacecraft slew end time.
- 5) Time of each bin is in the middle of the bin.
1 s binning
From T0-310 s to T0+310 s
From T100_start - 20 s to T100_end + 30 s

Full time interval

64 ms binning
Full time interval

From T100_start to T100_end

From T0-5 sec to T0+5 sec

16 ms binning
From T100_start-5 s to T100_start+5 s

8 ms binning
From T100_start-3 s to T100_start+3 s

2 ms binning
From T100_start-1 s to T100_start+1 s

SN=5 or 10 sec. binning (whichever binning is satisfied first)

SN=5 or 10 sec. binning (T < 200 sec)

Quad-rate summed light curves (from T0-300s to T0+1000s)

Spectral Evolution

Spectra
Notes:
- 1) The fitting includes the systematic errors.
- 2) When the burst includes telescope slew time periods, the fitting uses an average response file made from multiple 5-s response files through out the slew time plus single time preiod for the non-slew times, and weighted by the total counts in the corresponding time period using addrmf. An average response file is needed becuase a spectral fit using the pre-slew DRM will introduce some errors in both a spectral shape and a normalization if the PHA file contains a lot of the slew/post-slew time interval.
- 3) For fits to more complicated models (e.g. a power-law over a cutoff power-law), the BAT team has decided to require a chi-square improvement of more than 6 for each extra dof.
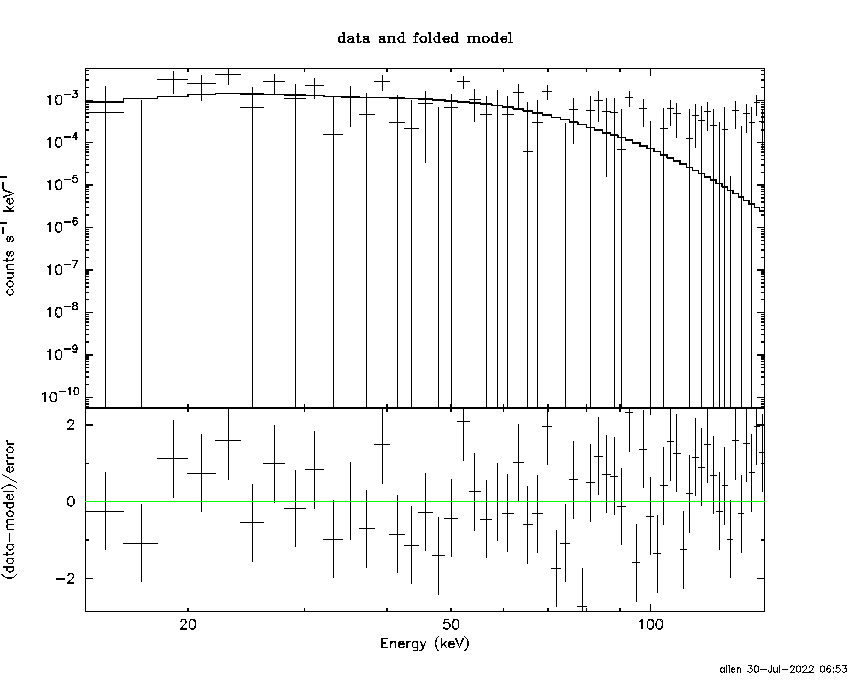
Time averaged spectrum fit using the average DRM
Power-law model

Time interval is from    0.096 sec. to  432.400 sec.

Spectral model in power-law:
------------------------------------------------------------
Parameters  : value       lower 90%   higher 90%
Photon index: 1.40945     ( -0.494452   0.5105 )
Norm@50keV  : 2.06194E-04    ( -6.39373e-05   6.29256e-05 )
------------------------------------------------------------
#Fit statistic  : Chi-Squared                   39.75     using 59 bins.
 Reduced chi-squared = 0.697368
# Null hypothesis probability of 9.60e-01 with 57 degrees of freedom

Photon flux (15-150 keV)    in 432.3 sec: 2.51652E-02 ( -0.0074806  0.0074901 ) ph/cm2/s
Energy fluence (15-150 keV)             : 8.59814e-07 ( -2.89657e-07  3.01675e-07 ) ergs/cm2
Cutoff power-law model

Time interval is from    0.096 sec. to  432.400 sec.
Spectral model in the cutoff power-law:
------------------------------------------------------------
Parameters  : value       lower 90%   higher 90%
Photon index: 0.108394     ( -3.35037   1.67681 )
Epeak [keV] : 72.1678      ( -28.395 -72.0194 )
Norm@50keV  : 9.37186E-04    ( -0.000946202   0.0341804 )
------------------------------------------------------------
#Fit statistic  : Chi-Squared                   38.53     using 59 bins.
 Reduced chi-squared = 0.688036
# Null hypothesis probability of 9.64e-01 with 56 degrees of freedom

Photon flux (15-150 keV)    in 432.3 sec: 2.39578E-02 ( -0.0077259  0.0077241 ) ph/cm2/s
Energy fluence (15-150 keV)             : 7.85174e-07 ( -2.84188e-07  3.20496e-07 ) ergs/cm2
Band function

Time interval is from    0.096 sec. to  432.400 sec.


Spectral model in the Band function:
------------------------------------------------------------
Parameters  : value       lower 90%   higher 90%
alpha       :    (     )
beta        :     (     )
Epeak [keV] :       (   )
Norm@50keV   :     (     )
------------------------------------------------------------

Photon flux (15-150 keV)    in  sec:  (    ) ph/cm2/s
Energy fluence (15-150 keV)             : 0 ( 0  0 ) ergs/cm2
Single BB

Spectral model blackbody:
------------------------------------------------------------
Parameters  : value    Lower 90%  Upper 90%
kT [keV]    : 15.7996  (-4.5519  6.70327)
R^2/D10^2   : 2.54150E-03  (-0.00254102   0.00560106)
(R is the radius in km and D10 is the distance to the source in units of 10 kpc)
------------------------------------------------------------
#Fit statistic  : Chi-Squared                   39.33     using 59 bins.
 Reduced chi-squared =
# Null hypothesis probability of 9.64e-01 with 57 degrees of freedom

Energy  Fluence     90% Error
[keV]   [erg/cm2]   [erg/cm2]
15- 25  5.686e-08   3.614e-08
25- 50  2.367e-07   1.445e-07
50-150  4.110e-07   2.624e-07
15-150  7.045e-07   4.120e-07
Thermal bremsstrahlung (OTTB)

Spectral model: thermal bremsstrahlung
------------------------------------------------------------
Parameters  : value         Lower 90%    Upper 90%
kT [keV]    : 199.363       (-199.363      -199.363)
Norm        : 0.103693       (-0.0305459     0.030546)
------------------------------------------------------------
#Fit statistic  : Chi-Squared                   39.46     using 59 bins.
 Reduced chi-squared =
# Null hypothesis probability of 9.63e-01 with 57 degrees of freedom

Energy  Fluence     90% Error
[keV]   [erg/cm2]   [erg/cm2]
15- 25  1.116e-07   7.042e-08
25- 50  2.147e-07   1.284e-07
50-150  4.709e-07   2.821e-07
15-150  7.972e-07   4.816e-07
Double BB

Spectral model: bbodyrad<1> + bbodyrad<2>
------------------------------------------------------------
Parameters  : value         Lower 90%    Upper 90%
kT1 [keV]   : 5.25950        (-5.25996      -5.25996)
R1^2/D10^2  : 4.26361E-02        (-0.042594      -0.042594)
kT2 [keV]   : 18.9641        (-18.9556      -18.9556)
R2^2/D10^2  : 1.20886E-03    (-0.00121093   0.00484608)
------------------------------------------------------------
#Fit statistic  : Chi-Squared                   38.16     using 59 bins.
 Reduced chi-squared =
# Null hypothesis probability of 9.59e-01 with 55 degrees of freedom

Energy  Fluence     90% Error
[keV]   [erg/cm2]   [erg/cm2]
15- 25  9.162e-08   5.851e-08
25- 50  2.179e-07   1.220e-07
50-150  4.712e-07   2.784e-07
15-150  7.808e-07   4.381e-07
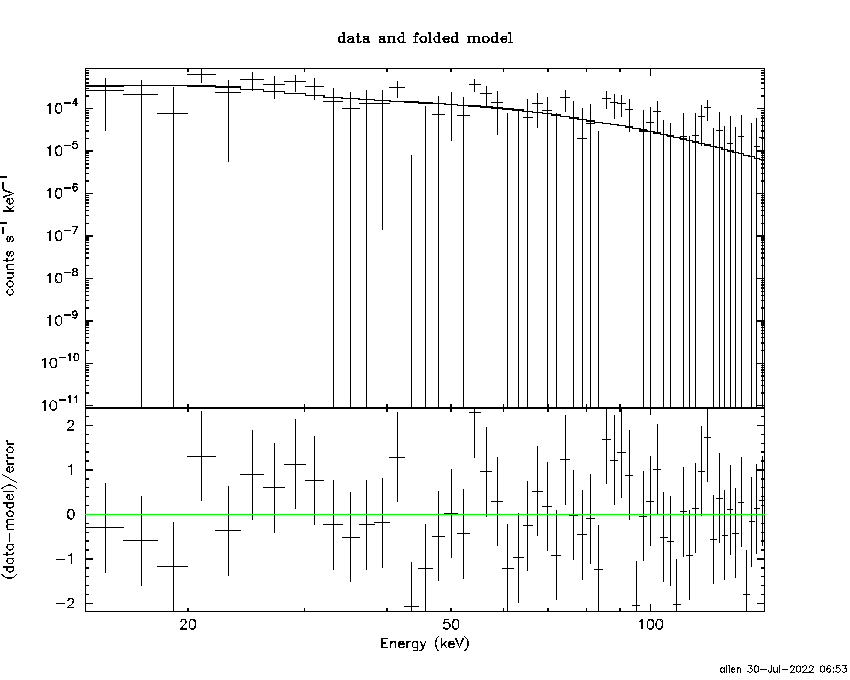
Peak spectrum fit
Power-law model

Time interval is from    0.972 sec. to    1.972 sec.

Spectral model in power-law:
------------------------------------------------------------
Parameters  : value       lower 90%   higher 90%
Photon index: 1.15198     ( -0.552363   0.508623 )
Norm@50keV  : 4.87006E-03    ( -0.00137411   0.00137411 )
------------------------------------------------------------
#Fit statistic  : Chi-Squared                   70.80     using 59 bins.
 Reduced chi-squared = 1.24211
# Null hypothesis probability of 1.03e-01 with 57 degrees of freedom

Photon flux (15-150 keV)    in 1 sec: 0.568083 ( -0.162269  0.162631 ) ph/cm2/s
Energy fluence (15-150 keV)             : 5.01095e-08 ( -1.60452e-08  1.65666e-08 ) ergs/cm2
Cutoff power-law model

Time interval is from    0.972 sec. to    1.972 sec.
Spectral model in the cutoff power-law:
------------------------------------------------------------
Parameters  : value       lower 90%   higher 90%
Photon index: 1.15271     ( -0.559875   0.507101 )
Epeak [keV] : 9999.36      ( -9999.36 -9999.36 )
Norm@50keV  : 4.89331E-03    ( -0.00138378   0.0539122 )
------------------------------------------------------------
#Fit statistic  : Chi-Squared                   70.81     using 59 bins.
 Reduced chi-squared = 1.26446
# Null hypothesis probability of 8.79e-02 with 56 degrees of freedom

Photon flux (15-150 keV)    in 1 sec: 0.570808 ( -0.17269  0.165905 ) ph/cm2/s
Energy fluence (15-150 keV)             : 5.05068e-08 ( -1.93086e-08  1.15615e-08 ) ergs/cm2
Band function

Time interval is from    0.972 sec. to    1.972 sec.


Spectral model in the Band function:
------------------------------------------------------------
Parameters  : value       lower 90%   higher 90%
alpha       :    (     )
beta        :     (     )
Epeak [keV] :       (   )
Norm@50keV   :     (     )
------------------------------------------------------------

Photon flux (15-150 keV)    in  sec:  (    ) ph/cm2/s
Energy fluence (15-150 keV)             : 0 ( 0  0 ) ergs/cm2
Single BB
Spectral model blackbody:
------------------------------------------------------------
Parameters  : value    Lower 90%  Upper 90%
kT [keV]    : 15.1959  (-5.0902  10.7036)
R^2/D10^2   : 6.30800E-02  (-0.0627591   0.189477)
(R is the radius in km and D10 is the distance to the source in units of 10 kpc)
------------------------------------------------------------
#Fit statistic  : Chi-Squared                   74.48     using 59 bins.
 Reduced chi-squared =
# Null hypothesis probability of 5.99e-02 with 57 degrees of freedom

Energy  Fluence     90% Error
[keV]   [erg/cm2]   [erg/cm2]
15- 25  3.043e-09   1.922e-09
25- 50  1.224e-08   7.375e-09
50-150  1.934e-08   1.236e-08
15-150  3.462e-08   2.241e-08
Thermal bremsstrahlung (OTTB)

Spectral model: thermal bremsstrahlung
------------------------------------------------------------
Parameters  : value         Lower 90%    Upper 90%
kT [keV]    : 199.358       (-108.973      -199.362)
Norm        : 2.30067       (-0.664709     0.666037)
------------------------------------------------------------
#Fit statistic  : Chi-Squared                   72.47     using 59 bins.
 Reduced chi-squared =
# Null hypothesis probability of 8.13e-02 with 57 degrees of freedom

Energy  Fluence     90% Error
[keV]   [erg/cm2]   [erg/cm2]
15- 25  5.729e-09   3.585e-09
25- 50  1.102e-08   6.820e-09
50-150  2.417e-08   1.461e-08
15-150  4.092e-08   2.573e-08
Double BB

Spectral model: bbodyrad<1> + bbodyrad<2>
------------------------------------------------------------
Parameters  : value         Lower 90%    Upper 90%
kT1 [keV]   : 9.87121        (-3.33517      4.27069)
R1^2/D10^2  : 0.221183        (-0.173669      0.740957)
kT2 [keV]   : 199.363        (-199.363      -199.363)
R2^2/D10^2  : 1.15380E-04    (-6.28158e-05   0.00508775)
------------------------------------------------------------
#Fit statistic  : Chi-Squared                   68.18     using 59 bins.
 Reduced chi-squared =
# Null hypothesis probability of 1.09e-01 with 55 degrees of freedom

Energy  Fluence     90% Error
[keV]   [erg/cm2]   [erg/cm2]
15- 25  4.517e-09   2.858e-09
25- 50  1.192e-08   7.100e-09
50-150  3.591e-08   8.800e-09
15-150  5.235e-08   1.780e-08
Pre-slew spectrum (Pre-slew PHA with pre-slew DRM)
Power-law model
Spectral model in power-law:
------------------------------------------------------------
Parameters  : value       lower 90%   higher 90%
Photon index: 1.42695     ( -0.446748   0.454203 )
Norm@50keV  : 7.69790E-04    ( -0.000206286   0.000201739 )
------------------------------------------------------------
#Fit statistic  : Chi-Squared                   54.27     using 59 bins.
 Reduced chi-squared =
# Null hypothesis probability of 5.78e-01 with 57 degrees of freedom

Photon flux (15-150 keV)    in 43.75 sec: 9.43357E-02 ( -0.0237874  0.0238022 ) ph/cm2/s
Energy fluence (15-150 keV)             : 3.23683e-07 ( -9.50622e-08  9.90329e-08 ) ergs/cm2
Cutoff power-law model

Spectral model in the cutoff power-law:
------------------------------------------------------------
Parameters  : value       lower 90%   higher 90%
Photon index: 1.12922     ( -1.96049   1.39035 )
Epeak [keV] : 137.595      ( -137.569 -137.569 )
Norm@50keV  : 1.11119E-03    ( -0.000542357   0.0116157 )
------------------------------------------------------------
#Fit statistic  : Chi-Squared                   54.16     using 59 bins.
 Reduced chi-squared =
# Null hypothesis probability of 5.45e-01 with 56 degrees of freedom

Photon flux (15-150 keV)    in 43.75 sec: 9.32179E-02 ( -0.0244014  0.0243781 ) ph/cm2/s
Energy fluence (15-150 keV)             : 3.13882e-07 ( -1.06509e-07  1.06424e-07 ) ergs/cm2
Band function

Spectral model in the Band function:
------------------------------------------------------------
Parameters  : value       lower 90%   higher 90%
alpha       :    (     )
beta        :     (     )
Epeak [keV] :       (   )
Norm@50keV   :     (     )
------------------------------------------------------------

Photon flux (15-150 keV)    in  sec:  (    ) ph/cm2/s
Energy fluence (15-150 keV)             : 0 ( 0  0 ) ergs/cm2
S(25-50 keV) vs. S(50-100 keV) plot

S(25-50 keV)  = 2.03e-07
S(50-100 keV) = 3.06e-07
T90 vs. Hardness ratio plot

T90                                   = 417.907999873161 sec.
Hardness ratio (energy fluence ratio) = 1.50739
Color vs. Color plot

Count Ratio  (25-50 keV) / (15-25 keV) = 1.87362
Count Ratio (50-100 keV) / (15-25 keV) = 1.73756
Mask shadow pattern

IMX = -1.708432704522193E-01, IMY = -1.086174351391151E-01
TIME vs. PHA plot around the trigger time

TIME vs. DetID plot around the trigger time

100 us light curve (15-350 keV)

Spacecraft aspect plot

Bright source in the pre-burst/pre-slew/post-slew images
Pre-burst image of 15-350 keV band
Time interval of the image:
-239.456000 0.096000

# RAcent  DECcent POSerr Theta    Phi  PeakCts   SNR AngSep     Name
#  [deg]    [deg]    ['] [deg]  [deg]                   [']
196.5383  12.0661    3.1  17.4  141.3   1.0914   3.7 ------	UNKNOWN
219.7894  79.2356    3.0  53.0   -6.1   2.4517   3.8 ------	UNKNOWN
160.6724 -22.2244    2.8  57.1 -161.5   5.1144   4.1 ------	UNKNOWN
160.1492 -15.9393    3.2  52.0 -157.0   2.7559   3.7 ------	UNKNOWN
Pre-slew background subtracted image of 15-350 keV band
Time interval of the image:
0.096000 43.844590

# RAcent  DECcent POSerr Theta    Phi  PeakCts   SNR AngSep     Name
#  [deg]    [deg]    ['] [deg]  [deg]                   [']
163.1471 -11.1695    2.4  46.4 -156.9   0.8467   4.8 ------	UNKNOWN
132.3664  75.1915    2.2  54.7  -28.1   2.2181   5.2 ------	UNKNOWN
140.4065  38.0238    2.6  41.4  -76.1   1.5535   4.5 ------	UNKNOWN
Post-slew image of 15-350 keV band
Time interval of the image:
74.844590 437.844600

# RAcent  DECcent POSerr Theta    Phi  PeakCts   SNR AngSep     Name
#  [deg]    [deg]    ['] [deg]  [deg]                   [']
229.6090  41.8736    4.5  39.9   30.3   1.6461   2.6 ------	UNKNOWN
229.9444  46.2706    2.4  42.2   24.6   3.4019   4.9 ------	UNKNOWN
Plot creation:
Sat Jul 30 06:53:34 EDT 2022