Estimated redshift from machine learning (Ukwatta et al. 2016) - may take a few minute to calcaulte
Image
Pre-slew 15.0-350.0 keV image (Event data)

#   RAcent    DECcent   POSerr    Theta     Phi              Peak Cts       SNR   Name
  193.3326    19.2107   0.0238     2.1128   -13.4780         0.0777405      7.985 TRIG_01061687

Foreground time interval of the image:
 -0.004   0.424 (delta_t =   0.428 [sec])
Background time interval of the image:
-26.835  -0.004 (delta_t =  26.831 [sec])
Lightcurves
Notes:
- 1) The mask-weighted light curves are using the flight position.
- 2) Multiple plots of different time binning/intervals are shown to cover all scenarios of short/long GRBs, rate/image triggers, and real/false positives.
- 3) For all the mask-weighted lightcurves, the y-axis units are counts/sec/det where a det is 0.4 x 0.4 = 0.16 sq cm.
- 4) The verticle lines correspond to following: green dotted lines are T50 interval, black dotted lines are T90 interval, blue solid line(s) is a spacecraft slew start time, and orange solid line(s) is a spacecraft slew end time.
- 5) Time of each bin is in the middle of the bin.
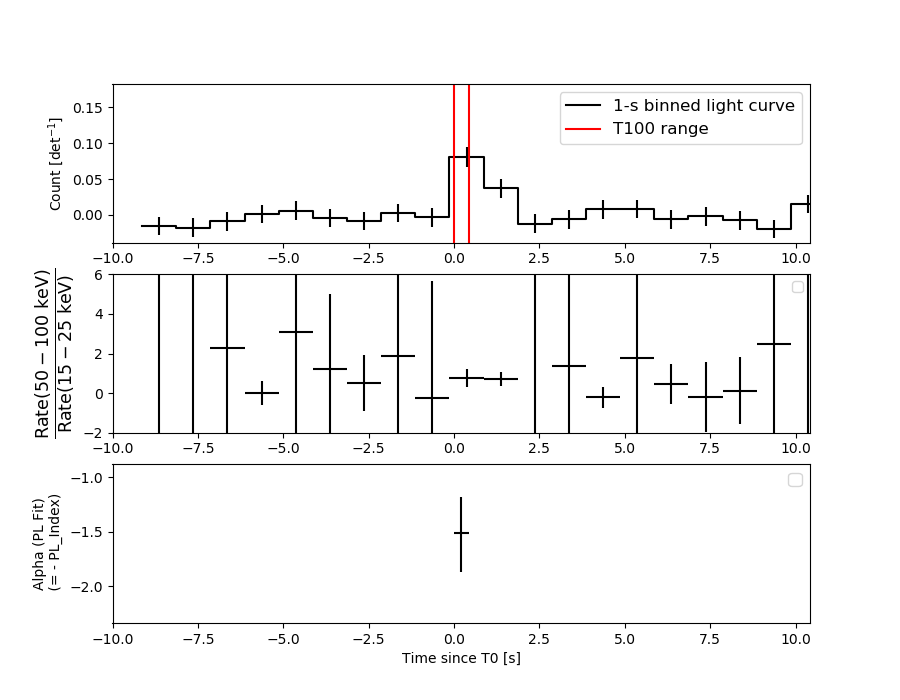
1 s binning
From T0-310 s to T0+310 s

From T100_start - 20 s to T100_end + 30 s

Full time interval
64 ms binning
Full time interval

From T100_start to T100_end

From T0-5 sec to T0+5 sec

16 ms binning
From T100_start-5 s to T100_start+5 s
Blue+Cyan dotted lines: Time interval of the scaled map
From 0.000000 to 0.512000
8 ms binning
From T100_start-3 s to T100_start+3 s

Blue+Cyan dotted lines: Time interval of the scaled map
From 0.000000 to 0.512000
2 ms binning
From T100_start-1 s to T100_start+1 s
Blue+Cyan dotted lines: Time interval of the scaled map
From 0.000000 to 0.512000
SN=5 or 10 sec. binning (whichever binning is satisfied first)
SN=5 or 10 sec. binning (T < 200 sec)

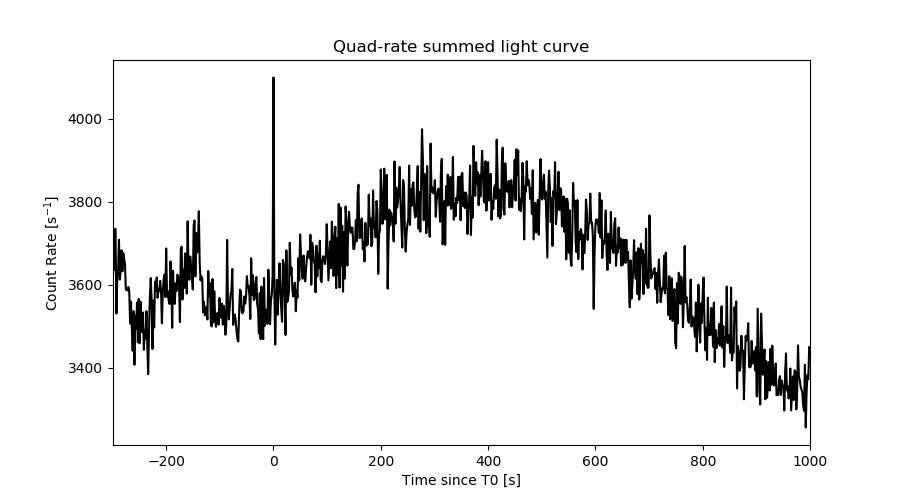
Quad-rate summed light curves (from T0-300s to T0+1000s)
Spectral Evolution
Spectra
Notes:
- 1) The fitting includes the systematic errors.
- 2) When the burst includes telescope slew time periods, the fitting uses an average response file made from multiple 5-s response files through out the slew time plus single time preiod for the non-slew times, and weighted by the total counts in the corresponding time period using addrmf. An average response file is needed becuase a spectral fit using the pre-slew DRM will introduce some errors in both a spectral shape and a normalization if the PHA file contains a lot of the slew/post-slew time interval.
- 3) For fits to more complicated models (e.g. a power-law over a cutoff power-law), the BAT team has decided to require a chi-square improvement of more than 6 for each extra dof.
Time averaged spectrum fit using the average DRM
Power-law model

Time interval is from   -0.004 sec. to    0.424 sec.

Spectral model in power-law:
------------------------------------------------------------
Parameters  : value       lower 90%   higher 90%
Photon index: 1.51578     ( -0.335594   0.352783 )
Norm@50keV  : 1.06356E-02    ( -0.00242175   0.00237018 )
------------------------------------------------------------
#Fit statistic  : Chi-Squared                   57.23     using 59 bins.
 Reduced chi-squared = 1.00404
# Null hypothesis probability of 4.67e-01 with 57 degrees of freedom

Photon flux (15-150 keV)    in 0.428 sec: 1.33349 ( -0.28158  0.28163 ) ph/cm2/s
Energy fluence (15-150 keV)             : 4.30799e-08 ( -1.05552e-08  1.07426e-08 ) ergs/cm2
Cutoff power-law model

Time interval is from   -0.004 sec. to    0.424 sec.
Spectral model in the cutoff power-law:
------------------------------------------------------------
Parameters  : value       lower 90%   higher 90%
Photon index: 0.906373     ( -1.68604   0.915172 )
Epeak [keV] : 85.7934      ( -38.1719 -85.7934 )
Norm@50keV  : 2.25489E-02    ( -0.0140209   0.154614 )
------------------------------------------------------------
#Fit statistic  : Chi-Squared                   56.61     using 59 bins.
 Reduced chi-squared = 1.01089
# Null hypothesis probability of 4.52e-01 with 56 degrees of freedom

Photon flux (15-150 keV)    in 0.428 sec: 1.32056 ( -0.28403  0.28346 ) ph/cm2/s
Energy fluence (15-150 keV)             : 4.147e-08 ( -1.11769e-08  1.13568e-08 ) ergs/cm2
Band function

Time interval is from   -0.004 sec. to    0.424 sec.


Spectral model in the Band function:
------------------------------------------------------------
Parameters  : value       lower 90%   higher 90%
alpha       :    (     )
beta        :     (     )
Epeak [keV] :       (   )
Norm@50keV   :     (     )
------------------------------------------------------------

Photon flux (15-150 keV)    in  sec:  (    ) ph/cm2/s
Energy fluence (15-150 keV)             : 0 ( 0  0 ) ergs/cm2
Single BB

Spectral model blackbody:
------------------------------------------------------------
Parameters  : value    Lower 90%  Upper 90%
kT [keV]    : 14.0066  (-3.49696  4.51305)
R^2/D10^2   : 0.200635  (-0.12491   0.340573)
(R is the radius in km and D10 is the distance to the source in units of 10 kpc)
------------------------------------------------------------
#Fit statistic  : Chi-Squared                   61.41     using 59 bins.
 Reduced chi-squared =
# Null hypothesis probability of 3.21e-01 with 57 degrees of freedom

Energy  Fluence     90% Error
[keV]   [erg/cm2]   [erg/cm2]
15- 25  3.559e-09   1.418e-09
25- 50  1.324e-08   4.267e-09
50-150  1.711e-08   8.712e-09
15-150  3.391e-08   1.285e-08
Thermal bremsstrahlung (OTTB)

Spectral model: thermal bremsstrahlung
------------------------------------------------------------
Parameters  : value         Lower 90%    Upper 90%
kT [keV]    : 199.338       (-117.553      -199.349)
Norm        : 5.49265       (-1.15358     1.15452)
------------------------------------------------------------
#Fit statistic  : Chi-Squared                   56.79     using 59 bins.
 Reduced chi-squared =
# Null hypothesis probability of 4.83e-01 with 57 degrees of freedom

Energy  Fluence     90% Error
[keV]   [erg/cm2]   [erg/cm2]
15- 25  5.854e-09   3.510e-09
25- 50  1.126e-08   6.559e-09
50-150  2.470e-08   1.432e-08
15-150  4.181e-08   2.437e-08
Double BB

Spectral model: bbodyrad<1> + bbodyrad<2>
------------------------------------------------------------
Parameters  : value         Lower 90%    Upper 90%
kT1 [keV]   : 6.93181        (-3.78323      5.35211)
R1^2/D10^2  : 1.40331        (-1.15978      26.3722)
kT2 [keV]   : 23.7745        (-20.5799      -23.6617)
R2^2/D10^2  : 2.31140E-02    (-0.0232699   0.125866)
------------------------------------------------------------
#Fit statistic  : Chi-Squared                   56.13     using 59 bins.
 Reduced chi-squared =
# Null hypothesis probability of 4.32e-01 with 55 degrees of freedom

Energy  Fluence     90% Error
[keV]   [erg/cm2]   [erg/cm2]
15- 25  5.586e-09   3.266e-09
25- 50  1.167e-08   6.165e-09
50-150  2.420e-08   1.510e-08
15-150  4.146e-08   2.159e-08
Peak spectrum fit
Power-law model

Time interval is from   -0.288 sec. to    0.712 sec.

Spectral model in power-law:
------------------------------------------------------------
Parameters  : value       lower 90%   higher 90%
Photon index: 1.68200     ( -0.442646   0.491058 )
Norm@50keV  : 4.86992E-03    ( -0.0015699   0.00149984 )
------------------------------------------------------------
#Fit statistic  : Chi-Squared                   50.31     using 59 bins.
 Reduced chi-squared = 0.882632
# Null hypothesis probability of 7.22e-01 with 57 degrees of freedom

Photon flux (15-150 keV)    in 1 sec: 0.642790 ( -0.172965  0.172974 ) ph/cm2/s
Energy fluence (15-150 keV)             : 4.51627e-08 ( -1.47139e-08  1.54174e-08 ) ergs/cm2
Cutoff power-law model

Time interval is from   -0.288 sec. to    0.712 sec.
Spectral model in the cutoff power-law:
------------------------------------------------------------
Parameters  : value       lower 90%   higher 90%
Photon index: 0.840585     ( -3.29753   1.35379 )
Epeak [keV] : 57.7464      ( -57.7449 -57.7449 )
Norm@50keV  : 1.50966E-02    ( -0.0150978   1.75554 )
------------------------------------------------------------
#Fit statistic  : Chi-Squared                   49.80     using 59 bins.
 Reduced chi-squared = 0.889286
# Null hypothesis probability of 7.07e-01 with 56 degrees of freedom

Photon flux (15-150 keV)    in 1 sec: 0.630264 ( -0.175298  0.17579 ) ph/cm2/s
Energy fluence (15-150 keV)             : 4.12715e-08 ( -1.56208e-08  1.77486e-08 ) ergs/cm2
Band function

Time interval is from   -0.288 sec. to    0.712 sec.


Spectral model in the Band function:
------------------------------------------------------------
Parameters  : value       lower 90%   higher 90%
alpha       :    (     )
beta        :     (     )
Epeak [keV] :       (   )
Norm@50keV   :     (     )
------------------------------------------------------------

Photon flux (15-150 keV)    in  sec:  (    ) ph/cm2/s
Energy fluence (15-150 keV)             : 0 ( 0  0 ) ergs/cm2
Single BB
Spectral model blackbody:
------------------------------------------------------------
Parameters  : value    Lower 90%  Upper 90%
kT [keV]    : 10.8549  (-3.00353  4.39842)
R^2/D10^2   : 0.235626  (-0.167582   0.521307)
(R is the radius in km and D10 is the distance to the source in units of 10 kpc)
------------------------------------------------------------
#Fit statistic  : Chi-Squared                   51.64     using 59 bins.
 Reduced chi-squared =
# Null hypothesis probability of 6.76e-01 with 57 degrees of freedom

Energy  Fluence     90% Error
[keV]   [erg/cm2]   [erg/cm2]
15- 25  5.785e-09   3.541e-09
25- 50  1.608e-08   7.668e-09
50-150  1.059e-08   7.611e-09
15-150  3.246e-08   1.785e-08
Thermal bremsstrahlung (OTTB)

Spectral model: thermal bremsstrahlung
------------------------------------------------------------
Parameters  : value         Lower 90%    Upper 90%
kT [keV]    : 121.197       (-74.2999      -119.483)
Norm        : 2.76145       (-0.805192     1.22885)
------------------------------------------------------------
#Fit statistic  : Chi-Squared                   49.91     using 59 bins.
 Reduced chi-squared =
# Null hypothesis probability of 7.36e-01 with 57 degrees of freedom

Energy  Fluence     90% Error
[keV]   [erg/cm2]   [erg/cm2]
15- 25  7.190e-09   4.263e-09
25- 50  1.288e-08   7.485e-09
50-150  2.311e-08   1.664e-08
15-150  4.318e-08   2.822e-08
Double BB

Spectral model: bbodyrad<1> + bbodyrad<2>
------------------------------------------------------------
Parameters  : value         Lower 90%    Upper 90%
kT1 [keV]   : 7.20369        (-7.56291      5.45373)
R1^2/D10^2  : 0.714816        (-0.646959      -0.646959)
kT2 [keV]   : 22.4016        (-26.2854      -26.2854)
R2^2/D10^2  : 9.69041E-03    (-0.00571901   0.35058)
------------------------------------------------------------
#Fit statistic  : Chi-Squared                   49.35     using 59 bins.
 Reduced chi-squared =
# Null hypothesis probability of 6.89e-01 with 55 degrees of freedom

Energy  Fluence     90% Error
[keV]   [erg/cm2]   [erg/cm2]
15- 25  7.026e-09   4.458e-09
25- 50  1.364e-08   7.900e-09
50-150  1.952e-08   1.236e-08
15-150  4.018e-08   2.299e-08
Pre-slew spectrum (Pre-slew PHA with pre-slew DRM)
Power-law model

Spectral model in power-law:
------------------------------------------------------------
Parameters  : value       lower 90%   higher 90%
Photon index: 1.51578     ( -0.335594   0.352783 )
Norm@50keV  : 1.06356E-02    ( -0.00242175   0.00237018 )
------------------------------------------------------------
#Fit statistic  : Chi-Squared                   57.23     using 59 bins.
 Reduced chi-squared =
# Null hypothesis probability of 4.67e-01 with 57 degrees of freedom

Photon flux (15-150 keV)    in 0.428 sec: 1.33346 ( -0.281572  0.281616 ) ph/cm2/s
Energy fluence (15-150 keV)             : 4.30743e-08 ( -1.05498e-08  1.076e-08 ) ergs/cm2
Cutoff power-law model

Spectral model in the cutoff power-law:
------------------------------------------------------------
Parameters  : value       lower 90%   higher 90%
Photon index: 0.906371     ( -1.68604   0.915173 )
Epeak [keV] : 85.7933      ( -38.1718 -85.7933 )
Norm@50keV  : 2.25489E-02    ( -0.0140209   0.154614 )
------------------------------------------------------------
#Fit statistic  : Chi-Squared                   56.61     using 59 bins.
 Reduced chi-squared =
# Null hypothesis probability of 4.52e-01 with 56 degrees of freedom

Photon flux (15-150 keV)    in 0.428 sec: 1.32042 ( -0.28075  0.28341 ) ph/cm2/s
Energy fluence (15-150 keV)             : 4.14857e-08 ( -1.11781e-08  1.13621e-08 ) ergs/cm2
Band function

Spectral model in the Band function:
------------------------------------------------------------
Parameters  : value       lower 90%   higher 90%
alpha       :    (     )
beta        :     (     )
Epeak [keV] :       (   )
Norm@50keV   :     (     )
------------------------------------------------------------

Photon flux (15-150 keV)    in  sec:  (    ) ph/cm2/s
Energy fluence (15-150 keV)             : 0 ( 0  0 ) ergs/cm2
S(25-50 keV) vs. S(50-100 keV) plot

S(25-50 keV)  = 1.07e-08
S(50-100 keV) = 1.50e-08
T90 vs. Hardness ratio plot

T90                                   = 0.383999943733215 sec.
Hardness ratio (energy fluence ratio) = 1.40187
Color vs. Color plot

Count Ratio  (25-50 keV) / (15-25 keV) = 1.94039
Count Ratio (50-100 keV) / (15-25 keV) = 1.42941
Mask shadow pattern

IMX = 3.587654926147974E-02, IMY = 8.598641932710489E-03
TIME vs. PHA plot around the trigger time

Blue+Cyan dotted lines: Time interval of the scaled map
From 0.000000 to 0.512000
TIME vs. DetID plot around the trigger time

Blue+Cyan dotted lines: Time interval of the scaled map
From 0.000000 to 0.512000
100 us light curve (15-350 keV)
Blue+Cyan dotted lines: Time interval of the scaled map
From 0.000000 to 0.512000
Spacecraft aspect plot

Bright source in the pre-burst/pre-slew/post-slew images
Pre-burst image of 15-350 keV band
Time interval of the image:
-26.835400 -0.004000

# RAcent  DECcent POSerr Theta    Phi  PeakCts   SNR AngSep     Name
#  [deg]    [deg]    ['] [deg]  [deg]                   [']
241.8080  55.4600    2.4  53.2    8.1   1.1855   4.9 ------	UNKNOWN
161.8745 -12.7998    2.3  42.9 -156.4   0.5670   5.0 ------	UNKNOWN
156.9122  58.8761    2.3  49.3  -47.7   1.7872   5.0 ------	UNKNOWN
Pre-slew background subtracted image of 15-350 keV band
Time interval of the image:
-0.004000 0.424000

# RAcent  DECcent POSerr Theta    Phi  PeakCts   SNR AngSep     Name
#  [deg]    [deg]    ['] [deg]  [deg]                   [']
199.0303  11.9725    2.2   7.8  106.2   0.0506   5.2 ------	UNKNOWN
193.3326  19.2107    1.4   2.1  -13.5   0.0777   8.0 ------	UNKNOWN
Post-slew image of 15-350 keV band
Time interval of the image:
40.364610 962.915500

# RAcent  DECcent POSerr Theta    Phi  PeakCts   SNR AngSep     Name
#  [deg]    [deg]    ['] [deg]  [deg]                   [']
215.5306  24.2845    2.8  21.2   60.0   4.3589   4.2 ------	UNKNOWN
242.4043  64.1502    3.2  55.5   11.4  19.9818   3.6 ------	UNKNOWN
166.5720 -32.3904    2.9  57.6 -165.4  21.1502   3.9 ------	UNKNOWN
Plot creation:
Sat Jul 30 06:53:02 EDT 2022