Estimated redshift from machine learning (Ukwatta et al. 2016) - may take a few minute to calcaulte
Image
Pre-slew 15.0-350.0 keV image (Event data)
#   RAcent    DECcent   POSerr    Theta     Phi              Peak Cts       SNR   Name
  149.5699    69.7035   0.0065    30.0697   -55.3614         1.8762476     29.803 TRIG_01062150

Foreground time interval of the image:
 -0.320   5.012 (delta_t =   5.332 [sec])
Background time interval of the image:
-239.672  -0.320 (delta_t = 239.352 [sec])
Lightcurves
Notes:
- 1) The mask-weighted light curves are using the flight position.
- 2) Multiple plots of different time binning/intervals are shown to cover all scenarios of short/long GRBs, rate/image triggers, and real/false positives.
- 3) For all the mask-weighted lightcurves, the y-axis units are counts/sec/det where a det is 0.4 x 0.4 = 0.16 sq cm.
- 4) The verticle lines correspond to following: green dotted lines are T50 interval, black dotted lines are T90 interval, blue solid line(s) is a spacecraft slew start time, and orange solid line(s) is a spacecraft slew end time.
- 5) Time of each bin is in the middle of the bin.
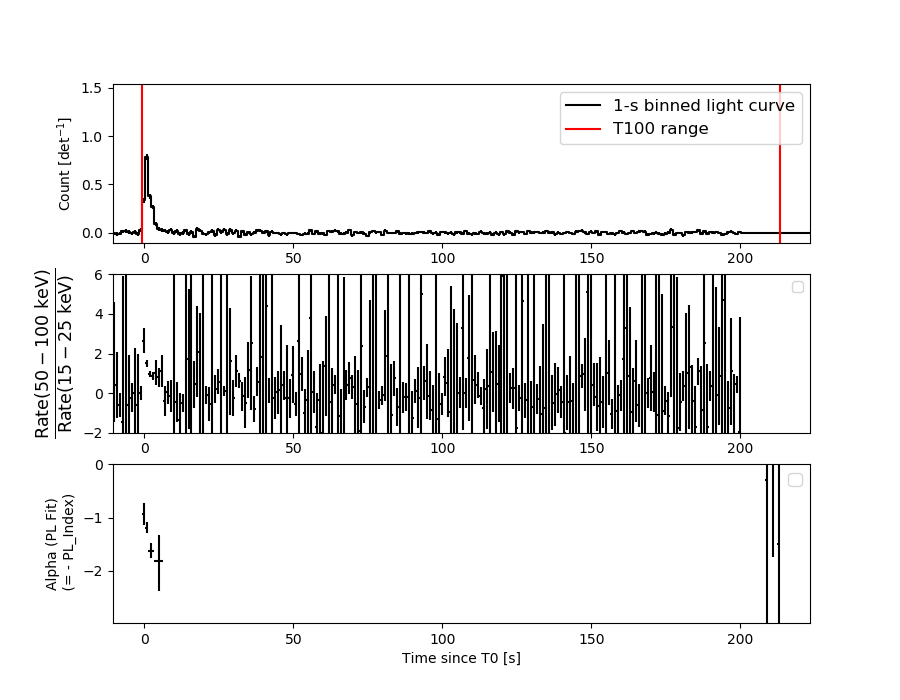
1 s binning
From T0-310 s to T0+310 s

From T100_start - 20 s to T100_end + 30 s

Full time interval
64 ms binning
Full time interval
From T100_start to T100_end
From T0-5 sec to T0+5 sec
16 ms binning
From T100_start-5 s to T100_start+5 s
Blue+Cyan dotted lines: Time interval of the scaled map
From 0.000000 to 1.024000
8 ms binning
From T100_start-3 s to T100_start+3 s
Blue+Cyan dotted lines: Time interval of the scaled map
From 0.000000 to 1.024000
2 ms binning
From T100_start-1 s to T100_start+1 s

Blue+Cyan dotted lines: Time interval of the scaled map
From 0.000000 to 1.024000
SN=5 or 10 sec. binning (whichever binning is satisfied first)

SN=5 or 10 sec. binning (T < 200 sec)
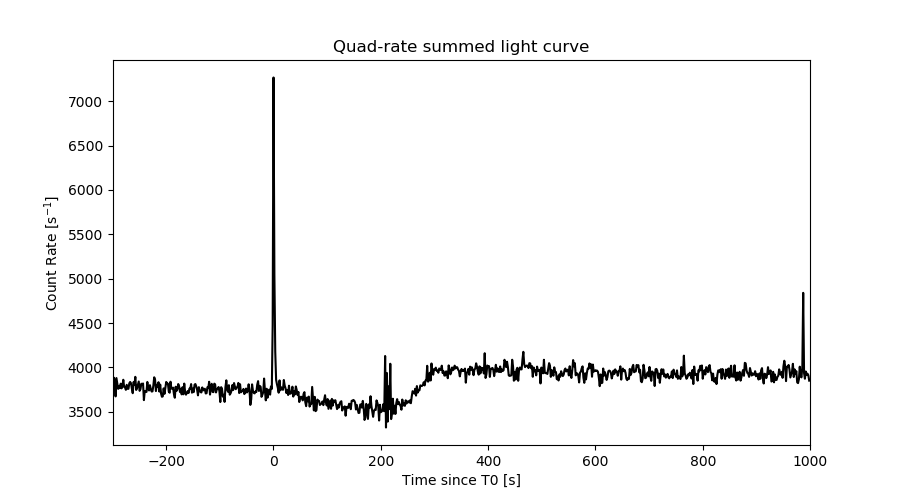
Quad-rate summed light curves (from T0-300s to T0+1000s)
Spectral Evolution
Spectra
Notes:
- 1) The fitting includes the systematic errors.
- 2) When the burst includes telescope slew time periods, the fitting uses an average response file made from multiple 5-s response files through out the slew time plus single time preiod for the non-slew times, and weighted by the total counts in the corresponding time period using addrmf. An average response file is needed becuase a spectral fit using the pre-slew DRM will introduce some errors in both a spectral shape and a normalization if the PHA file contains a lot of the slew/post-slew time interval.
- 3) For fits to more complicated models (e.g. a power-law over a cutoff power-law), the BAT team has decided to require a chi-square improvement of more than 6 for each extra dof.
Time averaged spectrum fit using the average DRM
Power-law model
Time interval is from   -0.672 sec. to  213.328 sec.

Spectral model in power-law:
------------------------------------------------------------
Parameters  : value       lower 90%   higher 90%
Photon index: 1.14339     ( -0.266776   0.257627 )
Norm@50keV  : 7.20959E-04    ( -0.000105768   0.000105613 )
------------------------------------------------------------
#Fit statistic  : Chi-Squared                   54.78     using 59 bins.
 Reduced chi-squared = 0.961053
# Null hypothesis probability of 5.59e-01 with 57 degrees of freedom

Photon flux (15-150 keV)    in 214 sec: 8.40135E-02 ( -0.0126873  0.0127289 ) ph/cm2/s
Energy fluence (15-150 keV)             : 1.59164e-06 ( -2.56567e-07  2.59353e-07 ) ergs/cm2
Cutoff power-law model
Time interval is from   -0.672 sec. to  213.328 sec.
Spectral model in the cutoff power-law:
------------------------------------------------------------
Parameters  : value       lower 90%   higher 90%
Photon index: 0.916919     ( -1.1522   0.675519 )
Epeak [keV] : 256.377      ( -256.422 -256.422 )
Norm@50keV  : 9.24682E-04    ( -0.000300438   0.0022396 )
------------------------------------------------------------
#Fit statistic  : Chi-Squared                   54.62     using 59 bins.
 Reduced chi-squared = 0.975357
# Null hypothesis probability of 5.27e-01 with 56 degrees of freedom

Photon flux (15-150 keV)    in 214 sec: 8.31845E-02 ( -0.0131919  0.0131744 ) ph/cm2/s
Energy fluence (15-150 keV)             : 1.56615e-06 ( -2.85579e-07  2.7642e-07 ) ergs/cm2
Band function

Time interval is from   -0.672 sec. to  213.328 sec.


Spectral model in the Band function:
------------------------------------------------------------
Parameters  : value       lower 90%   higher 90%
alpha       :    (     )
beta        :     (     )
Epeak [keV] :       (   )
Norm@50keV   :     (     )
------------------------------------------------------------

Photon flux (15-150 keV)    in  sec:  (    ) ph/cm2/s
Energy fluence (15-150 keV)             : 0 ( 0  0 ) ergs/cm2
Single BB
Spectral model blackbody:
------------------------------------------------------------
Parameters  : value    Lower 90%  Upper 90%
kT [keV]    : 18.6398  (-3.57566  4.90822)
R^2/D10^2   : 4.85624E-03  (-0.00257671   0.0050176)
(R is the radius in km and D10 is the distance to the source in units of 10 kpc)
------------------------------------------------------------
#Fit statistic  : Chi-Squared                   63.29     using 59 bins.
 Reduced chi-squared =
# Null hypothesis probability of 2.64e-01 with 57 degrees of freedom

Energy  Fluence     90% Error
[keV]   [erg/cm2]   [erg/cm2]
15- 25  7.145e-08   2.326e-08
25- 50  3.390e-07   9.080e-08
50-150  8.622e-07   2.419e-07
15-150  1.273e-06   2.949e-07
Thermal bremsstrahlung (OTTB)
Spectral model: thermal bremsstrahlung
------------------------------------------------------------
Parameters  : value         Lower 90%    Upper 90%
kT [keV]    : 200.000       (-46.802      -200)
Norm        : 0.347310       (-0.0521727     0.0521727)
------------------------------------------------------------
#Fit statistic  : Chi-Squared                   61.22     using 59 bins.
 Reduced chi-squared =
# Null hypothesis probability of 3.27e-01 with 57 degrees of freedom

Energy  Fluence     90% Error
[keV]   [erg/cm2]   [erg/cm2]
15- 25  1.851e-07   1.058e-07
25- 50  3.560e-07   2.022e-07
50-150  7.808e-07   4.435e-07
15-150  1.322e-06   7.485e-07
Double BB
Spectral model: bbodyrad<1> + bbodyrad<2>
------------------------------------------------------------
Parameters  : value         Lower 90%    Upper 90%
kT1 [keV]   : 10.3084        (-3.61165      4.37239)
R1^2/D10^2  : 2.36228E-02        (-0.0152535      0.0584341)
kT2 [keV]   : 49.6665        (-24.4999      -49.6665)
R2^2/D10^2  : 1.87427E-04    (-0.000173013   0.00156134)
------------------------------------------------------------
#Fit statistic  : Chi-Squared                   53.10     using 59 bins.
 Reduced chi-squared =
# Null hypothesis probability of 5.47e-01 with 55 degrees of freedom

Energy  Fluence     90% Error
[keV]   [erg/cm2]   [erg/cm2]
15- 25  1.213e-07   7.109e-08
25- 50  3.649e-07   2.019e-07
50-150  1.114e-06   5.778e-07
15-150  1.601e-06   8.116e-07
Peak spectrum fit
Power-law model

Time interval is from    0.172 sec. to    1.172 sec.

Spectral model in power-law:
------------------------------------------------------------
Parameters  : value       lower 90%   higher 90%
Photon index: 1.18690     ( -0.105448   0.104895 )
Norm@50keV  : 5.47189E-02    ( -0.00340792   0.00340767 )
------------------------------------------------------------
#Fit statistic  : Chi-Squared                   49.85     using 59 bins.
 Reduced chi-squared = 0.874561
# Null hypothesis probability of 7.38e-01 with 57 degrees of freedom

Photon flux (15-150 keV)    in 1 sec: 6.41132 ( -0.40715  0.40738 ) ph/cm2/s
Energy fluence (15-150 keV)             : 5.57276e-07 ( -3.88103e-08  3.90037e-08 ) ergs/cm2
Cutoff power-law model

Time interval is from    0.172 sec. to    1.172 sec.
Spectral model in the cutoff power-law:
------------------------------------------------------------
Parameters  : value       lower 90%   higher 90%
Photon index: 0.980577     ( -0.423067   0.258607 )
Epeak [keV] : 265.944      ( -265.947 -265.947 )
Norm@50keV  : 6.88070E-02    ( -0.0166571   0.0397329 )
------------------------------------------------------------
#Fit statistic  : Chi-Squared                   49.05     using 59 bins.
 Reduced chi-squared = 0.875893
# Null hypothesis probability of 7.33e-01 with 56 degrees of freedom

Photon flux (15-150 keV)    in 1 sec: 6.37299 ( -0.41373  0.41365 ) ph/cm2/s
Energy fluence (15-150 keV)             : 5.51341e-07 ( -4.10005e-08  4.07112e-08 ) ergs/cm2
Band function

Time interval is from    0.172 sec. to    1.172 sec.


Spectral model in the Band function:
------------------------------------------------------------
Parameters  : value       lower 90%   higher 90%
alpha       :    (     )
beta        :     (     )
Epeak [keV] :       (   )
Norm@50keV   :     (     )
------------------------------------------------------------

Photon flux (15-150 keV)    in  sec:  (    ) ph/cm2/s
Energy fluence (15-150 keV)             : 0 ( 0  0 ) ergs/cm2
Single BB
Spectral model blackbody:
------------------------------------------------------------
Parameters  : value    Lower 90%  Upper 90%
kT [keV]    : 20.2348  (-1.56333  1.74359)
R^2/D10^2   : 0.319064  (-0.074474   0.0945152)
(R is the radius in km and D10 is the distance to the source in units of 10 kpc)
------------------------------------------------------------
#Fit statistic  : Chi-Squared                   86.21     using 59 bins.
 Reduced chi-squared =
# Null hypothesis probability of 7.51e-03 with 57 degrees of freedom

Energy  Fluence     90% Error
[keV]   [erg/cm2]   [erg/cm2]
15- 25  2.507e-08   3.035e-09
25- 50  1.258e-07   1.065e-08
50-150  3.825e-07   3.835e-08
15-150  5.334e-07   4.165e-08
Thermal bremsstrahlung (OTTB)
Spectral model: thermal bremsstrahlung
------------------------------------------------------------
Parameters  : value         Lower 90%    Upper 90%
kT [keV]    : 200.000       (-8.58085      -200)
Norm        : 27.3800       (-1.70038     1.70038)
------------------------------------------------------------
#Fit statistic  : Chi-Squared                  107.07     using 59 bins.
 Reduced chi-squared =
# Null hypothesis probability of 6.71e-05 with 57 degrees of freedom

Energy  Fluence     90% Error
[keV]   [erg/cm2]   [erg/cm2]
15- 25  6.815e-08   4.625e-09
25- 50  1.311e-07   1.165e-08
50-150  2.875e-07   5.985e-08
15-150  4.868e-07   9.875e-08
Double BB
Spectral model: bbodyrad<1> + bbodyrad<2>
------------------------------------------------------------
Parameters  : value         Lower 90%    Upper 90%
kT1 [keV]   : 10.1145        (-2.29166      2.65868)
R1^2/D10^2  : 1.69133        (-0.744454      1.67292)
kT2 [keV]   : 38.2260        (-9.20864      27.6388)
R2^2/D10^2  : 3.32865E-02    (-0.0260106   0.0503943)
------------------------------------------------------------
#Fit statistic  : Chi-Squared                   42.56     using 59 bins.
 Reduced chi-squared =
# Null hypothesis probability of 8.90e-01 with 55 degrees of freedom

Energy  Fluence     90% Error
[keV]   [erg/cm2]   [erg/cm2]
15- 25  4.185e-08   1.188e-08
25- 50  1.330e-07   3.337e-08
50-150  4.419e-07   1.898e-07
15-150  6.167e-07   2.092e-07
Pre-slew spectrum (Pre-slew PHA with pre-slew DRM)
Power-law model

Spectral model in power-law:
------------------------------------------------------------
Parameters  : value       lower 90%   higher 90%
Photon index: 1.35666     ( -0.086884   0.0869181 )
Norm@50keV  : 2.43146E-02    ( -0.00120827   0.00120762 )
------------------------------------------------------------
#Fit statistic  : Chi-Squared                   56.91     using 59 bins.
 Reduced chi-squared =
# Null hypothesis probability of 4.78e-01 with 57 degrees of freedom

Photon flux (15-150 keV)    in 5.332 sec: 2.93324 ( -0.149725  0.149911 ) ph/cm2/s
Energy fluence (15-150 keV)             : 1.26433e-06 ( -6.95245e-08  6.98055e-08 ) ergs/cm2
Cutoff power-law model
Spectral model in the cutoff power-law:
------------------------------------------------------------
Parameters  : value       lower 90%   higher 90%
Photon index: 0.996272     ( -0.375971   0.344879 )
Epeak [keV] : 146.651      ( -49.7247 2997.8 )
Norm@50keV  : 3.63216E-02    ( -0.0113044   0.0183025 )
------------------------------------------------------------
#Fit statistic  : Chi-Squared                   53.72     using 59 bins.
 Reduced chi-squared =
# Null hypothesis probability of 5.62e-01 with 56 degrees of freedom

Photon flux (15-150 keV)    in 5.332 sec: 2.88375 ( -0.15701  0.15686 ) ph/cm2/s
Energy fluence (15-150 keV)             : 1.23499e-06 ( -7.63063e-08  7.58477e-08 ) ergs/cm2
Band function

Spectral model in the Band function:
------------------------------------------------------------
Parameters  : value       lower 90%   higher 90%
alpha       :    (     )
beta        :     (     )
Epeak [keV] :       (   )
Norm@50keV   :     (     )
------------------------------------------------------------

Photon flux (15-150 keV)    in  sec:  (    ) ph/cm2/s
Energy fluence (15-150 keV)             : 0 ( 0  0 ) ergs/cm2
S(25-50 keV) vs. S(50-100 keV) plot
S(25-50 keV)  = 3.23e-07
S(50-100 keV) = 5.84e-07
T90 vs. Hardness ratio plot
T90                                   = 3.85999989509583 sec.
Hardness ratio (energy fluence ratio) = 1.80805
Color vs. Color plot
Count Ratio  (25-50 keV) / (15-25 keV) = 1.50516
Count Ratio (50-100 keV) / (15-25 keV) = 1.30293
Mask shadow pattern

IMX = 3.290872601135894E-01, IMY = 4.763524701263181E-01
TIME vs. PHA plot around the trigger time

Blue+Cyan dotted lines: Time interval of the scaled map
From 0.000000 to 1.024000
TIME vs. DetID plot around the trigger time
Blue+Cyan dotted lines: Time interval of the scaled map
From 0.000000 to 1.024000
100 us light curve (15-350 keV)
Blue+Cyan dotted lines: Time interval of the scaled map
From 0.000000 to 1.024000
Spacecraft aspect plot
Bright source in the pre-burst/pre-slew/post-slew images
Pre-burst image of 15-350 keV band
Time interval of the image:
-239.672000 -0.320000

# RAcent  DECcent POSerr Theta    Phi  PeakCts   SNR AngSep     Name
#  [deg]    [deg]    ['] [deg]  [deg]                   [']
254.3938  35.2481    6.7  33.0  104.8   0.9524   1.7    6.5	Her X-1
234.0288  17.1920    2.4  43.0  143.7   3.8232   4.8 ------	UNKNOWN
260.0532  57.7529    3.1  21.3   60.0   1.1564   3.7 ------	UNKNOWN
180.9736  37.9453    2.8  32.0 -128.6   1.8709   4.2 ------	UNKNOWN
120.3958  63.9429    2.8  42.7  -54.8   3.4854   4.2 ------	UNKNOWN
Pre-slew background subtracted image of 15-350 keV band
Time interval of the image:
-0.320000 5.012000

# RAcent  DECcent POSerr Theta    Phi  PeakCts   SNR AngSep     Name
#  [deg]    [deg]    ['] [deg]  [deg]                   [']
254.4901  35.1565    0.0  33.1  104.8  -0.1536  -2.1   11.3	Her X-1
239.7581  16.9013    2.8  44.6  136.1   0.6270   4.1 ------	UNKNOWN
268.2280  51.0813    2.3  28.6   68.8   0.3295   5.1 ------	UNKNOWN
277.1849  65.0666    2.4  27.0   37.1   0.2639   4.8 ------	UNKNOWN
149.5699  69.7035    0.4  30.1  -55.4   1.8761  29.8 ------	UNKNOWN
Post-slew image of 15-350 keV band
Time interval of the image:
70.228600 204.628600

# RAcent  DECcent POSerr Theta    Phi  PeakCts   SNR AngSep     Name
#  [deg]    [deg]    ['] [deg]  [deg]                   [']
198.7013  70.2246    2.7  16.4  131.4   0.8026   4.3 ------	UNKNOWN
 55.7722  38.8943    2.8  55.2   -4.9   2.2284   4.1 ------	UNKNOWN
 75.0777  29.1164    3.2  57.5  -27.2   4.5070   3.7 ------	UNKNOWN
 82.2382  30.3009    2.4  53.9  -33.5   4.9106   4.8 ------	UNKNOWN
Plot creation:
Thu Nov 10 21:17:55 EST 2022