Estimated redshift from machine learning (Ukwatta et al. 2016) - may take a few minute to calcaulte
Image
Pre-slew 15.0-350.0 keV image (Event data)
#   RAcent    DECcent   POSerr    Theta     Phi              Peak Cts       SNR   Name
  300.3106   -28.0556   0.0130    29.7794   112.8747         3.1830718     14.814 TRIG_01062336

Foreground time interval of the image:
 -0.780  25.496 (delta_t =  26.276 [sec])
Background time interval of the image:
-17.299  -0.780 (delta_t =  16.519 [sec])
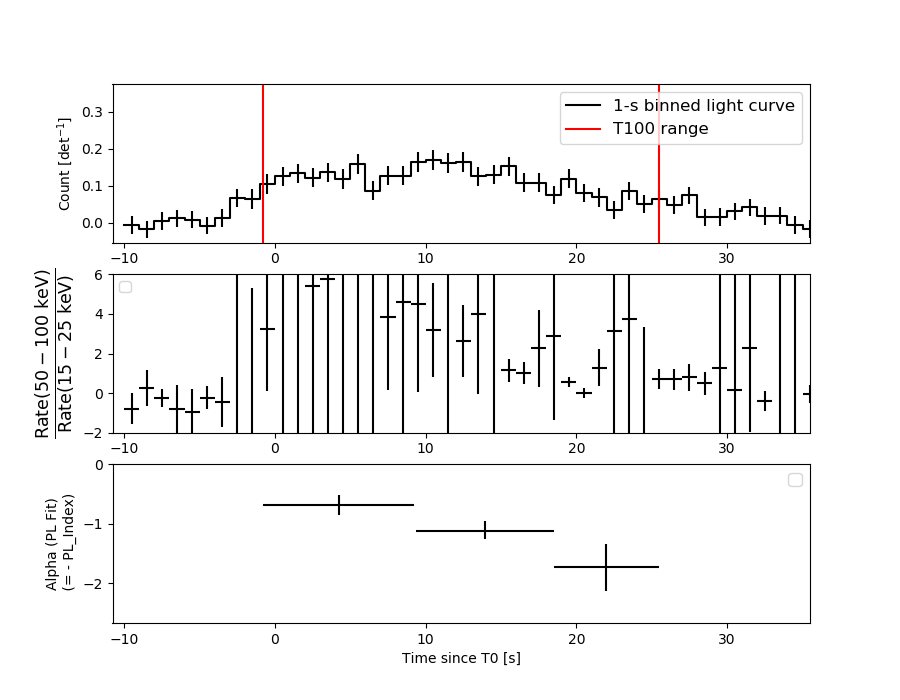
Lightcurves
Notes:
- 1) The mask-weighted light curves are using the flight position.
- 2) Multiple plots of different time binning/intervals are shown to cover all scenarios of short/long GRBs, rate/image triggers, and real/false positives.
- 3) For all the mask-weighted lightcurves, the y-axis units are counts/sec/det where a det is 0.4 x 0.4 = 0.16 sq cm.
- 4) The verticle lines correspond to following: green dotted lines are T50 interval, black dotted lines are T90 interval, blue solid line(s) is a spacecraft slew start time, and orange solid line(s) is a spacecraft slew end time.
- 5) Time of each bin is in the middle of the bin.
1 s binning
From T0-310 s to T0+310 s
From T100_start - 20 s to T100_end + 30 s
Full time interval

64 ms binning
Full time interval
From T100_start to T100_end
From T0-5 sec to T0+5 sec

16 ms binning
From T100_start-5 s to T100_start+5 s
Blue+Cyan dotted lines: Time interval of the scaled map
From 0.000000 to 88.000000
8 ms binning
From T100_start-3 s to T100_start+3 s

Blue+Cyan dotted lines: Time interval of the scaled map
From 0.000000 to 88.000000
2 ms binning
From T100_start-1 s to T100_start+1 s
Blue+Cyan dotted lines: Time interval of the scaled map
From 0.000000 to 88.000000
SN=5 or 10 sec. binning (whichever binning is satisfied first)
SN=5 or 10 sec. binning (T < 200 sec)
Quad-rate summed light curves (from T0-300s to T0+1000s)

Spectral Evolution
Spectra
Notes:
- 1) The fitting includes the systematic errors.
- 2) When the burst includes telescope slew time periods, the fitting uses an average response file made from multiple 5-s response files through out the slew time plus single time preiod for the non-slew times, and weighted by the total counts in the corresponding time period using addrmf. An average response file is needed becuase a spectral fit using the pre-slew DRM will introduce some errors in both a spectral shape and a normalization if the PHA file contains a lot of the slew/post-slew time interval.
- 3) For fits to more complicated models (e.g. a power-law over a cutoff power-law), the BAT team has decided to require a chi-square improvement of more than 6 for each extra dof.
Time averaged spectrum fit using the average DRM
Power-law model

Time interval is from   -0.780 sec. to   25.496 sec.

Spectral model in power-law:
------------------------------------------------------------
Parameters  : value       lower 90%   higher 90%
Photon index: 1.01115     ( -0.111184   0.108505 )
Norm@50keV  : 8.37368E-03    ( -0.000554792   0.000552079 )
------------------------------------------------------------
#Fit statistic  : Chi-Squared                   67.96     using 59 bins.
 Reduced chi-squared = 1.19228
# Null hypothesis probability of 1.52e-01 with 57 degrees of freedom

Photon flux (15-150 keV)    in 26.28 sec: 0.964643 ( -0.065708  0.066027 ) ph/cm2/s
Energy fluence (15-150 keV)             : 2.37053e-06 ( -1.54756e-07  1.55191e-07 ) ergs/cm2
Cutoff power-law model

Time interval is from   -0.780 sec. to   25.496 sec.
Spectral model in the cutoff power-law:
------------------------------------------------------------
Parameters  : value       lower 90%   higher 90%
Photon index: -0.248924     ( -0.635167   0.552825 )
Epeak [keV] : 106.543      ( -17.0036 36.585 )
Norm@50keV  : 2.82316E-02    ( -0.0113646   0.0220546 )
------------------------------------------------------------
#Fit statistic  : Chi-Squared                   50.28     using 59 bins.
 Reduced chi-squared = 0.897857
# Null hypothesis probability of 6.90e-01 with 56 degrees of freedom

Photon flux (15-150 keV)    in 26.28 sec: 0.905799 ( -0.069365  0.069868 ) ph/cm2/s
Energy fluence (15-150 keV)             : 2.24448e-06 ( -1.682e-07  1.67678e-07 ) ergs/cm2
Band function

Time interval is from   -0.780 sec. to   25.496 sec.


Spectral model in the Band function:
------------------------------------------------------------
Parameters  : value       lower 90%   higher 90%
alpha       :    (     )
beta        :     (     )
Epeak [keV] :       (   )
Norm@50keV   :     (     )
------------------------------------------------------------

Photon flux (15-150 keV)    in  sec:  (    ) ph/cm2/s
Energy fluence (15-150 keV)             : 0 ( 0  0 ) ergs/cm2
Single BB
Spectral model blackbody:
------------------------------------------------------------
Parameters  : value    Lower 90%  Upper 90%
kT [keV]    : 22.0674  (-1.61522  1.81585)
R^2/D10^2   : 3.48051E-02  (-0.00790159   0.00985823)
(R is the radius in km and D10 is the distance to the source in units of 10 kpc)
------------------------------------------------------------
#Fit statistic  : Chi-Squared                   58.40     using 59 bins.
 Reduced chi-squared =
# Null hypothesis probability of 4.24e-01 with 57 degrees of freedom

Energy  Fluence     90% Error
[keV]   [erg/cm2]   [erg/cm2]
15- 25  8.232e-08   1.043e-08
25- 50  4.361e-07   4.336e-08
50-150  1.587e-06   1.519e-07
15-150  2.105e-06   1.577e-07
Thermal bremsstrahlung (OTTB)
Spectral model: thermal bremsstrahlung
------------------------------------------------------------
Parameters  : value         Lower 90%    Upper 90%
kT [keV]    : 199.363       (      )
Norm        : 4.13892       (     )
------------------------------------------------------------
#Fit statistic  : Chi-Squared                  132.58     using 59 bins.
 Reduced chi-squared =
# Null hypothesis probability of 5.85e-08 with 57 degrees of freedom

Energy  Fluence     90% Error
[keV]   [erg/cm2]   [erg/cm2]
15- 25  2.708e-07   2.198e-08
25- 50  5.210e-07   4.362e-08
50-150  1.143e-06   2.570e-07
15-150  1.935e-06   2.989e-07
Double BB
Spectral model: bbodyrad<1> + bbodyrad<2>
------------------------------------------------------------
Parameters  : value         Lower 90%    Upper 90%
kT1 [keV]   : 11.0124        (-5.43573      -11.0959)
R1^2/D10^2  : 0.113028        (-0.067007      0.539273)
kT2 [keV]   : 28.7414        (-5.97268      -28.99)
R2^2/D10^2  : 1.20974E-02    (-0.0112976   0.0178865)
------------------------------------------------------------
#Fit statistic  : Chi-Squared                   50.11     using 59 bins.
 Reduced chi-squared =
# Null hypothesis probability of 6.62e-01 with 55 degrees of freedom

Energy  Fluence     90% Error
[keV]   [erg/cm2]   [erg/cm2]
15- 25  1.175e-07   6.478e-08
25- 50  4.686e-07   2.457e-07
50-150  1.660e-06   8.667e-07
15-150  2.246e-06   1.075e-06
Peak spectrum fit
Power-law model
Time interval is from   11.280 sec. to   12.280 sec.

Spectral model in power-law:
------------------------------------------------------------
Parameters  : value       lower 90%   higher 90%
Photon index: 1.01250     ( -0.353015   0.325192 )
Norm@50keV  : 1.39483E-02    ( -0.00290277   0.00286056 )
------------------------------------------------------------
#Fit statistic  : Chi-Squared                   51.79     using 59 bins.
 Reduced chi-squared = 0.908596
# Null hypothesis probability of 6.70e-01 with 57 degrees of freedom

Photon flux (15-150 keV)    in 1 sec: 1.60699 ( -0.33943  0.34336 ) ph/cm2/s
Energy fluence (15-150 keV)             : 1.50183e-07 ( -3.06824e-08  3.08051e-08 ) ergs/cm2
Cutoff power-law model
Time interval is from   11.280 sec. to   12.280 sec.
Spectral model in the cutoff power-law:
------------------------------------------------------------
Parameters  : value       lower 90%   higher 90%
Photon index: -4.93040E-02     ( -1.93904   1.20019 )
Epeak [keV] : 111.751      ( -40.6356 -111.751 )
Norm@50keV  : 4.07843E-02    ( -0.0407842   0.214433 )
------------------------------------------------------------
#Fit statistic  : Chi-Squared                   50.16     using 59 bins.
 Reduced chi-squared = 0.895714
# Null hypothesis probability of 6.94e-01 with 56 degrees of freedom

Photon flux (15-150 keV)    in 1 sec: 1.54424 ( -0.34605  0.35254 ) ph/cm2/s
Energy fluence (15-150 keV)             : 1.43777e-07 ( -3.26985e-08  3.24449e-08 ) ergs/cm2
Band function

Time interval is from   11.280 sec. to   12.280 sec.


Spectral model in the Band function:
------------------------------------------------------------
Parameters  : value       lower 90%   higher 90%
alpha       :    (     )
beta        :     (     )
Epeak [keV] :       (   )
Norm@50keV   :     (     )
------------------------------------------------------------

Photon flux (15-150 keV)    in  sec:  (    ) ph/cm2/s
Energy fluence (15-150 keV)             : 0 ( 0  0 ) ergs/cm2
Single BB

Spectral model blackbody:
------------------------------------------------------------
Parameters  : value    Lower 90%  Upper 90%
kT [keV]    : 21.6461  (-4.60745  6.79636)
R^2/D10^2   : 6.19688E-02  (-0.036396   0.0751475)
(R is the radius in km and D10 is the distance to the source in units of 10 kpc)
------------------------------------------------------------
#Fit statistic  : Chi-Squared                   51.74     using 59 bins.
 Reduced chi-squared =
# Null hypothesis probability of 6.72e-01 with 57 degrees of freedom

Energy  Fluence     90% Error
[keV]   [erg/cm2]   [erg/cm2]
15- 25  5.413e-09   2.194e-09
25- 50  2.835e-08   1.083e-08
50-150  9.918e-08   4.122e-08
15-150  1.330e-07   4.736e-08
Thermal bremsstrahlung (OTTB)
Spectral model: thermal bremsstrahlung
------------------------------------------------------------
Parameters  : value         Lower 90%    Upper 90%
kT [keV]    : 200.000       (-54.5095      -200)
Norm        : 6.83496       (-1.42039     1.42039)
------------------------------------------------------------
#Fit statistic  : Chi-Squared                   58.68     using 59 bins.
 Reduced chi-squared =
# Null hypothesis probability of 4.14e-01 with 57 degrees of freedom

Energy  Fluence     90% Error
[keV]   [erg/cm2]   [erg/cm2]
15- 25  1.703e-08   9.950e-09
25- 50  3.277e-08   1.913e-08
50-150  7.186e-08   4.192e-08
15-150  1.217e-07   7.190e-08
Double BB

Spectral model: bbodyrad<1> + bbodyrad<2>
------------------------------------------------------------
Parameters  : value         Lower 90%    Upper 90%
kT1 [keV]   : 11.0077        (-11.1644      -11.1644)
R1^2/D10^2  : 0.261139        (-0.261363      -0.261363)
kT2 [keV]   : 33.0638        (-33.5962      -33.5962)
R2^2/D10^2  : 1.22751E-02    (-0.011849   0.0789782)
------------------------------------------------------------
#Fit statistic  : Chi-Squared                   49.65     using 59 bins.
 Reduced chi-squared =
# Null hypothesis probability of 6.79e-01 with 55 degrees of freedom

Energy  Fluence     90% Error
[keV]   [erg/cm2]   [erg/cm2]
15- 25  8.586e-09   5.680e-09
25- 50  3.136e-08   1.876e-08
50-150  1.062e-07   5.945e-08
15-150  1.462e-07   7.385e-08
Pre-slew spectrum (Pre-slew PHA with pre-slew DRM)
Power-law model
Spectral model in power-law:
------------------------------------------------------------
Parameters  : value       lower 90%   higher 90%
Photon index: 1.01115     ( -0.111184   0.108505 )
Norm@50keV  : 8.37368E-03    ( -0.000554792   0.000552079 )
------------------------------------------------------------
#Fit statistic  : Chi-Squared                   67.96     using 59 bins.
 Reduced chi-squared =
# Null hypothesis probability of 1.52e-01 with 57 degrees of freedom

Photon flux (15-150 keV)    in 26.28 sec: 0.964474 ( -0.0655293  0.0661934 ) ph/cm2/s
Energy fluence (15-150 keV)             : 2.37025e-06 ( -1.54758e-07  1.55127e-07 ) ergs/cm2
Cutoff power-law model
Spectral model in the cutoff power-law:
------------------------------------------------------------
Parameters  : value       lower 90%   higher 90%
Photon index: -0.248925     ( -0.635166   0.552825 )
Epeak [keV] : 106.543      ( -17.0035 36.585 )
Norm@50keV  : 2.82316E-02    ( -0.0113646   0.0220546 )
------------------------------------------------------------
#Fit statistic  : Chi-Squared                   50.28     using 59 bins.
 Reduced chi-squared =
# Null hypothesis probability of 6.90e-01 with 56 degrees of freedom

Photon flux (15-150 keV)    in 26.28 sec: 0.905794 ( -0.069359  0.069856 ) ph/cm2/s
Energy fluence (15-150 keV)             : 2.24554e-06 ( -1.68612e-07  1.67795e-07 ) ergs/cm2
Band function
Spectral model in the Band function:
------------------------------------------------------------
Parameters  : value       lower 90%   higher 90%
alpha       :    (     )
beta        :     (     )
Epeak [keV] :       (   )
Norm@50keV   :     (     )
------------------------------------------------------------

Photon flux (15-150 keV)    in  sec:  (    ) ph/cm2/s
Energy fluence (15-150 keV)             : 0 ( 0  0 ) ergs/cm2
S(25-50 keV) vs. S(50-100 keV) plot
S(25-50 keV)  = 4.42e-07
S(50-100 keV) = 8.78e-07
T90 vs. Hardness ratio plot
T90                                   = 22.5119999647141 sec.
Hardness ratio (energy fluence ratio) = 1.98643
Color vs. Color plot
Count Ratio  (25-50 keV) / (15-25 keV) = 2.74437
Count Ratio (50-100 keV) / (15-25 keV) = 3.17634
Mask shadow pattern
IMX = -2.224347900185051E-01, IMY = -5.272262623408568E-01
TIME vs. PHA plot around the trigger time
Blue+Cyan dotted lines: Time interval of the scaled map
From 0.000000 to 88.000000
TIME vs. DetID plot around the trigger time

Blue+Cyan dotted lines: Time interval of the scaled map
From 0.000000 to 88.000000
100 us light curve (15-350 keV)
Blue+Cyan dotted lines: Time interval of the scaled map
From 0.000000 to 88.000000
Spacecraft aspect plot
Bright source in the pre-burst/pre-slew/post-slew images
Pre-burst image of 15-350 keV band
Time interval of the image:
-17.299400 -0.780000

# RAcent  DECcent POSerr Theta    Phi  PeakCts   SNR AngSep     Name
#  [deg]    [deg]    ['] [deg]  [deg]                   [']
245.0286 -15.6260    0.8  23.8  -44.2   1.0822  14.9    3.0	Sco X-1
256.1980 -37.9638    2.9  12.4 -123.1   0.2415   3.9   12.3	4U 1700-377
256.5922 -36.4602    3.5  11.1 -118.6   0.2022   3.3    7.9	GX 349+2
262.8915 -24.9287    0.0   5.1  -22.2   0.0260   0.4   12.7	GX 1+4
264.5729 -44.3273   34.9  15.4 -158.9   0.0192   0.3   10.4	4U 1735-44
268.5482  -1.5584    0.0  27.5   21.0   0.1343   1.8   12.5	SW J1753.5-0127
270.1102 -25.0792   67.6   5.1   57.7  -0.0105  -0.2    9.5	GX 5-1
270.3510 -25.7624  129.1   4.8   65.0   0.0055   0.1    2.9	GRS 1758-258
274.0392 -14.1724 2517.1  16.4   43.5  -0.0002  -0.0    8.4	GX 17+2
276.0254 -30.1737    0.0   8.5  116.9  -0.0819  -1.3   12.7	H1820-303
285.2513 -24.9871    0.0  17.3   97.4   0.0341   0.5   12.4	HT1900.1-2455
288.7814  10.8381    4.4  45.3   48.1  -0.6560  -2.6    6.5	GRS 1915+105
262.8717 -33.7053   35.2   5.6 -132.4   0.0205   0.3    9.7	GX 354-0
282.7521  14.0163    2.0  45.8   38.7   1.0354   5.7 ------	UNKNOWN
303.0898 -81.5334    2.4  54.4 -169.9   0.9141   4.9 ------	UNKNOWN
221.7301 -13.7908    2.5  43.9  -63.3   1.1653   4.7 ------	UNKNOWN
Pre-slew background subtracted image of 15-350 keV band
Time interval of the image:
-0.780000 25.496000

# RAcent  DECcent POSerr Theta    Phi  PeakCts   SNR AngSep     Name
#  [deg]    [deg]    ['] [deg]  [deg]                   [']
244.9531 -15.7143    3.3  23.7  -44.4   0.4856   3.5    4.7	Sco X-1
255.8419 -37.7903    4.3  12.4 -121.8   0.3244   2.7    7.6	4U 1700-377
256.6526 -36.5411    7.8  11.1 -119.3  -0.1776  -1.5   12.6	GX 349+2
262.8467 -24.7727    9.6   5.2  -21.0   0.1417   1.2    9.0	GX 1+4
264.6303 -44.4378    4.3  15.5 -159.2  -0.3073  -2.7    4.9	4U 1735-44
268.5296  -1.5633    6.8  27.5   21.1  -0.2685  -1.7   11.7	SW J1753.5-0127
270.4717 -25.1159    4.5   5.3   61.1  -0.3133  -2.6   10.4	GX 5-1
270.3832 -25.8767    6.2   4.7   66.7  -0.2258  -1.9    9.1	GRS 1758-258
274.0163 -14.1493    6.3  16.4   43.6   0.2468   1.8    6.8	GX 17+2
276.0253 -30.1736    0.0   8.5  116.8   0.2167   1.7   12.7	H1820-303
285.2513 -24.9871    0.0  17.3   97.5  -0.1137  -0.8   12.4	HT1900.1-2455
288.8651  10.9641    6.4  45.5   48.1   0.9684   1.8    4.1	GRS 1915+105
263.1323 -33.9504    2.7   5.7 -136.0  -0.5296  -4.3   10.0	GX 354-0
300.3106 -28.0556    0.8  29.8  112.9   3.1835  14.8 ------	UNKNOWN
270.0104 -44.9047    2.4  16.2 -173.1   0.5764   4.9 ------	UNKNOWN
Post-slew image of 15-350 keV band
Time interval of the image:
190.100590 423.300000

# RAcent  DECcent POSerr Theta    Phi  PeakCts   SNR AngSep     Name
#  [deg]    [deg]    ['] [deg]  [deg]                   [']
256.0712 -37.8643    7.6  38.0  -74.1 -18.9916  -1.5    4.2	4U 1700-377
256.4764 -36.5416    9.6  37.6  -72.0  15.6055   1.2    7.4	GX 349+2
262.8538 -24.7698    5.2  33.5  -50.7 -16.4750  -2.2    8.6	GX 1+4
264.9267 -44.3728    6.8  32.5  -87.2  18.4896   1.7    9.1	4U 1735-44
268.3775  -1.4184    7.0  40.5  -12.0  12.4708   1.7    2.1	SW J1753.5-0127
270.0821 -25.0273    0.0  27.1  -48.2  13.9579   2.1   11.4	GX 5-1
270.4467 -25.6822   14.2  26.6  -49.4   5.4618   0.8    8.6	GRS 1758-258
273.9330 -14.1844    5.6  28.1  -23.4 -13.4551  -2.1    9.8	GX 17+2
275.8308 -30.3581   15.2  21.4  -59.6   5.0378   0.8    4.9	H1820-303
285.1689 -25.0159   16.2  13.8  -38.3  -3.4103  -0.7    9.2	HT1900.1-2455
288.7912  11.1170    0.0  40.7   25.0  -0.2884  -0.0   10.3	GRS 1915+105
262.8609 -33.7420    5.1  32.4  -67.1 -20.2052  -2.3    8.5	GX 354-0
300.8581  14.1389    3.4  42.2   43.3  36.1607   3.4 ------	UNKNOWN
327.7990 -24.4993    2.6  24.9  130.6  24.8964   4.4 ------	UNKNOWN
267.2446  13.0680    2.8  52.1    0.2  48.0326   4.1 ------	UNKNOWN
262.7807  10.6194    2.7  53.0   -6.0  55.5230   4.3 ------	UNKNOWN
259.7651 -52.2321    3.1  38.5  -97.8  65.9333   3.7 ------	UNKNOWN
Plot creation:
Sat Jul 30 06:52:00 EDT 2022