Estimated redshift from machine learning (Ukwatta et al. 2016) - may take a few minute to calcaulte
Image
Pre-slew 15.0-350.0 keV image (Event data)
#   RAcent    DECcent   POSerr    Theta     Phi              Peak Cts       SNR   Name
   76.7173    58.2596   0.0255    49.3168     3.8274        17.0093023      7.513 TRIG_01064221

Foreground time interval of the image:
 -9.448 121.301 (delta_t = 130.749 [sec])
Background time interval of the image:
-11.099  -9.448 (delta_t =   1.651 [sec])
Lightcurves
Notes:
- 1) The mask-weighted light curves are using the flight position.
- 2) Multiple plots of different time binning/intervals are shown to cover all scenarios of short/long GRBs, rate/image triggers, and real/false positives.
- 3) For all the mask-weighted lightcurves, the y-axis units are counts/sec/det where a det is 0.4 x 0.4 = 0.16 sq cm.
- 4) The verticle lines correspond to following: green dotted lines are T50 interval, black dotted lines are T90 interval, blue solid line(s) is a spacecraft slew start time, and orange solid line(s) is a spacecraft slew end time.
- 5) Time of each bin is in the middle of the bin.
1 s binning
From T0-310 s to T0+310 s

From T100_start - 20 s to T100_end + 30 s
Full time interval
64 ms binning
Full time interval
From T100_start to T100_end
From T0-5 sec to T0+5 sec
16 ms binning
From T100_start-5 s to T100_start+5 s
8 ms binning
From T100_start-3 s to T100_start+3 s
2 ms binning
From T100_start-1 s to T100_start+1 s
SN=5 or 10 sec. binning (whichever binning is satisfied first)

SN=5 or 10 sec. binning (T < 200 sec)
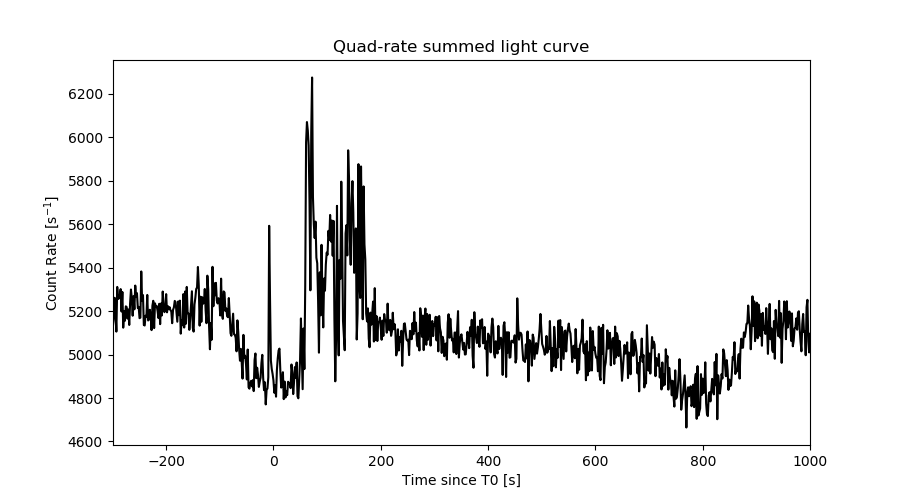
Quad-rate summed light curves (from T0-300s to T0+1000s)
Spectral Evolution

Spectra
Notes:
- 1) The fitting includes the systematic errors.
- 2) When the burst includes telescope slew time periods, the fitting uses an average response file made from multiple 5-s response files through out the slew time plus single time preiod for the non-slew times, and weighted by the total counts in the corresponding time period using addrmf. An average response file is needed becuase a spectral fit using the pre-slew DRM will introduce some errors in both a spectral shape and a normalization if the PHA file contains a lot of the slew/post-slew time interval.
- 3) For fits to more complicated models (e.g. a power-law over a cutoff power-law), the BAT team has decided to require a chi-square improvement of more than 6 for each extra dof.
Time averaged spectrum fit using the average DRM
Power-law model

Time interval is from   -9.448 sec. to  170.968 sec.

Spectral model in power-law:
------------------------------------------------------------
Parameters  : value       lower 90%   higher 90%
Photon index: 1.13343     ( -0.0773062   0.0762066 )
Norm@50keV  : 4.62820E-03    ( -0.000203613   0.000202747 )
------------------------------------------------------------
#Fit statistic  : Chi-Squared                   53.42     using 59 bins.
 Reduced chi-squared = 0.937193
# Null hypothesis probability of 6.10e-01 with 57 degrees of freedom

Photon flux (15-150 keV)    in 180.4 sec: 0.538714 ( -0.025409  0.025509 ) ph/cm2/s
Energy fluence (15-150 keV)             : 8.63946e-06 ( -3.70206e-07  3.70365e-07 ) ergs/cm2
Cutoff power-law model
Time interval is from   -9.448 sec. to  170.968 sec.
Spectral model in the cutoff power-law:
------------------------------------------------------------
Parameters  : value       lower 90%   higher 90%
Photon index: 1.03274     ( -0.316164   0.133686 )
Epeak [keV] : 585.119      ( -586.314 -586.314 )
Norm@50keV  : 5.10088E-03    ( -0.000605712   0.00175694 )
------------------------------------------------------------
#Fit statistic  : Chi-Squared                   53.10     using 59 bins.
 Reduced chi-squared = 0.948214
# Null hypothesis probability of 5.86e-01 with 56 degrees of freedom

Photon flux (15-150 keV)    in 180.4 sec: 0.535756 ( -0.026789  0.026824 ) ph/cm2/s
Energy fluence (15-150 keV)             : 8.61284e-06 ( -3.79866e-07  3.75441e-07 ) ergs/cm2
Band function

Time interval is from   -9.448 sec. to  170.968 sec.


Spectral model in the Band function:
------------------------------------------------------------
Parameters  : value       lower 90%   higher 90%
alpha       :    (     )
beta        :     (     )
Epeak [keV] :       (   )
Norm@50keV   :     (     )
------------------------------------------------------------

Photon flux (15-150 keV)    in  sec:  (    ) ph/cm2/s
Energy fluence (15-150 keV)             : 0 ( 0  0 ) ergs/cm2
Single BB
Spectral model blackbody:
------------------------------------------------------------
Parameters  : value    Lower 90%  Upper 90%
kT [keV]    : 22.2838  (  )
R^2/D10^2   : 1.76301E-02  (   )
(R is the radius in km and D10 is the distance to the source in units of 10 kpc)
------------------------------------------------------------
#Fit statistic  : Chi-Squared                  152.41     using 59 bins.
 Reduced chi-squared =
# Null hypothesis probability of 1.23e-10 with 57 degrees of freedom

Energy  Fluence     90% Error
[keV]   [erg/cm2]   [erg/cm2]
15- 25  2.906e-07   2.661e-08
25- 50  1.548e-06   1.000e-07
50-150  5.744e-06   3.301e-07
15-150  7.583e-06   3.464e-07
Thermal bremsstrahlung (OTTB)

Spectral model: thermal bremsstrahlung
------------------------------------------------------------
Parameters  : value         Lower 90%    Upper 90%
kT [keV]    : 199.363       (      )
Norm        : 2.35452       (     )
------------------------------------------------------------
#Fit statistic  : Chi-Squared                  150.85     using 59 bins.
 Reduced chi-squared =
# Null hypothesis probability of 2.04e-10 with 57 degrees of freedom

Energy  Fluence     90% Error
[keV]   [erg/cm2]   [erg/cm2]
15- 25  1.058e-06   5.123e-08
25- 50  2.035e-06   9.020e-08
50-150  4.462e-06   2.300e-07
15-150  7.554e-06   3.617e-07
Double BB

Spectral model: bbodyrad<1> + bbodyrad<2>
------------------------------------------------------------
Parameters  : value         Lower 90%    Upper 90%
kT1 [keV]   : 10.3276        (-1.94473      2.10261)
R1^2/D10^2  : 0.130279        (-0.0516424      0.109581)
kT2 [keV]   : 42.5129        (-8.9301      21.0546)
R2^2/D10^2  : 1.87776E-03    (-0.00125407   0.00211693)
------------------------------------------------------------
#Fit statistic  : Chi-Squared                   57.72     using 59 bins.
 Reduced chi-squared =
# Null hypothesis probability of 3.75e-01 with 55 degrees of freedom

Energy  Fluence     90% Error
[keV]   [erg/cm2]   [erg/cm2]
15- 25  5.913e-07   1.070e-07
25- 50  1.866e-06   2.742e-07
50-150  6.160e-06   1.603e-06
15-150  8.617e-06   1.991e-06
Peak spectrum fit
Power-law model

Time interval is from   70.524 sec. to   71.524 sec.

Spectral model in power-law:
------------------------------------------------------------
Parameters  : value       lower 90%   higher 90%
Photon index: 0.763834     ( -0.360923   0.317443 )
Norm@50keV  : 1.58297E-02    ( -0.00343821   0.00325134 )
------------------------------------------------------------
#Fit statistic  : Chi-Squared                   53.22     using 59 bins.
 Reduced chi-squared = 0.933684
# Null hypothesis probability of 6.18e-01 with 57 degrees of freedom

Photon flux (15-150 keV)    in 1 sec: 1.82217 ( -0.36144  0.36844 ) ph/cm2/s
Energy fluence (15-150 keV)             : 1.87875e-07 ( -3.19197e-08  3.19059e-08 ) ergs/cm2
Cutoff power-law model

Time interval is from   70.524 sec. to   71.524 sec.
Spectral model in the cutoff power-law:
------------------------------------------------------------
Parameters  : value       lower 90%   higher 90%
Photon index: 0.755175     ( -1.14402   0.65528 )
Epeak [keV] : 10000.00      ( -10000 -10000 )
Norm@50keV  : 1.59436E-02    ( -0.00345108   -0.0159436 )
------------------------------------------------------------
#Fit statistic  : Chi-Squared                   53.22     using 59 bins.
 Reduced chi-squared = 0.950357
# Null hypothesis probability of 5.81e-01 with 56 degrees of freedom

Photon flux (15-150 keV)    in 1 sec: 1.80599 ( -0.38496  0.36071 ) ph/cm2/s
Energy fluence (15-150 keV)             : 1.87655e-07 ( -3.20907e-08  3.19893e-08 ) ergs/cm2
Band function

Time interval is from   70.524 sec. to   71.524 sec.


Spectral model in the Band function:
------------------------------------------------------------
Parameters  : value       lower 90%   higher 90%
alpha       :    (     )
beta        :     (     )
Epeak [keV] :       (   )
Norm@50keV   :     (     )
------------------------------------------------------------

Photon flux (15-150 keV)    in  sec:  (    ) ph/cm2/s
Energy fluence (15-150 keV)             : 0 ( 0  0 ) ergs/cm2
Single BB
Spectral model blackbody:
------------------------------------------------------------
Parameters  : value    Lower 90%  Upper 90%
kT [keV]    : 30.3868  (-6.29321  10.4985)
R^2/D10^2   : 2.63248E-02  (-0.0151447   0.0277771)
(R is the radius in km and D10 is the distance to the source in units of 10 kpc)
------------------------------------------------------------
#Fit statistic  : Chi-Squared                   55.73     using 59 bins.
 Reduced chi-squared =
# Null hypothesis probability of 5.23e-01 with 57 degrees of freedom

Energy  Fluence     90% Error
[keV]   [erg/cm2]   [erg/cm2]
15- 25  3.773e-09   1.647e-09
25- 50  2.339e-08   8.876e-09
50-150  1.518e-07   5.151e-08
15-150  1.790e-07   6.304e-08
Thermal bremsstrahlung (OTTB)
Spectral model: thermal bremsstrahlung
------------------------------------------------------------
Parameters  : value         Lower 90%    Upper 90%
kT [keV]    : 200.000       (-35.4829      -200)
Norm        : 8.07175       (-1.52361     1.52361)
------------------------------------------------------------
#Fit statistic  : Chi-Squared                   71.91     using 59 bins.
 Reduced chi-squared =
# Null hypothesis probability of 8.82e-02 with 57 degrees of freedom

Energy  Fluence     90% Error
[keV]   [erg/cm2]   [erg/cm2]
15- 25  2.012e-08   1.196e-08
25- 50  3.871e-08   2.264e-08
50-150  8.490e-08   4.929e-08
15-150  1.437e-07   8.255e-08
Double BB
Spectral model: bbodyrad<1> + bbodyrad<2>
------------------------------------------------------------
Parameters  : value         Lower 90%    Upper 90%
kT1 [keV]   : 4.96827        (-2.78947      9.16388)
R1^2/D10^2  : 4.23607        (-4.1213      271.086)
kT2 [keV]   : 35.0379        (-8.6336      20.3241)
R2^2/D10^2  : 1.66430E-02    (-0.0119433   0.0200848)
------------------------------------------------------------
#Fit statistic  : Chi-Squared                   51.66     using 59 bins.
 Reduced chi-squared =
# Null hypothesis probability of 6.03e-01 with 55 degrees of freedom

Energy  Fluence     90% Error
[keV]   [erg/cm2]   [erg/cm2]
15- 25  1.293e-08   8.121e-09
25- 50  2.536e-08   1.292e-08
50-150  1.521e-07   8.413e-08
15-150  1.904e-07   9.287e-08
Pre-slew spectrum (Pre-slew PHA with pre-slew DRM)
Power-law model

Spectral model in power-law:
------------------------------------------------------------
Parameters  : value       lower 90%   higher 90%
Photon index: 1.09191     ( -0.10486   0.102528 )
Norm@50keV  : 4.17556E-03    ( -0.000253945   0.000252041 )
------------------------------------------------------------
#Fit statistic  : Chi-Squared                   49.67     using 59 bins.
 Reduced chi-squared =
# Null hypothesis probability of 7.44e-01 with 57 degrees of freedom

Photon flux (15-150 keV)    in 130.7 sec: 0.483963 ( -0.0311991  0.0313788 ) ph/cm2/s
Energy fluence (15-150 keV)             : 5.72073e-06 ( -3.29978e-07  3.30133e-07 ) ergs/cm2
Cutoff power-law model

Spectral model in the cutoff power-law:
------------------------------------------------------------
Parameters  : value       lower 90%   higher 90%
Photon index: 0.949192     ( -0.437754   0.188506 )
Epeak [keV] : 456.104      ( -456.113 -456.113 )
Norm@50keV  : 4.78175E-03    ( -0.000774506   0.00235705 )
------------------------------------------------------------
#Fit statistic  : Chi-Squared                   49.32     using 59 bins.
 Reduced chi-squared =
# Null hypothesis probability of 7.24e-01 with 56 degrees of freedom

Photon flux (15-150 keV)    in 130.7 sec: 0.480326 ( -0.032712  0.032623 ) ph/cm2/s
Energy fluence (15-150 keV)             : 5.70355e-06 ( -3.3701e-07  3.35781e-07 ) ergs/cm2
Band function
Spectral model in the Band function:
------------------------------------------------------------
Parameters  : value       lower 90%   higher 90%
alpha       :    (     )
beta        :     (     )
Epeak [keV] :       (   )
Norm@50keV   :     (     )
------------------------------------------------------------

Photon flux (15-150 keV)    in  sec:  (    ) ph/cm2/s
Energy fluence (15-150 keV)             : 0 ( 0  0 ) ergs/cm2
S(25-50 keV) vs. S(50-100 keV) plot
S(25-50 keV)  = 1.74e-06
S(50-100 keV) = 3.18e-06
T90 vs. Hardness ratio plot
T90                                   = 143.664000034332 sec.
Hardness ratio (energy fluence ratio) = 1.82759
Color vs. Color plot
Count Ratio  (25-50 keV) / (15-25 keV) = 1.82376
Count Ratio (50-100 keV) / (15-25 keV) = 1.89909
Mask shadow pattern
IMX = 1.160703420316407E+00, IMY = -7.765187250656860E-02
TIME vs. PHA plot around the trigger time

TIME vs. DetID plot around the trigger time

100 us light curve (15-350 keV)
Spacecraft aspect plot
Bright source in the pre-burst/pre-slew/post-slew images
Pre-burst image of 15-350 keV band
Time interval of the image:
-11.099410 -9.448000

# RAcent  DECcent POSerr Theta    Phi  PeakCts   SNR AngSep     Name
#  [deg]    [deg]    ['] [deg]  [deg]                   [']
239.6778  68.7333    2.0  29.4   87.5   0.1202   5.7 ------	UNKNOWN
119.8248  30.0539    2.8  47.9  -51.2   0.2726   4.2 ------	UNKNOWN
148.4250  21.7630    2.6  40.9  -88.9   0.2246   4.4 ------	UNKNOWN
Pre-slew background subtracted image of 15-350 keV band
Time interval of the image:
-9.448000 121.300600

# RAcent  DECcent POSerr Theta    Phi  PeakCts   SNR AngSep     Name
#  [deg]    [deg]    ['] [deg]  [deg]                   [']
177.6206  69.8889    2.4  13.5   46.2   5.1837   4.8 ------	UNKNOWN
 76.7173  58.2596    1.5  49.3    3.8  17.0140   7.5 ------	UNKNOWN
 84.1320  42.3141    3.1  57.8  -14.0  17.3356   3.7 ------	UNKNOWN
Post-slew image of 15-350 keV band
Time interval of the image:
190.700600 697.400620

# RAcent  DECcent POSerr Theta    Phi  PeakCts   SNR AngSep     Name
#  [deg]    [deg]    ['] [deg]  [deg]                   [']
 83.6323  22.0170    0.4  36.5  -27.2  20.5930  32.8    0.2	Crab
 44.1117  48.7028    2.6  21.3   61.4   2.2407   4.5 ------	UNKNOWN
218.9646  76.6809    3.8  43.0  175.5   2.6408   3.1 ------	UNKNOWN
 62.1238   9.8364    3.0  49.6    2.6   3.5704   3.8 ------	UNKNOWN
 76.5556  58.2646    2.0   0.1  106.1   2.4386   5.7 ------	UNKNOWN
Plot creation:
Sat Jul 30 06:51:25 EDT 2022