Click here for the BAT GCN circular template
Image
Pre-slew 15.0-350.0 keV image (Event data)
#   RAcent    DECcent   POSerr    Theta     Phi              Peak Cts       SNR   Name
   81.2999   -57.7587   0.0062    54.1344   -32.6376        24.0197680     30.785 TRIG_00106442

Foreground time interval of the image:
-35.592  38.568 (delta_t =  74.160 [sec])
Background time interval of the image:
-299.656 -35.592 (delta_t = 264.064 [sec])
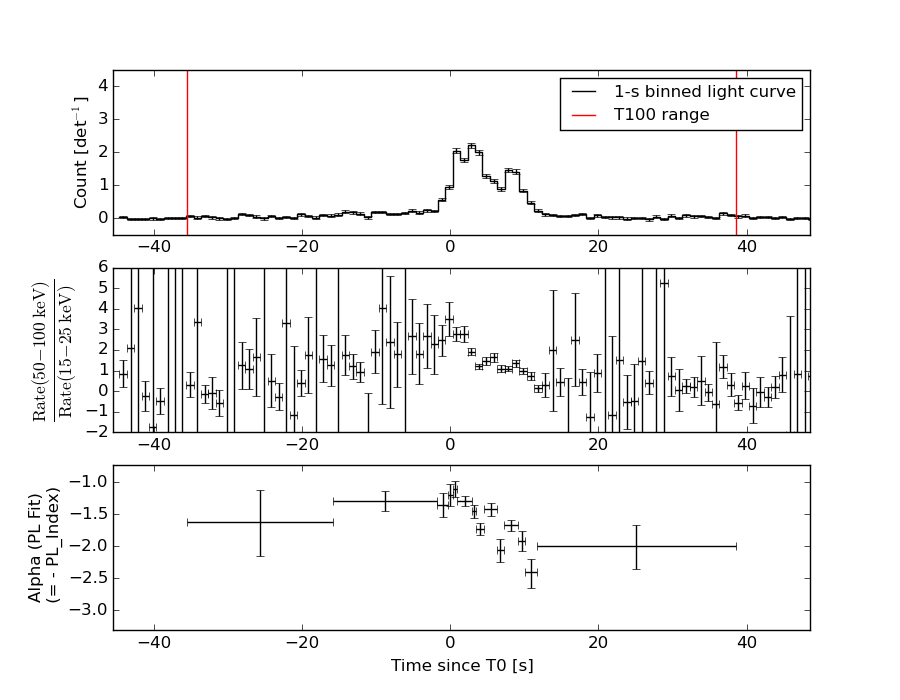
Lightcurves
Notes:
- 1) The mask-weighted light curves are using the flight position.
- 2) Multiple plots of different time binning/intervals are shown to cover all scenarios of short/long GRBs, rate/image triggers, and real/false positives.
- 3) For all the mask-weighted lightcurves, the y-axis units are counts/sec/det where a det is 0.4 x 0.4 = 0.16 sq cm.
- 4) The verticle lines correspond to following: green dotted lines are T50 interval, black dotted lines are T90 interval, blue solid line(s) is a spacecraft slew start time, and orange solid line(s) is a spacecraft slew end time.
- 5) Time of each bin is in the middle of the bin.
1 s binning
From T0-310 s to T0+310 s

From T100_start - 20 s to T100_end + 30 s

Full time interval
64 ms binning
Full time interval
From T100_start to T100_end

From T0-5 sec to T0+5 sec
16 ms binning
From T100_start-5 s to T100_start+5 s
8 ms binning
From T100_start-3 s to T100_start+3 s
2 ms binning
From T100_start-1 s to T100_start+1 s
SN=5 or 10 sec. binning (whichever binning is satisfied first)
SN=5 or 10 sec. binning (T < 200 sec)

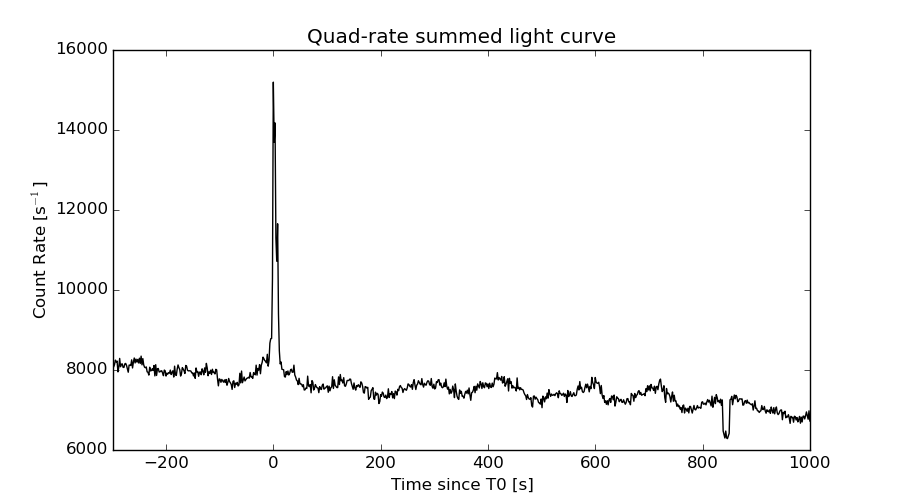
Quad-rate summed light curves (from T0-300s to T0+1000s)
Spectral Evolution
Spectra
Notes:
- 1) The fitting includes the systematic errors.
- 2) When the burst includes telescope slew time periods, the fitting uses an average response file made from multiple 5-s response files through out the slew time plus single time preiod for the non-slew times, and weighted by the total counts in the corresponding time period using addrmf. An average response file is needed becuase a spectral fit using the pre-slew DRM will introduce some errors in both a spectral shape and a normalization if the PHA file contains a lot of the slew/post-slew time interval.
- 3) For fits to more complicated models (e.g. a power-law over a cutoff power-law), the BAT team has decided to require a chi-square improvement of more than 6 for each extra dof.
Time averaged spectrum fit using the average DRM
Power-law model

Time interval is from  -35.592 sec. to   38.568 sec.

Spectral model in power-law:
------------------------------------------------------------
Parameters  : value       lower 90%   higher 90%
Photon index: 1.50801     ( -0.0503775   0.0502839 )
Norm@50keV  : 2.29779E-02    ( -0.000676177   0.000675882 )
------------------------------------------------------------
#Fit statistic : Chi-Squared =          79.41 using 59 PHA bins.
# Reduced chi-squared =          1.393 for     57 degrees of freedom
# Null hypothesis probability =   2.656274e-02

Photon flux (15-150 keV)    in 74.16 sec: 2.87476 ( -0.0974636  0.0978459 ) ph/cm2/s
Energy fluence (15-150 keV)             : 1.61444e-05 ( -4.7643e-07  4.76504e-07 ) ergs/cm2
Cutoff power-law model

Time interval is from  -35.592 sec. to   38.568 sec.
Spectral model in the cutoff power-law:
------------------------------------------------------------
Parameters  : value       lower 90%   higher 90%
Photon index: 0.918028     ( -0.23574   0.224445 )
Epeak [keV] : 107.860      ( -15.0945 30.2332 )
Norm@50keV  : 4.14124E-02    ( -0.00812377   0.0106249 )
------------------------------------------------------------
#Fit statistic : Chi-Squared =          57.87 using 59 PHA bins.
# Reduced chi-squared =          1.033 for     56 degrees of freedom
# Null hypothesis probability =   4.059729e-01

Photon flux (15-150 keV)    in 74.16 sec: 2.76347 ( -0.10394  0.1046 ) ph/cm2/s
Energy fluence (15-150 keV)             : 1.58455e-05 ( -4.95982e-07  4.9487e-07 ) ergs/cm2
Band function
Time interval is from  -35.592 sec. to   38.568 sec.

Spectral model in the Band function:
------------------------------------------------------------
Parameters  : value       lower 90%   higher 90%
alpha       : -0.843028   ( -0.262697   0.327029 )
beta        : -1.97831    ( 1.98122   0.237037 )
Epeak [keV] : 99.0092      ( -20.4858 31.6886 )
Norm@50keV   : 4.52770E-02    ( -0.0107516   0.0204404 )
------------------------------------------------------------
#Fit statistic : Chi-Squared =          57.01 using 59 PHA bins.
# Reduced chi-squared =          1.037 for     55 degrees of freedom
# Null hypothesis probability =   4.001728e-01

Photon flux (15-150 keV)    in 74.16 sec: 2.75006 ( 4.24994  -0.10582 ) ph/cm2/s
Energy fluence (15-150 keV)             : 0 ( 0  0 ) ergs/cm2
Single BB

Spectral model blackbody:
------------------------------------------------------------
Parameters  : value    Lower 90%  Upper 90%
kT [keV]    : 18.0673  (  )
R^2/D10^2   : 0.171014  (   )
(R is the radius in km and D10 is the distance to the source in units of 10 kpc)
------------------------------------------------------------
#Fit statistic : Chi-Squared =         235.74 using 59 PHA bins.
# Reduced chi-squared =         4.1358 for     57 degrees of freedom
# Null hypothesis probability =   1.343175e-23

Energy  Fluence     90% Error
[keV]   [erg/cm2]   [erg/cm2]
15- 25  8.279e-07   5.154e-08
25- 50  3.839e-06   1.576e-07
50-150  9.106e-06   3.856e-07
15-150  1.377e-05   3.968e-07
Thermal bremsstrahlung (OTTB)

Spectral model: thermal bremsstrahlung
------------------------------------------------------------
Parameters  : value         Lower 90%    Upper 90%
kT [keV]    : 200.000       (      )
Norm        : 11.9627       (-0.348787     0.348777)
------------------------------------------------------------
#Fit statistic : Chi-Squared =          72.14 using 59 PHA bins.
# Reduced chi-squared =          1.266 for     57 degrees of freedom
# Null hypothesis probability =   8.534863e-02

Energy  Fluence     90% Error
[keV]   [erg/cm2]   [erg/cm2]
15- 25  2.210e-06   7.156e-08
25- 50  4.251e-06   1.431e-07
50-150  9.323e-06   3.263e-07
15-150  1.578e-05   5.006e-07
Double BB

Spectral model: bbodyrad<1> + bbodyrad<2>
------------------------------------------------------------
Parameters  : value         Lower 90%    Upper 90%
kT1 [keV]   : 7.53829        (-1.1789      1.39275)
R1^2/D10^2  : 1.90296        (-0.783163      1.54674)
kT2 [keV]   : 25.3720        (-2.22333      3.29108)
R2^2/D10^2  : 4.18506E-02    (-0.0162533   0.0188026)
------------------------------------------------------------
#Fit statistic : Chi-Squared =          69.38 using 59 PHA bins.
# Reduced chi-squared =          1.262 for     55 degrees of freedom
# Null hypothesis probability =   9.180722e-02

Energy  Fluence     90% Error
[keV]   [erg/cm2]   [erg/cm2]
15- 25  1.727e-06   1.954e-07
25- 50  4.145e-06   3.411e-07
50-150  9.843e-06   7.008e-07
15-150  1.571e-05   1.038e-06
Peak spectrum fit
Power-law model

Time interval is from    2.844 sec. to    3.844 sec.

Spectral model in power-law:
------------------------------------------------------------
Parameters  : value       lower 90%   higher 90%
Photon index: 1.57056     ( -0.0826836   0.0833532 )
Norm@50keV  : 0.197801    ( -0.0103594   0.0103554 )
------------------------------------------------------------
#Fit statistic : Chi-Squared =          75.14 using 59 PHA bins.
# Reduced chi-squared =          1.318 for     57 degrees of freedom
# Null hypothesis probability =   5.401131e-02

Photon flux (15-150 keV)    in 1 sec: 25.1920 ( -1.40612  1.40899 ) ph/cm2/s
Energy fluence (15-150 keV)             : 1.85683e-06 ( -1.01116e-07  1.01202e-07 ) ergs/cm2
Cutoff power-law model

Time interval is from    2.844 sec. to    3.844 sec.
Spectral model in the cutoff power-law:
------------------------------------------------------------
Parameters  : value       lower 90%   higher 90%
Photon index: 0.866451     ( -0.387248   0.359258 )
Epeak [keV] : 89.7569      ( -14.502 36.2626 )
Norm@50keV  : 0.421750    ( -0.132345   0.209822 )
------------------------------------------------------------
#Fit statistic : Chi-Squared =          63.26 using 59 PHA bins.
# Reduced chi-squared =          1.130 for     56 degrees of freedom
# Null hypothesis probability =   2.354337e-01

Photon flux (15-150 keV)    in 1 sec: 24.5645 ( -1.4316  1.4397 ) ph/cm2/s
Energy fluence (15-150 keV)             : 1.83564e-06 ( 0  0 ) ergs/cm2
Band function
Time interval is from    2.844 sec. to    3.844 sec.

Spectral model in the Band function:
------------------------------------------------------------
Parameters  : value       lower 90%   higher 90%
alpha       : -0.881169   ( -0.321934   0.297474 )
beta        : -9.35510    ( 9.36878   19.3688 )
Epeak [keV] : 90.8962      ( -11.8991 33.9101 )
Norm@50keV   : 0.414030    ( -0.124304   0.0759941 )
------------------------------------------------------------
#Fit statistic : Chi-Squared =          63.27 using 59 PHA bins.
# Reduced chi-squared =          1.150 for     55 degrees of freedom
# Null hypothesis probability =   2.074954e-01

Photon flux (15-150 keV)    in 1 sec: 24.5734 (    ) ph/cm2/s
Energy fluence (15-150 keV)             : 1.83503e-06 ( 0  0 ) ergs/cm2
Single BB
Spectral model blackbody:
------------------------------------------------------------
Parameters  : value    Lower 90%  Upper 90%
kT [keV]    : 16.4788  (  )
R^2/D10^2   : 2.12583  (   )
(R is the radius in km and D10 is the distance to the source in units of 10 kpc)
------------------------------------------------------------
#Fit statistic : Chi-Squared =         129.28 using 59 PHA bins.
# Reduced chi-squared =         2.2681 for     57 degrees of freedom
# Null hypothesis probability =   1.548387e-07

Energy  Fluence     90% Error
[keV]   [erg/cm2]   [erg/cm2]
15- 25  1.185e-07   1.070e-08
25- 50  5.113e-07   4.050e-08
50-150  9.811e-07   8.145e-08
15-150  1.611e-06   9.150e-08
Thermal bremsstrahlung (OTTB)
Spectral model: thermal bremsstrahlung
------------------------------------------------------------
Parameters  : value         Lower 90%    Upper 90%
kT [keV]    : 200.000       (      )
Norm        : 103.535       (-5.37724     5.37712)
------------------------------------------------------------
#Fit statistic : Chi-Squared =          66.63 using 59 PHA bins.
# Reduced chi-squared =          1.169 for     57 degrees of freedom
# Null hypothesis probability =   1.794721e-01

Energy  Fluence     90% Error
[keV]   [erg/cm2]   [erg/cm2]
15- 25  2.578e-07   1.610e-08
25- 50  4.958e-07   3.145e-08
50-150  1.087e-06   1.702e-07
15-150  1.841e-06   2.140e-07
Double BB

Spectral model: bbodyrad<1> + bbodyrad<2>
------------------------------------------------------------
Parameters  : value         Lower 90%    Upper 90%
kT1 [keV]   : 7.13098        (-1.59875      1.85489)
R1^2/D10^2  : 21.3340        (-10.9001      30.8348)
kT2 [keV]   : 23.6699        (-2.95272      4.76946)
R2^2/D10^2  : 0.458220    (-0.244622   0.338308)
------------------------------------------------------------
#Fit statistic : Chi-Squared =          65.52 using 59 PHA bins.
# Reduced chi-squared =          1.191 for     55 degrees of freedom
# Null hypothesis probability =   1.567423e-01

Energy  Fluence     90% Error
[keV]   [erg/cm2]   [erg/cm2]
15- 25  2.235e-07   5.970e-08
25- 50  5.049e-07   9.285e-08
50-150  1.101e-06   1.676e-07
15-150  1.830e-06   3.285e-07
Pre-slew spectrum (Pre-slew PHA with pre-slew DRM)
Power-law model
Spectral model in power-law:
------------------------------------------------------------
Parameters  : value       lower 90%   higher 90%
Photon index: 1.50801     ( -0.0503775   0.0502839 )
Norm@50keV  : 2.29779E-02    ( -0.000676177   0.000675882 )
------------------------------------------------------------
#Fit statistic : Chi-Squared =          79.41 using 59 PHA bins.
# Reduced chi-squared =          1.393 for     57 degrees of freedom
# Null hypothesis probability =   2.656274e-02

Photon flux (15-150 keV)    in 74.16 sec: 2.87476 ( -0.0974636  0.0978459 ) ph/cm2/s
Energy fluence (15-150 keV)             : 1.61444e-05 ( -4.7643e-07  4.76504e-07 ) ergs/cm2
Cutoff power-law model
Spectral model in the cutoff power-law:
------------------------------------------------------------
Parameters  : value       lower 90%   higher 90%
Photon index: 0.918028     ( -0.23574   0.224445 )
Epeak [keV] : 107.860      ( -15.0945 30.2332 )
Norm@50keV  : 4.14124E-02    ( -0.00812377   0.0106249 )
------------------------------------------------------------
#Fit statistic : Chi-Squared =          57.87 using 59 PHA bins.
# Reduced chi-squared =          1.033 for     56 degrees of freedom
# Null hypothesis probability =   4.059729e-01

Photon flux (15-150 keV)    in 74.16 sec: 2.76347 ( -0.10394  0.1046 ) ph/cm2/s
Energy fluence (15-150 keV)             : 1.58455e-05 ( -4.95982e-07  4.9487e-07 ) ergs/cm2
Band function

Spectral model in the Band function:
------------------------------------------------------------
Parameters  : value       lower 90%   higher 90%
alpha       : -0.843028   ( -0.262697   0.327029 )
beta        : -1.97831    ( 1.98122   0.237037 )
Epeak [keV] : 99.0092      ( -20.4858 31.6886 )
Norm@50keV   : 4.52770E-02    ( -0.0107516   0.0204404 )
------------------------------------------------------------
#Fit statistic : Chi-Squared =          57.01 using 59 PHA bins.
# Reduced chi-squared =          1.037 for     55 degrees of freedom
# Null hypothesis probability =   4.001728e-01

Photon flux (15-150 keV)    in 74.16 sec: 2.75006 ( 4.24994  -0.10582 ) ph/cm2/s
Energy fluence (15-150 keV)             : 0 ( 0  0 ) ergs/cm2
S(25-50 keV) vs. S(50-100 keV) plot
S(25-50 keV)  = 4.01e-06
S(50-100 keV) = 5.64e-06
T90 vs. Hardness ratio plot
T90                                   = 28.7199999988079 sec.
Hardness ratio (energy fluence ratio) = 1.40648
Color vs. Color plot
Count Ratio  (25-50 keV) / (15-25 keV) = 1.62666
Count Ratio (50-100 keV) / (15-25 keV) = 1.60363
Mask shadow pattern
IMX = 1.164784773247364E+00, IMY = 7.459877691451905E-01
TIME vs. PHA plot around the trigger time
TIME vs. DetID plot around the trigger time
100 us light curve (15-350 keV)
Spacecraft aspect plot

Bright source in the pre-burst/pre-slew/post-slew images
Pre-burst image of 15-350 keV band
Time interval of the image:
-299.656000 -35.592000

# RAcent  DECcent POSerr Theta    Phi  PeakCts   SNR AngSep     Name
#  [deg]    [deg]    ['] [deg]  [deg]                   [']
135.5170 -40.5458    0.6  23.3    6.5   3.2639  19.9    0.7	Vela X-1
170.1994 -60.6327    2.7  20.1  -79.0   0.7889   4.2    3.5	Cen X-3
186.4671 -62.7311    3.5  25.1  -95.4   0.7453   3.3    5.7	GX 301-2
207.2052 -54.8440    2.6  30.3 -121.9   0.9206   4.4 ------	UNKNOWN
119.2734 -81.0433    3.8  43.6  -64.1   2.6760   3.0 ------	UNKNOWN
Pre-slew background subtracted image of 15-350 keV band
Time interval of the image:
-35.592000 38.568000

# RAcent  DECcent POSerr Theta    Phi  PeakCts   SNR AngSep     Name
#  [deg]    [deg]    ['] [deg]  [deg]                   [']
135.5087 -40.5363    1.8  23.3    6.5   0.7337   6.4    1.4	Vela X-1
170.0745 -60.6577    7.6  20.1  -78.9  -0.1989  -1.5    7.4	Cen X-3
187.0786 -62.8216    9.0  25.3  -95.8   0.1770   1.3   12.0	GX 301-2
223.0859 -21.1980    2.7  51.4 -168.0   0.8763   4.3 ------	UNKNOWN
 81.2999 -57.7587    0.4  54.1  -32.6  24.0178  29.8 ------	UNKNOWN
Post-slew image of 15-350 keV band
Time interval of the image:
Plot creation:
Sun May 31 17:28:51 EDT 2015