Estimated redshift from machine learning (Ukwatta et al. 2016) - may take a few minute to calcaulte
Image
Pre-slew 15.0-350.0 keV image (Event data)
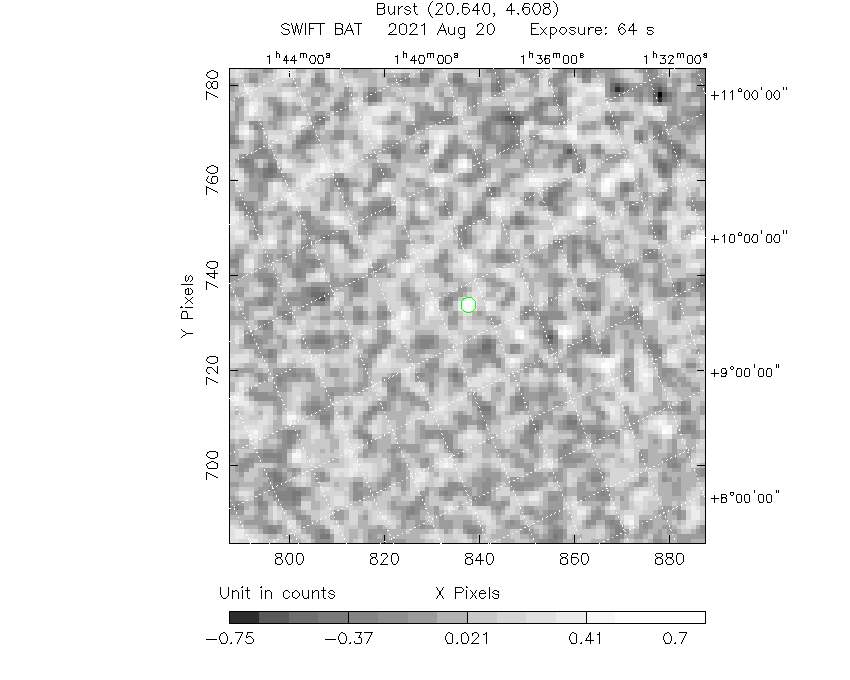
#   RAcent    DECcent   POSerr    Theta     Phi              Peak Cts       SNR   Name
   20.6248     4.6468   0.0383    28.6928   -80.7352         0.8242906      5.018 TRIG_01069551

Foreground time interval of the image:
  0.760  64.613 (delta_t =  63.853 [sec])
Background time interval of the image:
-239.288   0.760 (delta_t = 240.048 [sec])
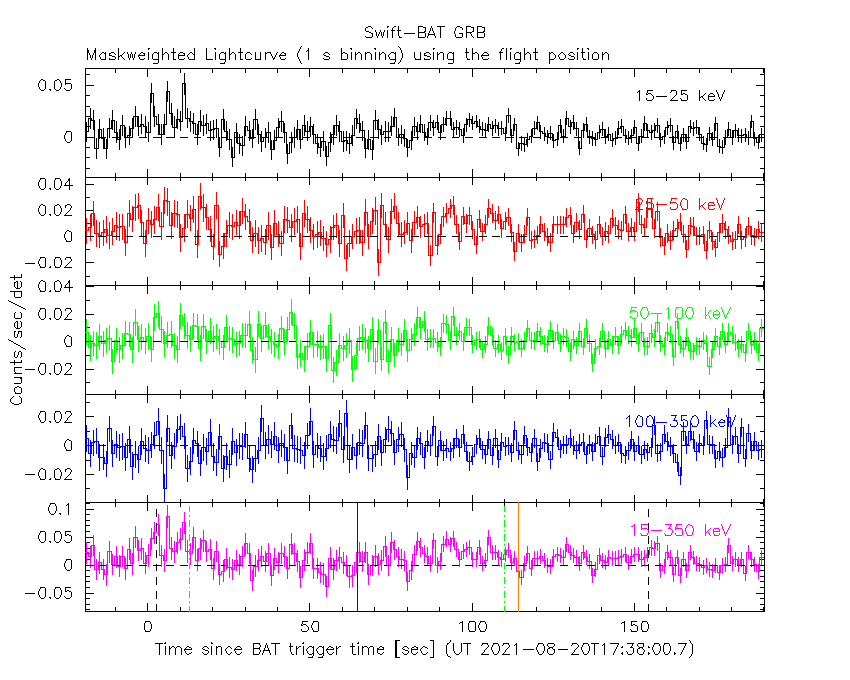
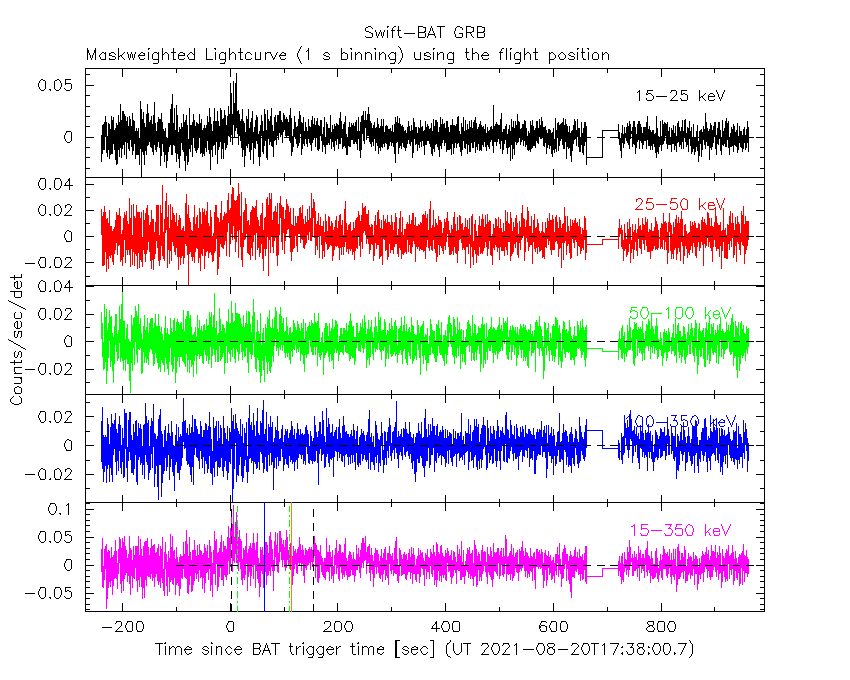
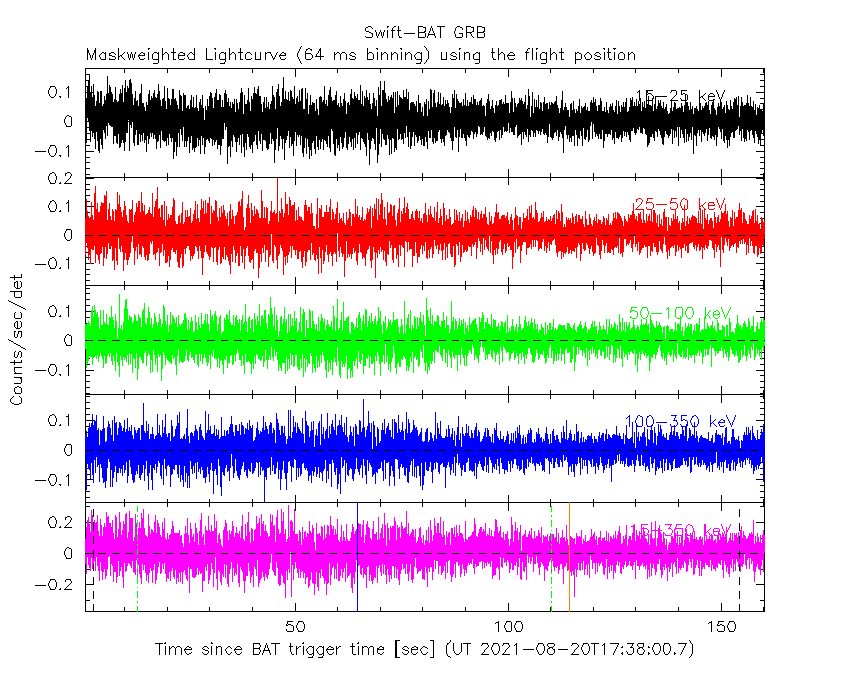
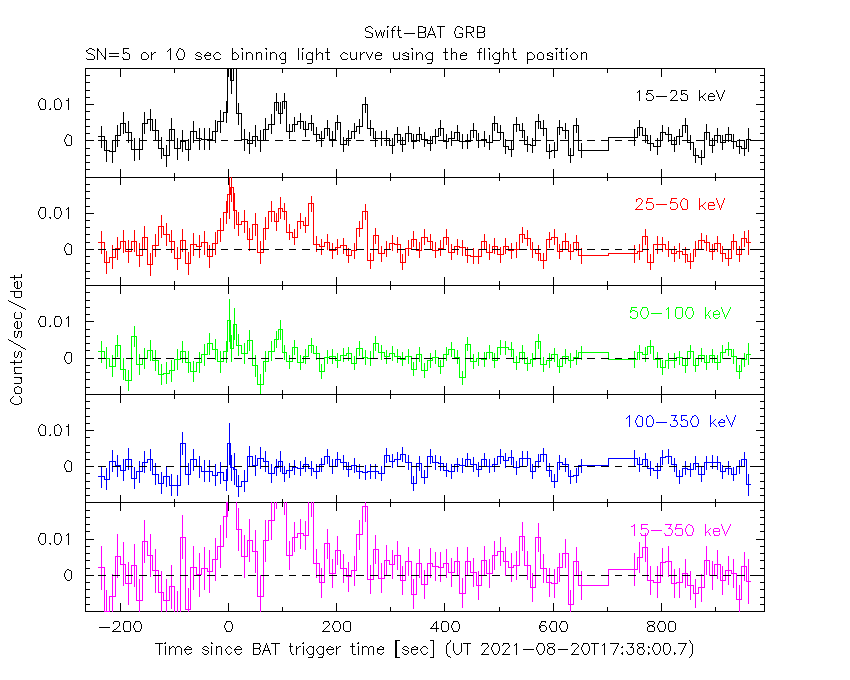
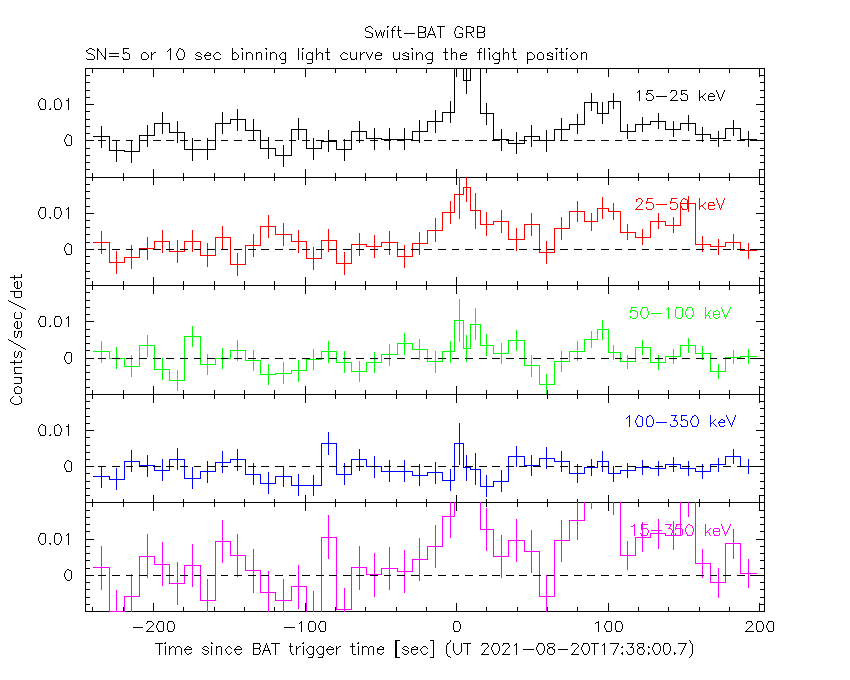
Lightcurves
Notes:
- 1) The mask-weighted light curves are using the flight position.
- 2) Multiple plots of different time binning/intervals are shown to cover all scenarios of short/long GRBs, rate/image triggers, and real/false positives.
- 3) For all the mask-weighted lightcurves, the y-axis units are counts/sec/det where a det is 0.4 x 0.4 = 0.16 sq cm.
- 4) The verticle lines correspond to following: green dotted lines are T50 interval, black dotted lines are T90 interval, blue solid line(s) is a spacecraft slew start time, and orange solid line(s) is a spacecraft slew end time.
- 5) Time of each bin is in the middle of the bin.
1 s binning
From T0-310 s to T0+310 s

From T100_start - 20 s to T100_end + 30 s
Full time interval
64 ms binning
Full time interval

From T100_start to T100_end
From T0-5 sec to T0+5 sec

16 ms binning
From T100_start-5 s to T100_start+5 s
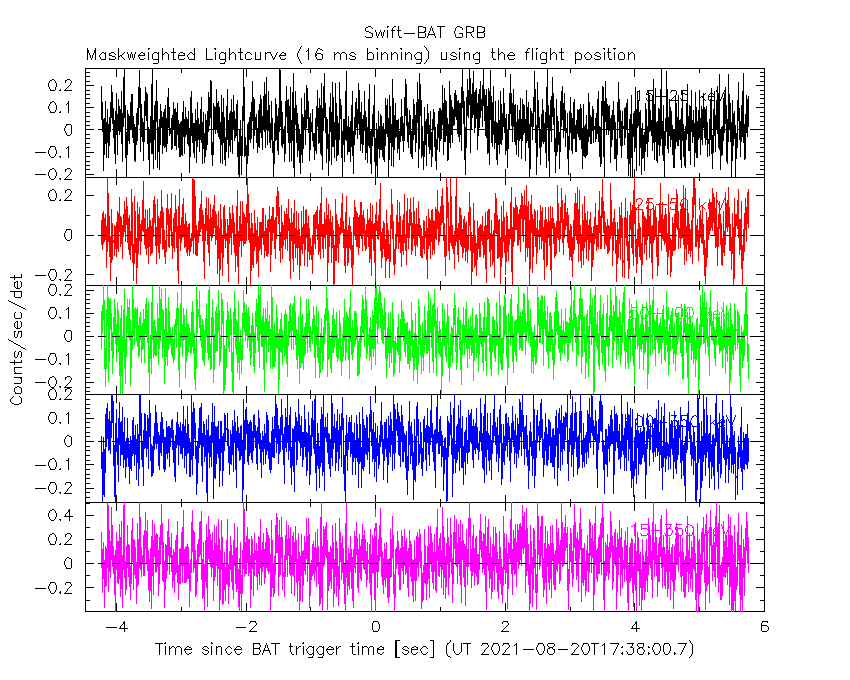
Blue+Cyan dotted lines: Time interval of the scaled map
From 0.000000 to 16.384000
8 ms binning
From T100_start-3 s to T100_start+3 s

Blue+Cyan dotted lines: Time interval of the scaled map
From 0.000000 to 16.384000
2 ms binning
From T100_start-1 s to T100_start+1 s

Blue+Cyan dotted lines: Time interval of the scaled map
From 0.000000 to 16.384000
SN=5 or 10 sec. binning (whichever binning is satisfied first)
SN=5 or 10 sec. binning (T < 200 sec)
Quad-rate summed light curves (from T0-300s to T0+1000s)

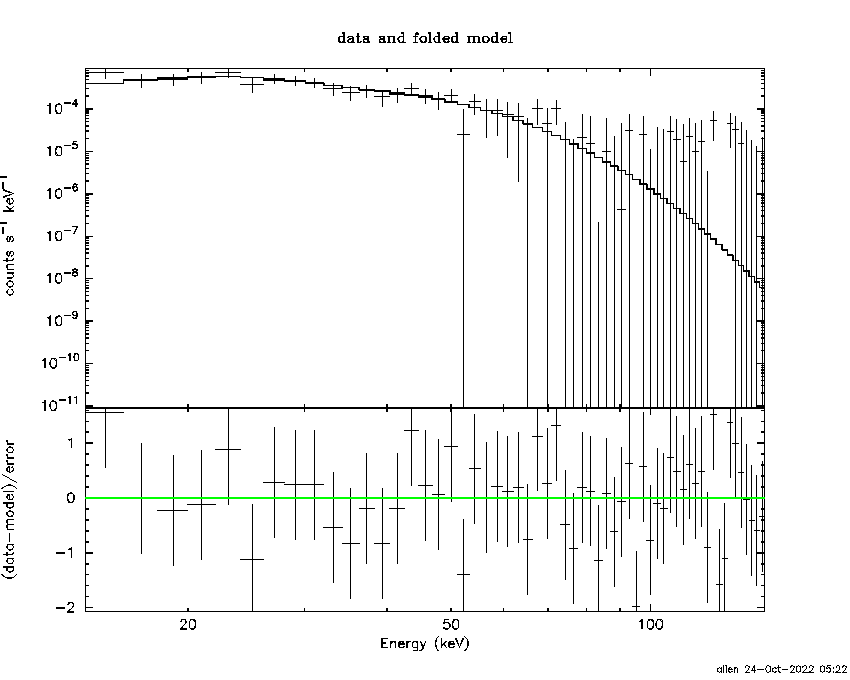
Spectral Evolution

Spectra
Notes:
- 1) The fitting includes the systematic errors.
- 2) When the burst includes telescope slew time periods, the fitting uses an average response file made from multiple 5-s response files through out the slew time plus single time preiod for the non-slew times, and weighted by the total counts in the corresponding time period using addrmf. An average response file is needed becuase a spectral fit using the pre-slew DRM will introduce some errors in both a spectral shape and a normalization if the PHA file contains a lot of the slew/post-slew time interval.
- 3) For fits to more complicated models (e.g. a power-law over a cutoff power-law), the BAT team has decided to require a chi-square improvement of more than 6 for each extra dof.
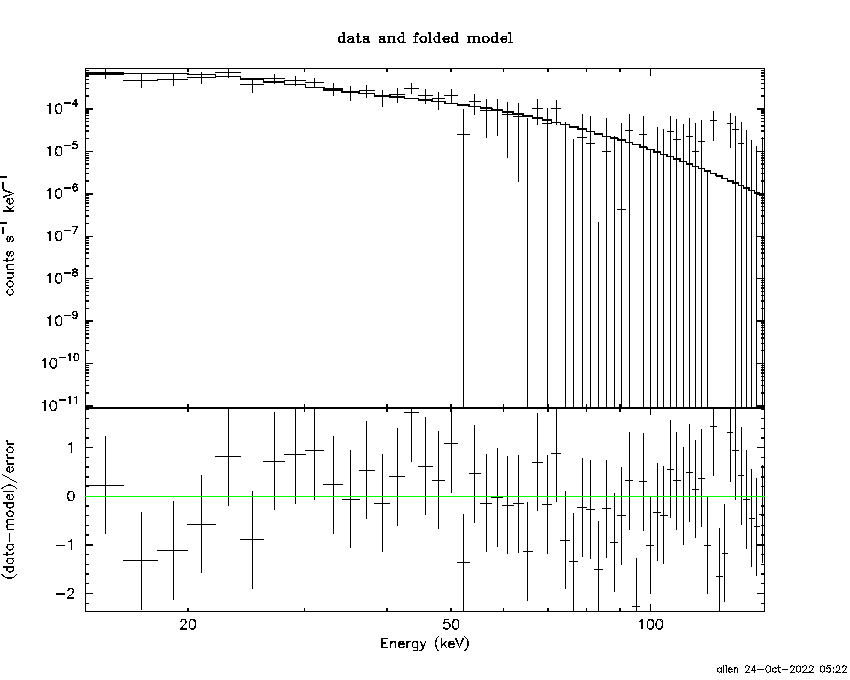
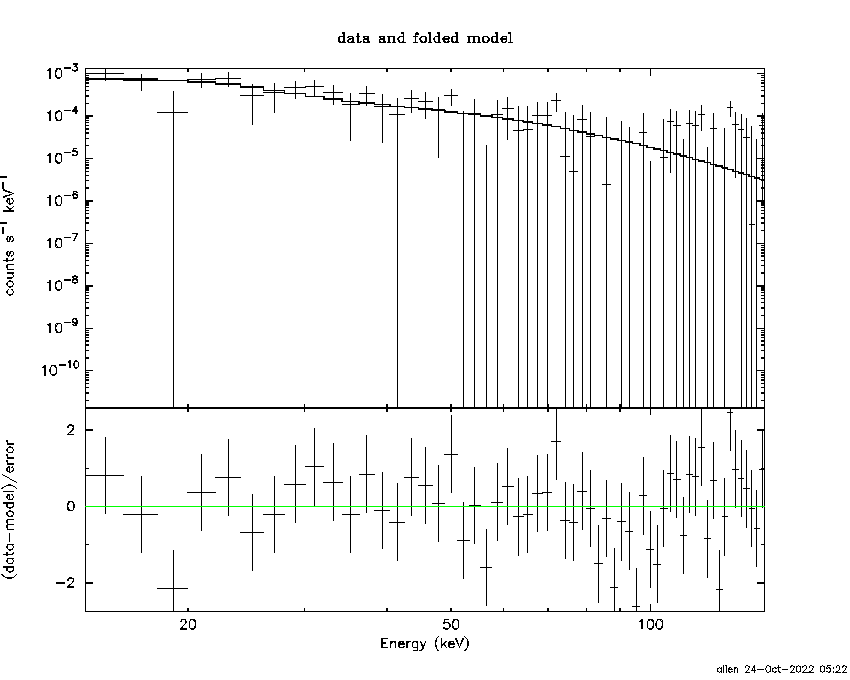
Time averaged spectrum fit using the average DRM
Power-law model

Time interval is from    0.760 sec. to  160.204 sec.

Spectral model in power-law:
------------------------------------------------------------
Parameters  : value       lower 90%   higher 90%
Photon index: 2.09686     ( -0.211691   0.227318 )
Norm@50keV  : 8.53766E-04    ( -0.000141413   0.000139686 )
------------------------------------------------------------
#Fit statistic  : Chi-Squared                   49.83     using 59 bins.
 Reduced chi-squared = 0.874211
# Null hypothesis probability of 7.39e-01 with 57 degrees of freedom

Photon flux (15-150 keV)    in 159.4 sec: 0.134122 ( -0.015879  0.015886 ) ph/cm2/s
Energy fluence (15-150 keV)             : 1.26412e-06 ( -1.87212e-07  1.9405e-07 ) ergs/cm2
Cutoff power-law model

Time interval is from    0.760 sec. to  160.204 sec.
Spectral model in the cutoff power-law:
------------------------------------------------------------
Parameters  : value       lower 90%   higher 90%
Photon index: -0.720458     ( -1.77316   1.3724 )
Epeak [keV] : 35.8048      ( -4.54293 5.05782 )
Norm@50keV  : 4.59707E-02    ( -0.0477179   0.55274 )
------------------------------------------------------------
#Fit statistic  : Chi-Squared                   34.44     using 59 bins.
 Reduced chi-squared = 0.615
# Null hypothesis probability of 9.90e-01 with 56 degrees of freedom

Photon flux (15-150 keV)    in 159.4 sec: 0.125754 ( -0.015555  0.015685 ) ph/cm2/s
Energy fluence (15-150 keV)             : 1.03803e-06 ( -1.4848e-07  1.68393e-07 ) ergs/cm2
Band function

Time interval is from    0.760 sec. to  160.204 sec.


Spectral model in the Band function:
------------------------------------------------------------
Parameters  : value       lower 90%   higher 90%
alpha       :    (     )
beta        :     (     )
Epeak [keV] :       (   )
Norm@50keV   :     (     )
------------------------------------------------------------

Photon flux (15-150 keV)    in  sec:  (    ) ph/cm2/s
Energy fluence (15-150 keV)             : 0 ( 0  0 ) ergs/cm2
Single BB
Spectral model blackbody:
------------------------------------------------------------
Parameters  : value    Lower 90%  Upper 90%
kT [keV]    : 9.19789  (-0.971048  1.08183)
R^2/D10^2   : 9.17545E-02  (-0.0323021   0.0495075)
(R is the radius in km and D10 is the distance to the source in units of 10 kpc)
------------------------------------------------------------
#Fit statistic  : Chi-Squared                   35.04     using 59 bins.
 Reduced chi-squared =
# Null hypothesis probability of 9.90e-01 with 57 degrees of freedom

Energy  Fluence     90% Error
[keV]   [erg/cm2]   [erg/cm2]
15- 25  2.435e-07   4.535e-08
25- 50  5.353e-07   7.611e-08
50-150  2.182e-07   7.227e-08
15-150  9.971e-07   1.392e-07
Thermal bremsstrahlung (OTTB)
Spectral model: thermal bremsstrahlung
------------------------------------------------------------
Parameters  : value         Lower 90%    Upper 90%
kT [keV]    : 49.5454       (-12.6531      20.1555)
Norm        : 0.778778       (-0.134483     0.172153)
------------------------------------------------------------
#Fit statistic  : Chi-Squared                   41.22     using 59 bins.
 Reduced chi-squared =
# Null hypothesis probability of 9.43e-01 with 57 degrees of freedom

Energy  Fluence     90% Error
[keV]   [erg/cm2]   [erg/cm2]
15- 25  3.029e-07   4.224e-08
25- 50  4.336e-07   6.759e-08
50-150  4.174e-07   1.724e-07
15-150  1.154e-06   2.047e-07
Double BB
Spectral model: bbodyrad<1> + bbodyrad<2>
------------------------------------------------------------
Parameters  : value         Lower 90%    Upper 90%
kT1 [keV]   : 0.571032        (-1.35748      10.9353)
R1^2/D10^2  : 8.22877E+08        (-9.14436e+08      7.72489e+14)
kT2 [keV]   : 9.41079        (-1.01169      1.65024)
R2^2/D10^2  : 8.27133E-02    (-0.030256   0.0331431)
------------------------------------------------------------
#Fit statistic  : Chi-Squared                   32.48     using 59 bins.
 Reduced chi-squared =
# Null hypothesis probability of 9.93e-01 with 55 degrees of freedom

Energy  Fluence     90% Error
[keV]   [erg/cm2]   [erg/cm2]
15- 25  2.506e-07   5.760e-08
25- 50  5.233e-07   1.050e-07
50-150  2.385e-07   7.967e-08
15-150  1.012e-06   1.898e-07
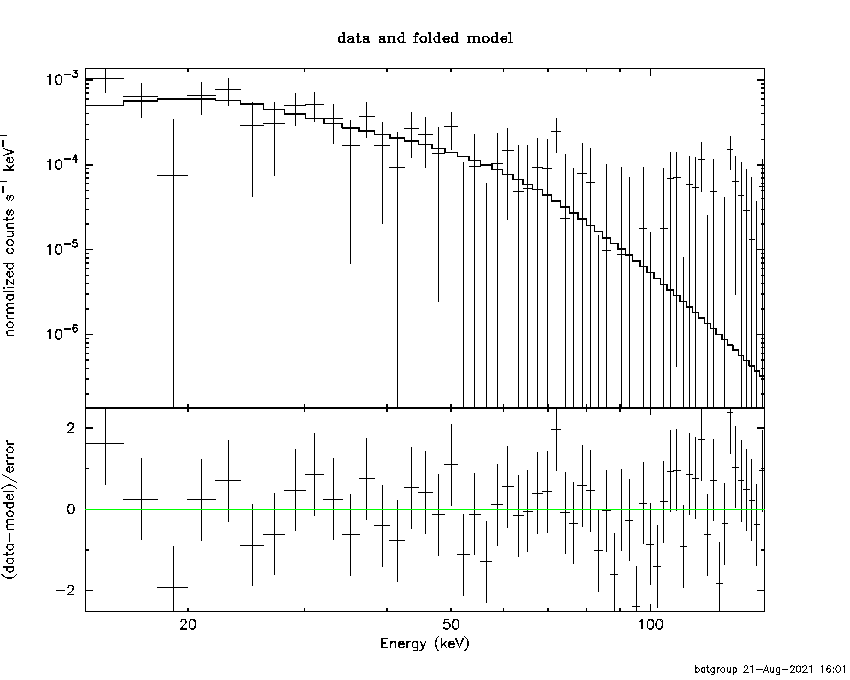
Peak spectrum fit
Power-law model
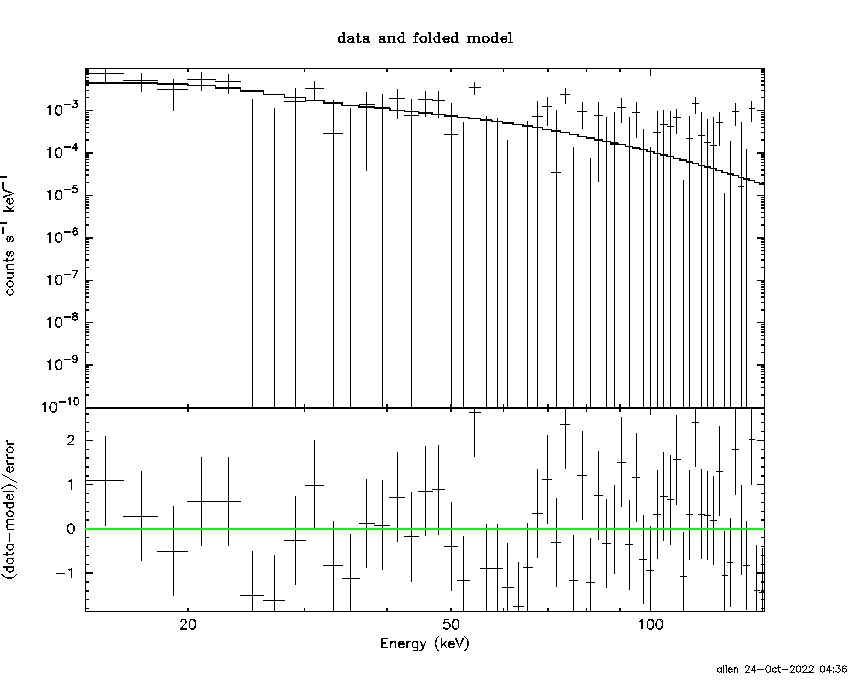
Time interval is from   10.916 sec. to   11.916 sec.

Spectral model in power-law:
------------------------------------------------------------
Parameters  : value       lower 90%   higher 90%
Photon index: 2.19324     ( -0.700131   0.990184 )
Norm@50keV  : 5.03925E-03    ( -0.00282273   0.0023934 )
------------------------------------------------------------
#Fit statistic  : Chi-Squared                   71.14     using 59 bins.
 Reduced chi-squared = 1.24807
# Null hypothesis probability of 9.86e-02 with 57 degrees of freedom

Photon flux (15-150 keV)    in 1 sec: 0.831338 ( -0.242276  0.242092 ) ph/cm2/s
Energy fluence (15-150 keV)             : 4.73086e-08 ( -1.95748e-08  2.12197e-08 ) ergs/cm2
Cutoff power-law model
Time interval is from   10.916 sec. to   11.916 sec.
Spectral model in the cutoff power-law:
------------------------------------------------------------
Parameters  : value       lower 90%   higher 90%
Photon index: 2.11012     ( -0.872007   0.722953 )
Epeak [keV] : 47.0245      (   )
Norm@50keV  : 4.48488E-03    (     )
------------------------------------------------------------
#Fit statistic  : Chi-Squared                   70.87     using 59 bins.
 Reduced chi-squared = 1.26554
# Null hypothesis probability of 8.71e-02 with 56 degrees of freedom

Photon flux (15-150 keV)    in 1 sec: 0.739584 ( -0.560162  0.052621 ) ph/cm2/s
Energy fluence (15-150 keV)             : 1.49101e-08 ( -9.86535e-09  2.59915e-08 ) ergs/cm2
Band function

Time interval is from   10.916 sec. to   11.916 sec.


Spectral model in the Band function:
------------------------------------------------------------
Parameters  : value       lower 90%   higher 90%
alpha       :    (     )
beta        :     (     )
Epeak [keV] :       (   )
Norm@50keV   :     (     )
------------------------------------------------------------

Photon flux (15-150 keV)    in  sec:  (    ) ph/cm2/s
Energy fluence (15-150 keV)             : 0 ( 0  0 ) ergs/cm2
Single BB

Spectral model blackbody:
------------------------------------------------------------
Parameters  : value    Lower 90%  Upper 90%
kT [keV]    : 6.96193  (-4.10889  5.27774)
R^2/D10^2   : 1.43831  (-1.38826   91.791)
(R is the radius in km and D10 is the distance to the source in units of 10 kpc)
------------------------------------------------------------
#Fit statistic  : Chi-Squared                   78.59     using 59 bins.
 Reduced chi-squared =
# Null hypothesis probability of 3.06e-02 with 57 degrees of freedom

Energy  Fluence     90% Error
[keV]   [erg/cm2]   [erg/cm2]
15- 25  1.114e-08   6.895e-09
25- 50  1.509e-08   9.620e-09
50-150  2.452e-09   2.211e-09
15-150  2.868e-08   1.727e-08
Thermal bremsstrahlung (OTTB)

Spectral model: thermal bremsstrahlung
------------------------------------------------------------
Parameters  : value         Lower 90%    Upper 90%
kT [keV]    : 57.4844       (-42.4299      -58.0826)
Norm        : 4.30913       (-1.87711     7.84473)
------------------------------------------------------------
#Fit statistic  : Chi-Squared                   73.36     using 59 bins.
 Reduced chi-squared =
# Null hypothesis probability of 7.11e-02 with 57 degrees of freedom

Energy  Fluence     90% Error
[keV]   [erg/cm2]   [erg/cm2]
15- 25  1.075e-08   5.829e-09
25- 50  1.615e-08   9.578e-09
50-150  1.772e-08   1.395e-08
15-150  4.462e-08   2.846e-08
Double BB

Spectral model: bbodyrad<1> + bbodyrad<2>
------------------------------------------------------------
Parameters  : value         Lower 90%    Upper 90%
kT1 [keV]   : 3.30833        (-1.70928      3.46809)
R1^2/D10^2  : 39.2157        (-37.1736      5262.57)
kT2 [keV]   : 34.7263        (-24.6977      -35.0121)
R2^2/D10^2  : 4.28838E-03    (-0.00398751   0.224839)
------------------------------------------------------------
#Fit statistic  : Chi-Squared                   69.14     using 59 bins.
 Reduced chi-squared =
# Null hypothesis probability of 9.52e-02 with 55 degrees of freedom

Energy  Fluence     90% Error
[keV]   [erg/cm2]   [erg/cm2]
15- 25  1.387e-08   8.210e-09
25- 50  7.460e-09   4.125e-09
50-150  3.807e-08   2.305e-08
15-150  5.940e-08   3.150e-08
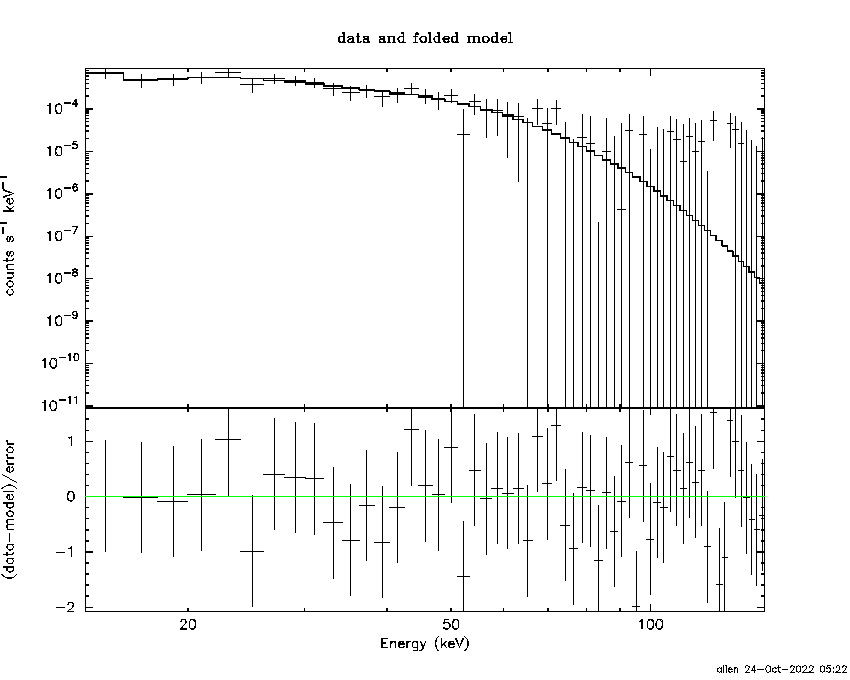
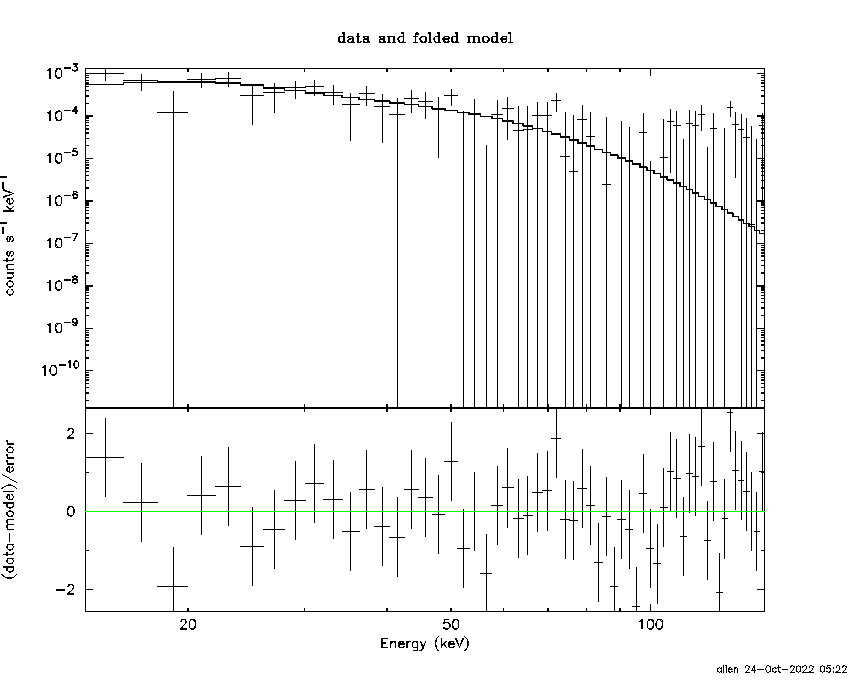
Pre-slew spectrum (Pre-slew PHA with pre-slew DRM)
Power-law model
Spectral model in power-law:
------------------------------------------------------------
Parameters  : value       lower 90%   higher 90%
Photon index: 2.18015     ( -0.399703   0.471861 )
Norm@50keV  : 8.51162E-04    ( -0.000276326   0.000268042 )
------------------------------------------------------------
#Fit statistic  : Chi-Squared                   57.92     using 59 bins.
 Reduced chi-squared =
# Null hypothesis probability of 4.41e-01 with 57 degrees of freedom

Photon flux (15-150 keV)    in 63.85 sec: 0.139458 ( -0.0295743  0.0295997 ) ph/cm2/s
Energy fluence (15-150 keV)             : 5.09586e-07 ( -1.37686e-07  1.47836e-07 ) ergs/cm2
Cutoff power-law model
Spectral model in the cutoff power-law:
------------------------------------------------------------
Parameters  : value       lower 90%   higher 90%
Photon index: 0.380514     ( -3.17341   1.90203 )
Epeak [keV] : 33.4682      ( -30.2584 -33.5443 )
Norm@50keV  : 1.09696E-02    ( -0.0114753   1.12333 )
------------------------------------------------------------
#Fit statistic  : Chi-Squared                   55.99     using 59 bins.
 Reduced chi-squared =
# Null hypothesis probability of 4.75e-01 with 56 degrees of freedom

Photon flux (15-150 keV)    in 63.85 sec: 0.133337 ( -0.029234  0.029776 ) ph/cm2/s
Energy fluence (15-150 keV)             : 4.3943e-07 ( -1.14956e-07  1.56889e-07 ) ergs/cm2
Band function
Spectral model in the Band function:
------------------------------------------------------------
Parameters  : value       lower 90%   higher 90%
alpha       :    (     )
beta        :     (     )
Epeak [keV] :       (   )
Norm@50keV   :     (     )
------------------------------------------------------------

Photon flux (15-150 keV)    in  sec:  (    ) ph/cm2/s
Energy fluence (15-150 keV)             : 0 ( 0  0 ) ergs/cm2
S(25-50 keV) vs. S(50-100 keV) plot

S(25-50 keV)  = 3.91e-07
S(50-100 keV) = 3.65e-07
T90 vs. Hardness ratio plot
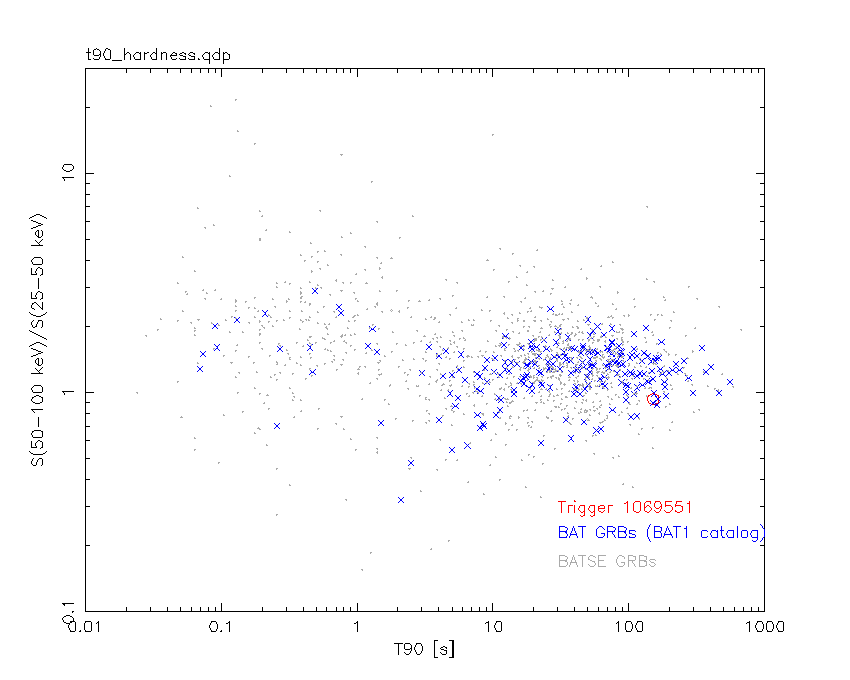
T90                                   = 151.740000009537 sec.
Hardness ratio (energy fluence ratio) = 0.933504
Color vs. Color plot

Count Ratio  (25-50 keV) / (15-25 keV) = 1.29231
Count Ratio (50-100 keV) / (15-25 keV) = 0.289044
Mask shadow pattern
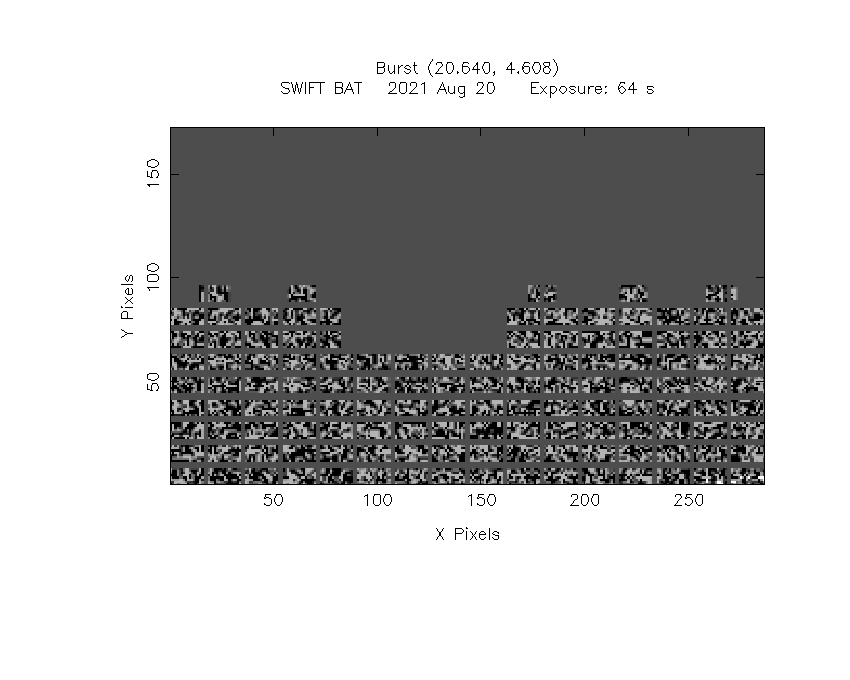
IMX = 8.811704475905083E-02, IMY = 5.401816746833300E-01
TIME vs. PHA plot around the trigger time
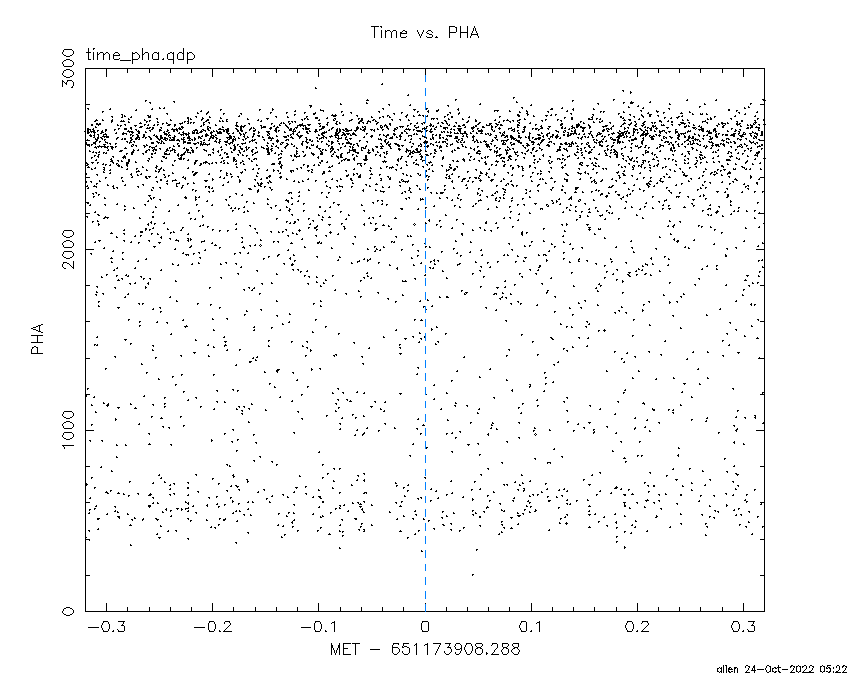
Blue+Cyan dotted lines: Time interval of the scaled map
From 0.000000 to 16.384000
TIME vs. DetID plot around the trigger time
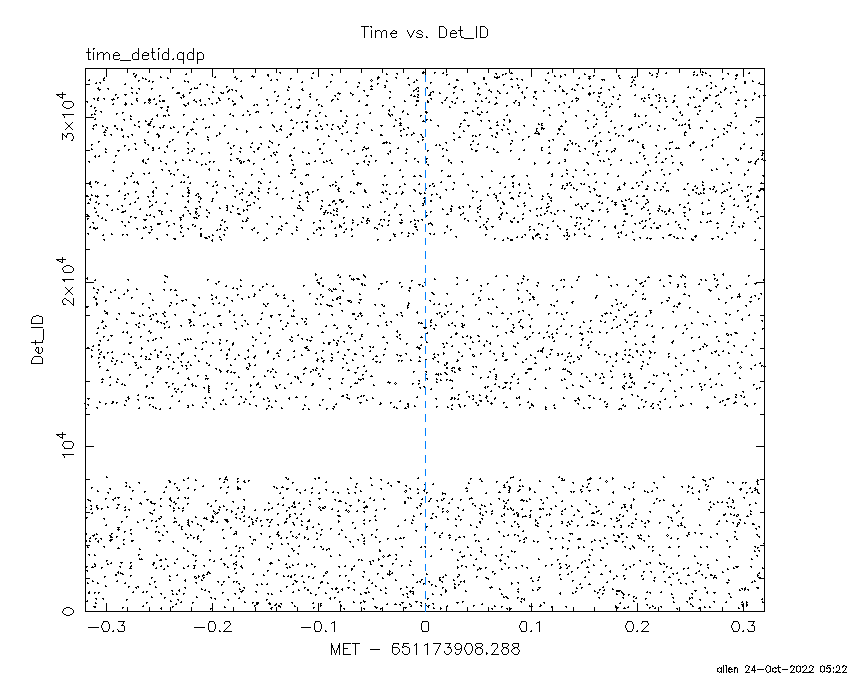
Blue+Cyan dotted lines: Time interval of the scaled map
From 0.000000 to 16.384000
100 us light curve (15-350 keV)

Blue+Cyan dotted lines: Time interval of the scaled map
From 0.000000 to 16.384000
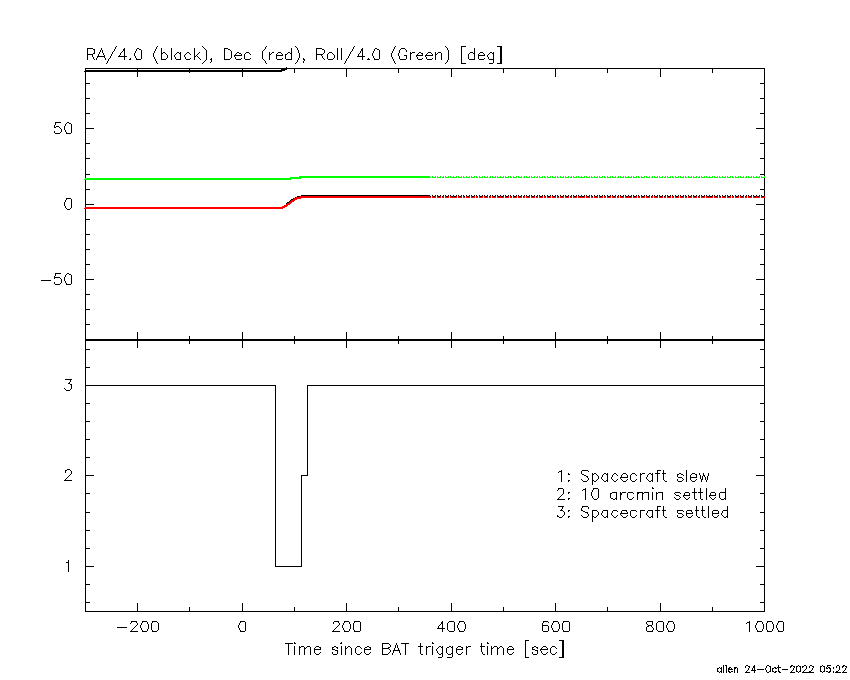
Spacecraft aspect plot
Bright source in the pre-burst/pre-slew/post-slew images
Pre-burst image of 15-350 keV band
Time interval of the image:
-239.288000 0.760000

# RAcent  DECcent POSerr Theta    Phi  PeakCts   SNR AngSep     Name
#  [deg]    [deg]    ['] [deg]  [deg]                   [']
326.0353  38.3040   13.4  48.0  175.7   0.6751   0.9    6.5	Cyg X-2
 30.0871 -34.1680    2.8  46.7  -19.2   2.1233   4.2 ------	UNKNOWN
  7.2471  36.6296    3.0  41.6 -138.4   2.0655   3.9 ------	UNKNOWN
 33.5500 -18.4036    2.7  42.8  -41.4   2.2187   4.2 ------	UNKNOWN
Pre-slew background subtracted image of 15-350 keV band
Time interval of the image:
0.760000 64.612600

# RAcent  DECcent POSerr Theta    Phi  PeakCts   SNR AngSep     Name
#  [deg]    [deg]    ['] [deg]  [deg]                   [']
326.0616  38.2695    6.7  47.9  175.7  -0.4779  -1.7    6.1	Cyg X-2
330.2114  35.6836    2.3  43.9  177.3   1.0221   5.0 ------	UNKNOWN
 20.6241   4.6451    2.3  28.7  -80.7   0.8336   5.1 ------	UNKNOWN
 21.6564  33.8732    2.0  45.6 -121.8   2.6920   5.7 ------	UNKNOWN
Post-slew image of 15-350 keV band
Time interval of the image:
114.412620 662.878000
720.712000 723.464900
725.712000 733.205700
735.712000 743.530000
745.712000 753.463100
754.712000 763.632000
764.712000 786.372000
787.712000 796.032600
797.712000 816.882000
818.712000 962.752000

# RAcent  DECcent POSerr Theta    Phi  PeakCts   SNR AngSep     Name
#  [deg]    [deg]    ['] [deg]  [deg]                   [']
  0.7903   8.3271    3.3  20.0  121.0   2.6306   3.6  501.9	UNKNOWN
 32.2002  14.1510    2.8  14.9 -111.4   2.5176   4.1 ------	UNKNOWN
 55.0617  37.2172    2.7  45.3 -121.4  12.4474   4.3 ------	UNKNOWN
 59.4050  21.7621    3.9  41.3  -98.9  10.9023   2.9 ------	UNKNOWN
Plot creation:
Mon Oct 24 05:22:42 EDT 2022