Estimated redshift from machine learning (Ukwatta et al. 2016) - may take a few minute to calcaulte
Image
Pre-slew 15.0-350.0 keV image (Event data)
#   RAcent    DECcent   POSerr    Theta     Phi              Peak Cts       SNR   Name
  309.0539   -44.4229   0.0101    32.9728    54.4855         3.8119101     18.965 TRIG_01071993

Foreground time interval of the image:
-24.168  27.309 (delta_t =  51.477 [sec])
Background time interval of the image:
-239.992 -24.168 (delta_t = 215.824 [sec])
Lightcurves
Notes:
- 1) The mask-weighted light curves are using the flight position.
- 2) Multiple plots of different time binning/intervals are shown to cover all scenarios of short/long GRBs, rate/image triggers, and real/false positives.
- 3) For all the mask-weighted lightcurves, the y-axis units are counts/sec/det where a det is 0.4 x 0.4 = 0.16 sq cm.
- 4) The verticle lines correspond to following: green dotted lines are T50 interval, black dotted lines are T90 interval, blue solid line(s) is a spacecraft slew start time, and orange solid line(s) is a spacecraft slew end time.
- 5) Time of each bin is in the middle of the bin.
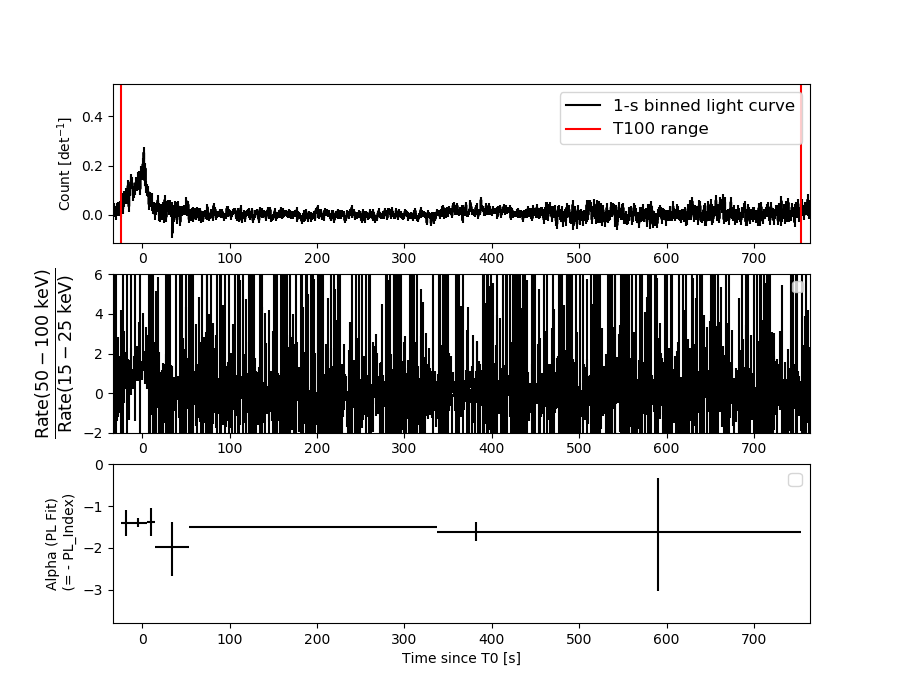
1 s binning
From T0-310 s to T0+310 s
From T100_start - 20 s to T100_end + 30 s

Full time interval

64 ms binning
Full time interval
From T100_start to T100_end

From T0-5 sec to T0+5 sec

16 ms binning
From T100_start-5 s to T100_start+5 s
Blue+Cyan dotted lines: Time interval of the scaled map
From 0.000000 to 2.048000
8 ms binning
From T100_start-3 s to T100_start+3 s

Blue+Cyan dotted lines: Time interval of the scaled map
From 0.000000 to 2.048000
2 ms binning
From T100_start-1 s to T100_start+1 s

Blue+Cyan dotted lines: Time interval of the scaled map
From 0.000000 to 2.048000
SN=5 or 10 sec. binning (whichever binning is satisfied first)

SN=5 or 10 sec. binning (T < 200 sec)
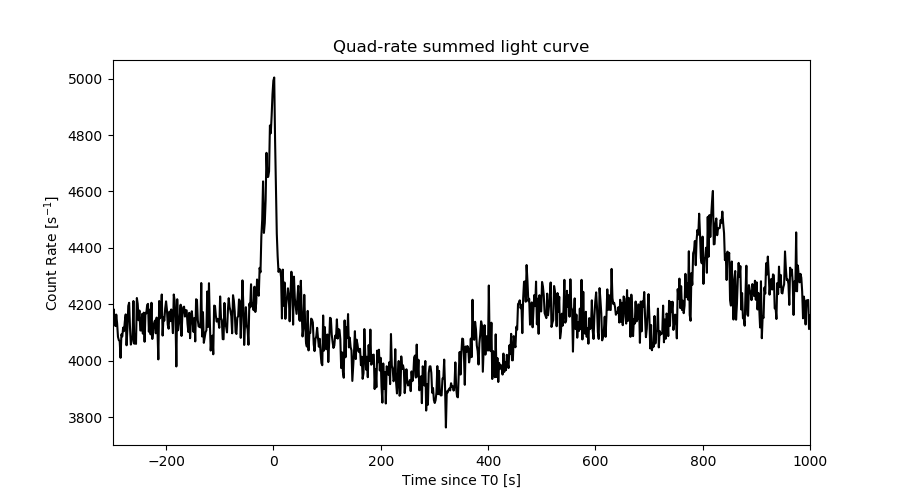
Quad-rate summed light curves (from T0-300s to T0+1000s)
Spectral Evolution
Spectra
Notes:
- 1) The fitting includes the systematic errors.
- 2) When the burst includes telescope slew time periods, the fitting uses an average response file made from multiple 5-s response files through out the slew time plus single time preiod for the non-slew times, and weighted by the total counts in the corresponding time period using addrmf. An average response file is needed becuase a spectral fit using the pre-slew DRM will introduce some errors in both a spectral shape and a normalization if the PHA file contains a lot of the slew/post-slew time interval.
- 3) For fits to more complicated models (e.g. a power-law over a cutoff power-law), the BAT team has decided to require a chi-square improvement of more than 6 for each extra dof.
Time averaged spectrum fit using the average DRM
Power-law model

Time interval is from  -24.168 sec. to  754.232 sec.

Spectral model in power-law:
------------------------------------------------------------
Parameters  : value       lower 90%   higher 90%
Photon index: 1.51194     ( -0.19203   0.193847 )
Norm@50keV  : 5.80858E-04    ( -6.83971e-05   6.78568e-05 )
------------------------------------------------------------
#Fit statistic  : Chi-Squared                   56.86     using 59 bins.
 Reduced chi-squared = 0.997544
# Null hypothesis probability of 4.80e-01 with 57 degrees of freedom

Photon flux (15-150 keV)    in 778.4 sec: 7.27510E-02 ( -0.0082735  0.0082814 ) ph/cm2/s
Energy fluence (15-150 keV)             : 4.28157e-06 ( -5.49556e-07  5.56846e-07 ) ergs/cm2
Cutoff power-law model
Time interval is from  -24.168 sec. to  754.232 sec.
Spectral model in the cutoff power-law:
------------------------------------------------------------
Parameters  : value       lower 90%   higher 90%
Photon index: 0.974494     ( -0.886903   0.628387 )
Epeak [keV] : 90.4134      ( -32.0228 -90.4143 )
Norm@50keV  : 1.11878E-03    ( -0.000582038   0.00210867 )
------------------------------------------------------------
#Fit statistic  : Chi-Squared                   55.35     using 59 bins.
 Reduced chi-squared = 0.988393
# Null hypothesis probability of 5.00e-01 with 56 degrees of freedom

Photon flux (15-150 keV)    in 778.4 sec: 7.12245E-02 ( -0.0085652  0.0085508 ) ph/cm2/s
Energy fluence (15-150 keV)             : 4.07702e-06 ( -6.15211e-07  6.23144e-07 ) ergs/cm2
Band function

Time interval is from  -24.168 sec. to  754.232 sec.


Spectral model in the Band function:
------------------------------------------------------------
Parameters  : value       lower 90%   higher 90%
alpha       :    (     )
beta        :     (     )
Epeak [keV] :       (   )
Norm@50keV   :     (     )
------------------------------------------------------------

Photon flux (15-150 keV)    in  sec:  (    ) ph/cm2/s
Energy fluence (15-150 keV)             : 0 ( 0  0 ) ergs/cm2
Single BB

Spectral model blackbody:
------------------------------------------------------------
Parameters  : value    Lower 90%  Upper 90%
kT [keV]    : 14.0823  (-1.9029  2.25387)
R^2/D10^2   : 1.03126E-02  (-0.00422007   0.00696453)
(R is the radius in km and D10 is the distance to the source in units of 10 kpc)
------------------------------------------------------------
#Fit statistic  : Chi-Squared                   70.06     using 59 bins.
 Reduced chi-squared =
# Null hypothesis probability of 1.15e-01 with 57 degrees of freedom

Energy  Fluence     90% Error
[keV]   [erg/cm2]   [erg/cm2]
15- 25  3.361e-07   7.356e-08
25- 50  1.257e-06   2.074e-07
50-150  1.647e-06   3.900e-07
15-150  3.240e-06   4.628e-07
Thermal bremsstrahlung (OTTB)
Spectral model: thermal bremsstrahlung
------------------------------------------------------------
Parameters  : value         Lower 90%    Upper 90%
kT [keV]    : 199.362       (-81.7813      -199.363)
Norm        : 0.298090       (-0.0333589     0.0333945)
------------------------------------------------------------
#Fit statistic  : Chi-Squared                   55.70     using 59 bins.
 Reduced chi-squared =
# Null hypothesis probability of 5.24e-01 with 57 degrees of freedom

Energy  Fluence     90% Error
[keV]   [erg/cm2]   [erg/cm2]
15- 25  5.778e-07   3.204e-07
25- 50  1.111e-06   6.056e-07
50-150  2.438e-06   1.328e-06
15-150  4.127e-06   2.255e-06
Double BB

Spectral model: bbodyrad<1> + bbodyrad<2>
------------------------------------------------------------
Parameters  : value         Lower 90%    Upper 90%
kT1 [keV]   : 6.71980        (-2.20661      3.18343)
R1^2/D10^2  : 8.41820E-02        (-0.0580051      0.25468)
kT2 [keV]   : 23.5793        (-6.37932      22.1113)
R2^2/D10^2  : 1.30417E-03    (-0.00116644   0.00157451)
------------------------------------------------------------
#Fit statistic  : Chi-Squared                   54.50     using 59 bins.
 Reduced chi-squared =
# Null hypothesis probability of 4.93e-01 with 55 degrees of freedom

Energy  Fluence     90% Error
[keV]   [erg/cm2]   [erg/cm2]
15- 25  5.558e-07   3.068e-07
25- 50  1.130e-06   5.945e-07
50-150  2.387e-06   1.262e-06
15-150  4.074e-06   2.137e-06
Peak spectrum fit
Power-law model
Time interval is from    0.860 sec. to    1.860 sec.

Spectral model in power-law:
------------------------------------------------------------
Parameters  : value       lower 90%   higher 90%
Photon index: 0.973056     ( -0.322939   0.299061 )
Norm@50keV  : 1.58033E-02    ( -0.0028848   0.00281555 )
------------------------------------------------------------
#Fit statistic  : Chi-Squared                   49.08     using 59 bins.
 Reduced chi-squared = 0.861053
# Null hypothesis probability of 7.63e-01 with 57 degrees of freedom

Photon flux (15-150 keV)    in 1 sec: 1.81712 ( -0.3337  0.33668 ) ph/cm2/s
Energy fluence (15-150 keV)             : 1.72568e-07 ( -3.00663e-08  3.01209e-08 ) ergs/cm2
Cutoff power-law model

Time interval is from    0.860 sec. to    1.860 sec.
Spectral model in the cutoff power-law:
------------------------------------------------------------
Parameters  : value       lower 90%   higher 90%
Photon index: 0.966644     ( -1.15341   0.393493 )
Epeak [keV] : 9998.71      ( -9998.71 -9998.71 )
Norm@50keV  : 1.59009E-02    ( -0.00270481   0.0308711 )
------------------------------------------------------------
#Fit statistic  : Chi-Squared                   49.08     using 59 bins.
 Reduced chi-squared = 0.876429
# Null hypothesis probability of 7.32e-01 with 56 degrees of freedom

Photon flux (15-150 keV)    in 1 sec: 1.81785 ( -0.34314  0.33566 ) ph/cm2/s
Energy fluence (15-150 keV)             : 2.21243e-08 ( 0  0 ) ergs/cm2
Band function

Time interval is from    0.860 sec. to    1.860 sec.


Spectral model in the Band function:
------------------------------------------------------------
Parameters  : value       lower 90%   higher 90%
alpha       :    (     )
beta        :     (     )
Epeak [keV] :       (   )
Norm@50keV   :     (     )
------------------------------------------------------------

Photon flux (15-150 keV)    in  sec:  (    ) ph/cm2/s
Energy fluence (15-150 keV)             : 0 ( 0  0 ) ergs/cm2
Single BB
Spectral model blackbody:
------------------------------------------------------------
Parameters  : value    Lower 90%  Upper 90%
kT [keV]    : 26.1986  (-5.80059  8.49109)
R^2/D10^2   : 3.76885E-02  (-0.0214215   0.0448362)
(R is the radius in km and D10 is the distance to the source in units of 10 kpc)
------------------------------------------------------------
#Fit statistic  : Chi-Squared                   55.95     using 59 bins.
 Reduced chi-squared =
# Null hypothesis probability of 5.14e-01 with 57 degrees of freedom

Energy  Fluence     90% Error
[keV]   [erg/cm2]   [erg/cm2]
15- 25  4.381e-09   1.601e-09
25- 50  2.544e-08   8.625e-09
50-150  1.284e-07   3.770e-08
15-150  1.582e-07   4.873e-08
Thermal bremsstrahlung (OTTB)

Spectral model: thermal bremsstrahlung
------------------------------------------------------------
Parameters  : value         Lower 90%    Upper 90%
kT [keV]    : 200.000       (-43.1714      -200)
Norm        : 7.74094       (-1.38157     1.38157)
------------------------------------------------------------
#Fit statistic  : Chi-Squared                   59.93     using 59 bins.
 Reduced chi-squared =
# Null hypothesis probability of 3.70e-01 with 57 degrees of freedom

Energy  Fluence     90% Error
[keV]   [erg/cm2]   [erg/cm2]
15- 25  1.929e-08   1.095e-08
25- 50  3.711e-08   2.108e-08
50-150  8.139e-08   4.613e-08
15-150  1.378e-07   7.870e-08
Double BB

Spectral model: bbodyrad<1> + bbodyrad<2>
------------------------------------------------------------
Parameters  : value         Lower 90%    Upper 90%
kT1 [keV]   : 6.61674        (-2.65608      7.31316)
R1^2/D10^2  : 1.73930        (-1.50983      11.0729)
kT2 [keV]   : 35.4179        (-10.185      44.2001)
R2^2/D10^2  : 1.38907E-02    (-0.0123197   0.00884501)
------------------------------------------------------------
#Fit statistic  : Chi-Squared                   48.18     using 59 bins.
 Reduced chi-squared =
# Null hypothesis probability of 7.31e-01 with 55 degrees of freedom

Energy  Fluence     90% Error
[keV]   [erg/cm2]   [erg/cm2]
15- 25  1.394e-08   8.692e-09
25- 50  3.015e-08   1.608e-08
50-150  1.329e-07   7.588e-08
15-150  1.770e-07   9.338e-08
Pre-slew spectrum (Pre-slew PHA with pre-slew DRM)
Power-law model

Spectral model in power-law:
------------------------------------------------------------
Parameters  : value       lower 90%   higher 90%
Photon index: 1.45312     ( -0.11278   0.112715 )
Norm@50keV  : 5.61587E-03    ( -0.000371388   0.000370823 )
------------------------------------------------------------
#Fit statistic  : Chi-Squared                   48.99     using 59 bins.
 Reduced chi-squared =
# Null hypothesis probability of 7.66e-01 with 57 degrees of freedom

Photon flux (15-150 keV)    in 51.48 sec: 0.692615 ( -0.0467961  0.0468677 ) ph/cm2/s
Energy fluence (15-150 keV)             : 2.76495e-06 ( -1.99127e-07  2.00133e-07 ) ergs/cm2
Cutoff power-law model
Spectral model in the cutoff power-law:
------------------------------------------------------------
Parameters  : value       lower 90%   higher 90%
Photon index: 1.05658     ( -0.473817   0.437206 )
Epeak [keV] : 120.174      ( -40.6648 -120.174 )
Norm@50keV  : 8.88678E-03    ( -0.00335799   0.00625537 )
------------------------------------------------------------
#Fit statistic  : Chi-Squared                   46.46     using 59 bins.
 Reduced chi-squared =
# Null hypothesis probability of 8.14e-01 with 56 degrees of freedom

Photon flux (15-150 keV)    in 51.48 sec: 0.680808 ( -0.048514  0.048506 ) ph/cm2/s
Energy fluence (15-150 keV)             : 2.68715e-06 ( -2.18769e-07  2.18064e-07 ) ergs/cm2
Band function

Spectral model in the Band function:
------------------------------------------------------------
Parameters  : value       lower 90%   higher 90%
alpha       :    (     )
beta        :     (     )
Epeak [keV] :       (   )
Norm@50keV   :     (     )
------------------------------------------------------------

Photon flux (15-150 keV)    in  sec:  (    ) ph/cm2/s
Energy fluence (15-150 keV)             : 0 ( 0  0 ) ergs/cm2
S(25-50 keV) vs. S(50-100 keV) plot
S(25-50 keV)  = 1.07e-06
S(50-100 keV) = 1.49e-06
T90 vs. Hardness ratio plot

T90                                   = 778.399999976158 sec.
Hardness ratio (energy fluence ratio) = 1.39252
Color vs. Color plot
Count Ratio  (25-50 keV) / (15-25 keV) = 1.23702
Count Ratio (50-100 keV) / (15-25 keV) = 0.996207
Mask shadow pattern

IMX = 3.768542499992261E-01, IMY = -5.280474768247337E-01
TIME vs. PHA plot around the trigger time

Blue+Cyan dotted lines: Time interval of the scaled map
From 0.000000 to 2.048000
TIME vs. DetID plot around the trigger time
Blue+Cyan dotted lines: Time interval of the scaled map
From 0.000000 to 2.048000
100 us light curve (15-350 keV)
Blue+Cyan dotted lines: Time interval of the scaled map
From 0.000000 to 2.048000
Spacecraft aspect plot

Bright source in the pre-burst/pre-slew/post-slew images
Pre-burst image of 15-350 keV band
Time interval of the image:
-239.992000 -24.168000

# RAcent  DECcent POSerr Theta    Phi  PeakCts   SNR AngSep     Name
#  [deg]    [deg]    ['] [deg]  [deg]                   [']
170.0713 -60.5961   14.2  38.3 -103.5   0.7185   0.8    7.4	Cen X-3
186.6478 -62.7684    0.8  33.6  -92.2   6.8538  13.7    0.3	GX 301-2
256.1290 -37.8431   33.2  42.5  -11.2   0.1334   0.3    6.7	4U 1700-377
256.3925 -36.4379    7.5  43.9  -10.5   0.6403   1.6    2.3	GX 349+2
263.0780 -24.6921   13.3  54.4   -0.3  -0.7140  -0.9    4.9	GX 1+4
264.9059 -44.3913    5.6  34.8   -3.0  -0.6328  -2.1    7.8	4U 1735-44
270.2333 -25.1158    5.2  53.2    7.6   1.8114   2.2    3.5	GX 5-1
270.2808 -25.7419    3.6  52.5    7.6   2.3344   3.2    1.2	GRS 1758-258
275.9810 -30.4144   13.6  47.3   13.4   0.4491   0.9    4.1	H1820-303
285.1952 -24.9315    6.9  52.2   24.7   1.8737   1.7    8.7	HT1900.1-2455
263.1193 -33.8529    5.3  45.4   -2.1  -1.0236  -2.2    6.6	GX 354-0
  3.5473 -52.0283    2.8  35.0  121.9   1.9714   4.1 ------	UNKNOWN
304.5839 -53.6105    2.9  23.5   50.2   1.1915   4.0 ------	UNKNOWN
 60.5213 -45.8321    3.3  52.6  170.5   3.0632   3.5 ------	UNKNOWN
Pre-slew background subtracted image of 15-350 keV band
Time interval of the image:
-24.168000 27.308600

# RAcent  DECcent POSerr Theta    Phi  PeakCts   SNR AngSep     Name
#  [deg]    [deg]    ['] [deg]  [deg]                   [']
170.5611 -60.6580    5.7  38.2 -103.2   0.5762   2.0    7.5	Cen X-3
186.8020 -62.6311    3.4  33.7  -92.0   0.6939   3.4    9.3	GX 301-2
256.0212 -37.6934    5.2  42.7  -11.3   0.3830   2.2    9.2	4U 1700-377
256.3516 -36.4816    4.6  43.8  -10.6  -0.4377  -2.5    5.4	GX 349+2
262.9171 -24.7798    4.8  54.4   -0.5  -0.9289  -2.4    5.4	GX 1+4
264.6775 -44.4998    4.0  34.7   -3.3  -0.4046  -2.9    4.1	4U 1735-44
270.1547 -25.0206    5.8  53.3    7.6   0.7599   2.0    7.9	GX 5-1
270.2465 -25.7506   27.0  52.5    7.6  -0.1521  -0.4    3.1	GRS 1758-258
276.0212 -30.4882    6.0  47.2   13.5  -0.4807  -1.9    8.8	H1820-303
284.9479 -24.9875    7.1  52.1   24.4   0.8212   1.6    6.3	HT1900.1-2455
263.0702 -33.9380    8.8  45.3   -2.2   0.2666   1.3    7.4	GX 354-0
309.0539 -44.4229    0.6  33.0   54.5   3.8120  19.0 ------	UNKNOWN
298.0850 -41.7917    2.0  35.1   39.9   1.1575   5.7 ------	UNKNOWN
269.9521 -56.0024    2.4  22.7   -1.9   0.5351   4.8 ------	UNKNOWN
253.0708 -21.6706    2.5  58.9  -10.5   3.1832   4.7 ------	UNKNOWN
239.5985 -47.9374    2.0  36.0  -33.9   0.9162   5.9 ------	UNKNOWN
Post-slew image of 15-350 keV band
Time interval of the image:
80.508590 408.508600

# RAcent  DECcent POSerr Theta    Phi  PeakCts   SNR AngSep     Name
#  [deg]    [deg]    ['] [deg]  [deg]                   [']
255.8049 -37.8900   12.3  39.9  -59.1   0.7669   0.9    9.0	4U 1700-377
256.4317 -36.3599   14.6  40.2  -56.6   0.6443   0.8    3.8	GX 349+2
262.9701 -24.6122   17.9  42.1  -37.0  -0.4362  -0.6    8.3	GX 1+4
264.9633 -44.5510    0.0  31.0  -65.4  -0.9024  -1.7   11.2	4U 1735-44
268.2693  -1.4194    6.0  56.1  -11.3  -2.2286  -1.9    6.2	SW J1753.5-0127
270.4505 -25.1707    0.0  36.6  -30.6   0.2121   0.4   10.6	GX 5-1
270.3901 -25.8647   24.6  36.2  -31.6   0.2366   0.5    8.7	GRS 1758-258
273.9539 -14.0213    6.7  42.6  -14.9   0.9610   1.7    3.2	GX 17+2
276.0954 -30.3837    8.5  29.4  -32.1   0.6250   1.4    8.9	H1820-303
284.9445 -24.8394    9.2  27.7  -12.3  -0.4770  -1.3    7.0	HT1900.1-2455
263.1575 -33.8645   23.6  36.6  -48.7   0.3135   0.5    8.6	GX 354-0
 13.2436 -37.5502    3.3  47.7  145.8   4.5954   3.4 ------	UNKNOWN
263.7007  -6.7356    3.1  54.5  -19.6   4.2174   3.7 ------	UNKNOWN
242.4253 -62.6868    2.4  41.2  -99.7   7.1813   4.9 ------	UNKNOWN
Plot creation:
Mon Oct 24 05:20:11 EDT 2022