Click here for the BAT GCN circular template
Image
Pre-slew 15.0-350.0 keV image (Event data)
#   RAcent    DECcent   POSerr    Theta     Phi              Peak Cts       SNR   Name
  282.3127    -9.1508   0.0063    50.7179   -31.0364        16.3212599     30.525 TRIG_00107547

Foreground time interval of the image:
 -3.420 187.800 (delta_t = 191.220 [sec])
Background time interval of the image:
-299.296  -3.420 (delta_t = 295.876 [sec])
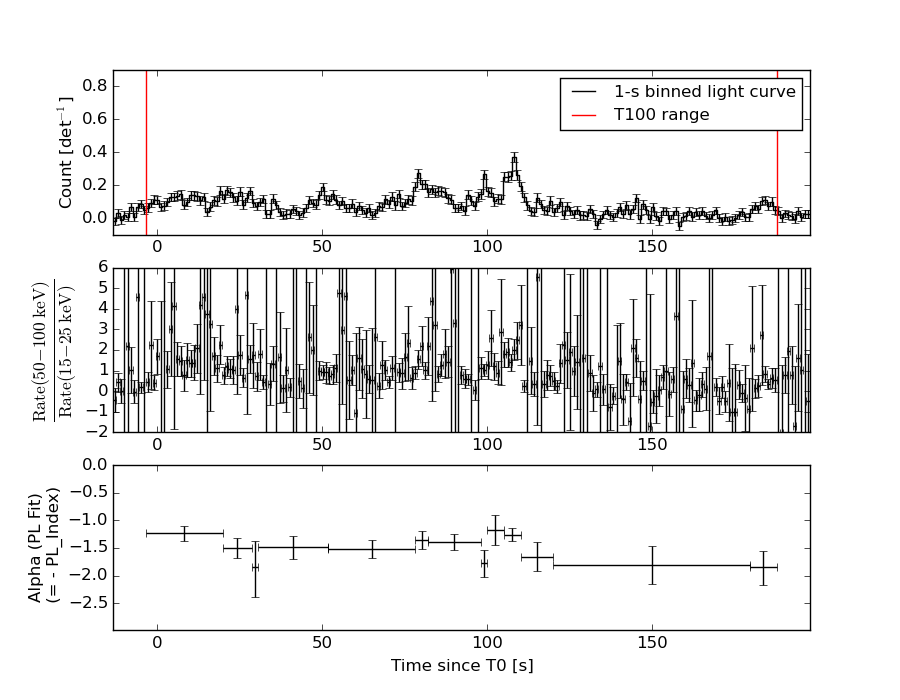
Lightcurves
Notes:
- 1) The mask-weighted light curves are using the flight position.
- 2) Multiple plots of different time binning/intervals are shown to cover all scenarios of short/long GRBs, rate/image triggers, and real/false positives.
- 3) For all the mask-weighted lightcurves, the y-axis units are counts/sec/det where a det is 0.4 x 0.4 = 0.16 sq cm.
- 4) The verticle lines correspond to following: green dotted lines are T50 interval, black dotted lines are T90 interval, blue solid line(s) is a spacecraft slew start time, and orange solid line(s) is a spacecraft slew end time.
- 5) Time of each bin is in the middle of the bin.
1 s binning
From T0-310 s to T0+310 s
From T100_start - 20 s to T100_end + 30 s
Full time interval
64 ms binning
Full time interval
From T100_start to T100_end
From T0-5 sec to T0+5 sec
16 ms binning
From T100_start-5 s to T100_start+5 s
8 ms binning
From T100_start-3 s to T100_start+3 s
2 ms binning
From T100_start-1 s to T100_start+1 s
SN=5 or 10 sec. binning (whichever binning is satisfied first)
SN=5 or 10 sec. binning (T < 200 sec)
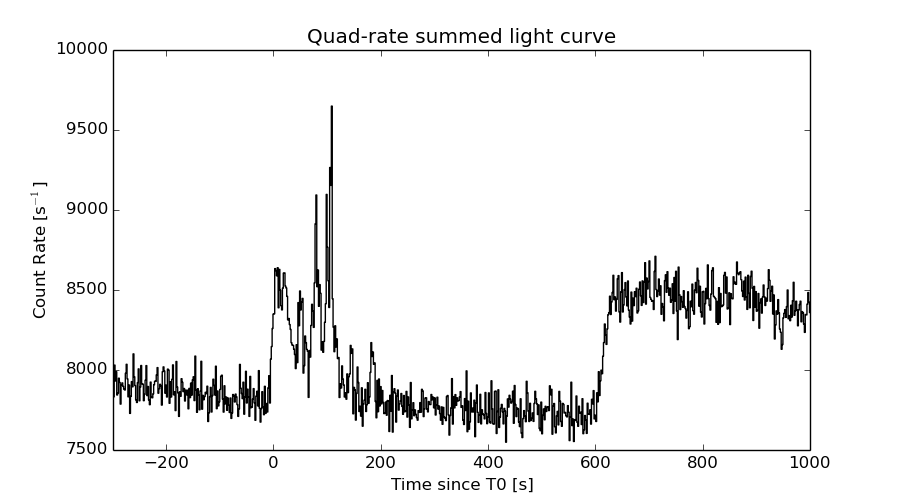
Quad-rate summed light curves (from T0-300s to T0+1000s)
Spectral Evolution
Spectra
Notes:
- 1) The fitting includes the systematic errors.
- 2) When the burst includes telescope slew time periods, the fitting uses an average response file made from multiple 5-s response files through out the slew time plus single time preiod for the non-slew times, and weighted by the total counts in the corresponding time period using addrmf. An average response file is needed becuase a spectral fit using the pre-slew DRM will introduce some errors in both a spectral shape and a normalization if the PHA file contains a lot of the slew/post-slew time interval.
- 3) For fits to more complicated models (e.g. a power-law over a cutoff power-law), the BAT team has decided to require a chi-square improvement of more than 6 for each extra dof.
Time averaged spectrum fit using the average DRM
Power-law model

Time interval is from   -3.420 sec. to  187.800 sec.

Spectral model in power-law:
------------------------------------------------------------
Parameters  : value       lower 90%   higher 90%
Photon index: 1.46657     ( -0.0653735   0.0651493 )
Norm@50keV  : 6.34006E-03    ( -0.000235475   0.000235362 )
------------------------------------------------------------
#Fit statistic : Chi-Squared =          58.09 using 59 PHA bins.
# Reduced chi-squared =          1.019 for     57 degrees of freedom
# Null hypothesis probability =   4.348099e-01

Photon flux (15-150 keV)    in 191.2 sec: 0.784589 ( -0.0331811  0.0333237 ) ph/cm2/s
Energy fluence (15-150 keV)             : 1.15654e-05 ( -4.3481e-07  4.35001e-07 ) ergs/cm2
Cutoff power-law model

Time interval is from   -3.420 sec. to  187.800 sec.
Spectral model in the cutoff power-law:
------------------------------------------------------------
Parameters  : value       lower 90%   higher 90%
Photon index: 1.08701     ( -0.281111   0.265002 )
Epeak [keV] : 140.509      ( -36.0118 173.394 )
Norm@50keV  : 9.28516E-03    ( -0.00212199   0.00291751 )
------------------------------------------------------------
#Fit statistic : Chi-Squared =          51.99 using 59 PHA bins.
# Reduced chi-squared =         0.9284 for     56 degrees of freedom
# Null hypothesis probability =   6.273298e-01

Photon flux (15-150 keV)    in 191.2 sec: 0.764847 ( -0.035513  0.035711 ) ph/cm2/s
Energy fluence (15-150 keV)             : 1.14079e-05 ( -4.52915e-07  4.51672e-07 ) ergs/cm2
Band function

Time interval is from   -3.420 sec. to  187.800 sec.

Spectral model in the Band function:
------------------------------------------------------------
Parameters  : value       lower 90%   higher 90%
alpha       : -1.08698   ( -0.229995   0.318169 )
beta        : -10.0000    ( 10   20 )
Epeak [keV] : 140.482      ( -31.8288 173.312 )
Norm@50keV   : 9.28447E-03    ( -0.00212183   0.00291804 )
------------------------------------------------------------
#Fit statistic : Chi-Squared =          51.99 using 59 PHA bins.
# Reduced chi-squared =         0.9453 for     55 degrees of freedom
# Null hypothesis probability =   5.903103e-01

Photon flux (15-150 keV)    in 191.2 sec: 0.765342 (    ) ph/cm2/s
Energy fluence (15-150 keV)             : 0 ( 0  0 ) ergs/cm2
Single BB
Spectral model blackbody:
------------------------------------------------------------
Parameters  : value    Lower 90%  Upper 90%
kT [keV]    : 18.6200  (  )
R^2/D10^2   : 4.19630E-02  (   )
(R is the radius in km and D10 is the distance to the source in units of 10 kpc)
------------------------------------------------------------
#Fit statistic : Chi-Squared =         188.06 using 59 PHA bins.
# Reduced chi-squared =         3.2993 for     57 degrees of freedom
# Null hypothesis probability =   6.560068e-16

Energy  Fluence     90% Error
[keV]   [erg/cm2]   [erg/cm2]
15- 25  5.507e-07   4.082e-08
25- 50  2.611e-06   1.472e-07
50-150  6.625e-06   3.728e-07
15-150  9.786e-06   4.015e-07
Thermal bremsstrahlung (OTTB)
Spectral model: thermal bremsstrahlung
------------------------------------------------------------
Parameters  : value         Lower 90%    Upper 90%
kT [keV]    : 200.000       (      )
Norm        : 3.28484       (-0.121372     0.12135)
------------------------------------------------------------
#Fit statistic : Chi-Squared =          63.83 using 59 PHA bins.
# Reduced chi-squared =          1.120 for     57 degrees of freedom
# Null hypothesis probability =   2.489737e-01

Energy  Fluence     90% Error
[keV]   [erg/cm2]   [erg/cm2]
15- 25  1.564e-06   6.740e-08
25- 50  3.009e-06   1.329e-07
50-150  6.600e-06   2.830e-07
15-150  1.117e-05   4.799e-07
Double BB
Spectral model: bbodyrad<1> + bbodyrad<2>
------------------------------------------------------------
Parameters  : value         Lower 90%    Upper 90%
kT1 [keV]   : 6.80174        (-0.995275      1.13642)
R1^2/D10^2  : 0.792785        (-0.333791      0.653798)
kT2 [keV]   : 26.0020        (-2.2758      3.01341)
R2^2/D10^2  : 1.10753E-02    (-0.00373888   0.0046076)
------------------------------------------------------------
#Fit statistic : Chi-Squared =          51.57 using 59 PHA bins.
# Reduced chi-squared =         0.9376 for     55 degrees of freedom
# Null hypothesis probability =   6.065085e-01

Energy  Fluence     90% Error
[keV]   [erg/cm2]   [erg/cm2]
15- 25  1.336e-06   2.324e-07
25- 50  2.823e-06   2.572e-07
50-150  7.227e-06   6.080e-07
15-150  1.139e-05   8.833e-07
Peak spectrum fit
Power-law model
Time interval is from  107.852 sec. to  108.852 sec.

Spectral model in power-law:
------------------------------------------------------------
Parameters  : value       lower 90%   higher 90%
Photon index: 1.19431     ( -0.211488   0.206099 )
Norm@50keV  : 2.99622E-02    ( -0.00375427   0.00373633 )
------------------------------------------------------------
#Fit statistic : Chi-Squared =          52.09 using 59 PHA bins.
# Reduced chi-squared =         0.9139 for     57 degrees of freedom
# Null hypothesis probability =   6.592724e-01

Photon flux (15-150 keV)    in 1 sec: 3.51414 ( -0.467659  0.470985 ) ph/cm2/s
Energy fluence (15-150 keV)             : 3.04468e-07 ( -3.86579e-08  3.87404e-08 ) ergs/cm2
Cutoff power-law model

Time interval is from  107.852 sec. to  108.852 sec.
Spectral model in the cutoff power-law:
------------------------------------------------------------
Parameters  : value       lower 90%   higher 90%
Photon index: 0.651353     ( -1.03482   0.64023 )
Epeak [keV] : 147.577      (   )
Norm@50keV  : 5.14582E-02    (     )
------------------------------------------------------------
#Fit statistic : Chi-Squared =          50.93 using 59 PHA bins.
# Reduced chi-squared =         0.9094 for     56 degrees of freedom
# Null hypothesis probability =   6.668311e-01

Photon flux (15-150 keV)    in 1 sec: 3.43297 ( -0.4836  0.48702 ) ph/cm2/s
Energy fluence (15-150 keV)             : 3.00467e-07 ( -4.0168e-08  3.9755e-08 ) ergs/cm2
Band function

Time interval is from  107.852 sec. to  108.852 sec.

Spectral model in the Band function:
------------------------------------------------------------
Parameters  : value       lower 90%   higher 90%
alpha       : -0.469278   ( 0.606514   2.13311 )
beta        : -1.48982    ( 1.71507   0.678307 )
Epeak [keV] : 112.583      ( -110.825 1990.83 )
Norm@50keV   : 6.50970E-02    ( -0.0388486   1.78668e+06 )
------------------------------------------------------------
#Fit statistic : Chi-Squared =          50.87 using 59 PHA bins.
# Reduced chi-squared =         0.9248 for     55 degrees of freedom
# Null hypothesis probability =   6.332239e-01

Photon flux (15-150 keV)    in 1 sec:  (    ) ph/cm2/s
Energy fluence (15-150 keV)             : 0 ( 0  0 ) ergs/cm2
Single BB
Spectral model blackbody:
------------------------------------------------------------
Parameters  : value    Lower 90%  Upper 90%
kT [keV]    : 20.8259  (-2.91504  3.58439)
R^2/D10^2   : 0.145197  (-0.0598602   0.0956727)
(R is the radius in km and D10 is the distance to the source in units of 10 kpc)
------------------------------------------------------------
#Fit statistic : Chi-Squared =          59.49 using 59 PHA bins.
# Reduced chi-squared =          1.044 for     57 degrees of freedom
# Null hypothesis probability =   3.850743e-01

Energy  Fluence     90% Error
[keV]   [erg/cm2]   [erg/cm2]
15- 25  1.194e-08   3.052e-09
25- 50  6.105e-08   1.182e-08
50-150  1.972e-07   3.955e-08
15-150  2.702e-07   4.340e-08
Thermal bremsstrahlung (OTTB)
Spectral model: thermal bremsstrahlung
------------------------------------------------------------
Parameters  : value         Lower 90%    Upper 90%
kT [keV]    : 200.000       (      )
Norm        : 15.0900       (-1.89388     1.89354)
------------------------------------------------------------
#Fit statistic : Chi-Squared =          60.59 using 59 PHA bins.
# Reduced chi-squared =          1.063 for     57 degrees of freedom
# Null hypothesis probability =   3.475436e-01

Energy  Fluence     90% Error
[keV]   [erg/cm2]   [erg/cm2]
15- 25  3.759e-08   2.121e-08
25- 50  7.231e-08   4.037e-08
50-150  1.586e-07   8.890e-08
15-150  2.685e-07   1.472e-07
Double BB
Spectral model: bbodyrad<1> + bbodyrad<2>
------------------------------------------------------------
Parameters  : value         Lower 90%    Upper 90%
kT1 [keV]   : 8.71988        (-5.25942      8.54197)
R1^2/D10^2  : 1.23383        (-0.988096      36.8369)
kT2 [keV]   : 30.1450        (-9.27103      -30.3654)
R2^2/D10^2  : 3.52624E-02    (-0.0336357   0.0978474)
------------------------------------------------------------
#Fit statistic : Chi-Squared =          51.56 using 59 PHA bins.
# Reduced chi-squared =         0.9374 for     55 degrees of freedom
# Null hypothesis probability =   6.069461e-01

Energy  Fluence     90% Error
[keV]   [erg/cm2]   [erg/cm2]
15- 25  2.295e-08   1.310e-08
25- 50  6.719e-08   3.589e-08
50-150  2.105e-07   1.109e-07
15-150  3.006e-07   1.524e-07
Pre-slew spectrum (Pre-slew PHA with pre-slew DRM)
Power-law model

Spectral model in power-law:
------------------------------------------------------------
Parameters  : value       lower 90%   higher 90%
Photon index: 1.46657     ( -0.0653735   0.0651493 )
Norm@50keV  : 6.34006E-03    ( -0.000235475   0.000235362 )
------------------------------------------------------------
#Fit statistic : Chi-Squared =          58.09 using 59 PHA bins.
# Reduced chi-squared =          1.019 for     57 degrees of freedom
# Null hypothesis probability =   4.348099e-01

Photon flux (15-150 keV)    in 191.2 sec: 0.784589 ( -0.0331811  0.0333237 ) ph/cm2/s
Energy fluence (15-150 keV)             : 1.15654e-05 ( -4.3481e-07  4.35001e-07 ) ergs/cm2
Cutoff power-law model

Spectral model in the cutoff power-law:
------------------------------------------------------------
Parameters  : value       lower 90%   higher 90%
Photon index: 1.08701     ( -0.281111   0.265002 )
Epeak [keV] : 140.509      ( -36.0118 173.394 )
Norm@50keV  : 9.28516E-03    ( -0.00212199   0.00291751 )
------------------------------------------------------------
#Fit statistic : Chi-Squared =          51.99 using 59 PHA bins.
# Reduced chi-squared =         0.9284 for     56 degrees of freedom
# Null hypothesis probability =   6.273298e-01

Photon flux (15-150 keV)    in 191.2 sec: 0.764847 ( -0.035513  0.035711 ) ph/cm2/s
Energy fluence (15-150 keV)             : 1.14079e-05 ( -4.52915e-07  4.51672e-07 ) ergs/cm2
Band function
Spectral model in the Band function:
------------------------------------------------------------
Parameters  : value       lower 90%   higher 90%
alpha       : -1.08698   ( -0.22997   0.318215 )
beta        : -10.0000    ( 10   3.19744e-14 )
Epeak [keV] : 140.482      ( -31.8352 173.312 )
Norm@50keV   : 9.28447E-03    ( -0.00212182   0.00291805 )
------------------------------------------------------------
#Fit statistic : Chi-Squared =          51.99 using 59 PHA bins.
# Reduced chi-squared =         0.9453 for     55 degrees of freedom
# Null hypothesis probability =   5.903103e-01

Photon flux (15-150 keV)    in 191.2 sec: 0.765342 (    ) ph/cm2/s
Energy fluence (15-150 keV)             : 0 ( 0  0 ) ergs/cm2
S(25-50 keV) vs. S(50-100 keV) plot
S(25-50 keV)  = 2.81e-06
S(50-100 keV) = 4.07e-06
T90 vs. Hardness ratio plot
T90                                   = 158.524000003934 sec.
Hardness ratio (energy fluence ratio) = 1.4484
Color vs. Color plot
Count Ratio  (25-50 keV) / (15-25 keV) = 1.54262
Count Ratio (50-100 keV) / (15-25 keV) = 1.45073
Mask shadow pattern
IMX = 1.047522639628722E+00, IMY = 6.303208238792297E-01
TIME vs. PHA plot around the trigger time
TIME vs. DetID plot around the trigger time
100 us light curve (15-350 keV)
Spacecraft aspect plot

Bright source in the pre-burst/pre-slew/post-slew images
Pre-burst image of 15-350 keV band
Time interval of the image:
-299.296000 -3.420000

# RAcent  DECcent POSerr Theta    Phi  PeakCts   SNR AngSep     Name
#  [deg]    [deg]    ['] [deg]  [deg]                   [']
244.9951 -15.6469    0.7  50.8   17.3  10.3449  16.5    1.0	Sco X-1
254.4220  35.3270    1.1   1.1  174.4   1.6901  10.3    2.0	Her X-1
268.4910  -1.4284    7.8  38.0  -17.6   0.3194   1.5    7.5	SW J1753.5-0127
273.9751 -14.1657   21.6  51.8  -18.8  -0.2468  -0.5    8.0	GX 17+2
288.7799  10.9622    1.0  38.9  -56.1   4.3302  11.7    1.5	GRS 1915+105
299.5583  35.2086    0.4  36.6  -99.4  12.2648  26.8    1.6	Cyg X-1
308.2202  40.9279    3.3  42.3 -110.1   2.4301   3.4    5.2	Cyg X-3
263.6056 -14.6629    3.2  49.7   -6.1   1.4235   3.6 ------	UNKNOWN
 47.4903  88.3354    3.6  57.2 -173.9   2.9002   3.2 ------	UNKNOWN
296.2341  13.1254    2.7  43.1  -65.7   3.2493   4.3 ------	UNKNOWN
Pre-slew background subtracted image of 15-350 keV band
Time interval of the image:
-3.420000 187.800000

# RAcent  DECcent POSerr Theta    Phi  PeakCts   SNR AngSep     Name
#  [deg]    [deg]    ['] [deg]  [deg]                   [']
244.9719 -15.7863    5.7  50.9   17.3   1.1624   2.0    8.8	Sco X-1
254.2951  35.1989   82.9   1.0  164.0   0.0199   0.1   11.7	Her X-1
268.4972  -1.3212   16.4  37.9  -17.6  -0.1491  -0.7   11.1	SW J1753.5-0127
273.8778 -14.1867    7.2  51.8  -18.7   0.7793   1.6   11.7	GX 17+2
288.7774  10.9444    7.0  38.8  -56.1   0.6385   1.6    1.2	GRS 1915+105
299.7462  35.1142    2.6  36.7  -99.3  -1.8229  -4.4    9.3	Cyg X-1
308.1565  40.8254   53.2  42.2 -110.0   0.1575   0.2    7.9	Cyg X-3
247.0871 -14.6419    2.0  49.5   14.9   2.5338   5.7 ------	UNKNOWN
246.3912  20.7708    2.1  15.4   35.8   0.8447   5.5 ------	UNKNOWN
  6.5102  82.0764    3.0  58.9 -166.2   3.4878   3.8 ------	UNKNOWN
282.3127  -9.1508    0.4  50.7  -31.0  16.3194  30.5 ------	UNKNOWN
Post-slew image of 15-350 keV band
Time interval of the image:
-299.296000 302.784300

# RAcent  DECcent POSerr Theta    Phi  PeakCts   SNR AngSep     Name
#  [deg]    [deg]    ['] [deg]  [deg]                   [']
244.9883 -15.6289    0.6  50.8   17.3  19.3357  18.7    0.9	Sco X-1
254.4688  35.3501    1.0   1.1  174.1   3.2909  11.4    0.7	Her X-1
268.3822  -1.4503   22.5  38.0  -17.4   0.1916   0.5    0.9	SW J1753.5-0127
274.0208 -14.1118   29.9  51.8  -18.9  -0.3356  -0.4    4.6	GX 17+2
288.8069  10.9490    0.8  38.9  -56.1   9.3170  14.6    0.5	GRS 1915+105
299.5951  35.1950    0.4  36.6  -99.4  23.8425  26.8    0.5	Cyg X-1
308.2313  40.9000    3.3  42.2 -110.1   4.6805   3.5    6.3	Cyg X-3
265.6164   5.3660    3.3  30.6  -16.5   1.1179   3.5 ------	UNKNOWN
347.4339  76.0185    2.8  57.5 -158.2   6.5130   4.1 ------	UNKNOWN
282.3242  -9.1562    0.6  50.7  -31.0  18.4820  20.7 ------	UNKNOWN
Plot creation:
Sun May 31 17:24:49 EDT 2015