Estimated redshift from machine learning (Ukwatta et al. 2016) - may take a few minutes to calcaulte
Image
Pre-slew 15-350 keV image (Event data; bkg subtracted)

#   RAcent  DECcent POSerr  Theta    Phi     Peak Cts     SNR  Name
  287.0099 +29.8122 0.0582   46.6   -8.3       0.0182     3.3  TRIG_01078701
------------------------------------------

Foreground time interval of the image:
  0.000   0.064 (delta_t =   0.064 [sec])
Background time interval of the image:
-60.904  -7.904 (delta_t =  53.000 [sec])
Lightcurves
Notes:
- 1) All plots contain as much data as has been downloaded to date.
- 2) The mask-weighted light curves are using the flight position.
- 3) Multiple plots of different time binning/intervals are shown to cover all scenarios of short/long GRBs, rate/image triggers, and real/false positives.
- 4) For all the mask-weighted lightcurves, the y-axis units are counts/sec/det where a det is 0.4 x 0.4 = 0.16 sq cm.
- 5) The verticle lines correspond to following: green dotted lines are T50 interval, black dotted lines are T90 interval, blue solid line(s) is a spacecraft slew start time, and orange solid line(s) is a spacecraft slew end time.
- 6) Time of each bin is in the middle of the bin.
1 s binning
From T0-310 s to T0+310 s

From T100_start - 20 s to T100_end + 30 s

Full time interval

64 ms binning
Full time interval

From T100_start to T100_end

From T0-5 sec to T0+5 sec

16 ms binning
From T100_start-5 s to T100_start+5 s

Blue+Cyan dotted lines: Time interval of the scaled map
From 0.000000 to 0.064000
8 ms binning
From T100_start-3 s to T100_start+3 s

Blue+Cyan dotted lines: Time interval of the scaled map
From 0.000000 to 0.064000
2 ms binning
From T100_start-1 s to T100_start+1 s

Blue+Cyan dotted lines: Time interval of the scaled map
From 0.000000 to 0.064000
SN=5 or 10 sec. binning (whichever binning is satisfied first)

SN=5 or 10 sec. binning (T < 200 sec)

Spectra
Notes:
- 1) The fitting includes the systematic errors.
- 2) For long bursts, a spectral fit of the pre-slew DRM will introduce some errors in both a spectral shape and a normalization if the PHA file contains a lot of the slew/post-slew time interval.
- 3) For fits to more complicated models (e.g. a power-law over a cutoff power-law), the BAT team has decided to require a chi-square improvement of more than 6 for each extra dof.
- 4) For short bursts (T90<1sec), the specrtum is also fit with Blackbody, OTTB, and Double Blackbody.
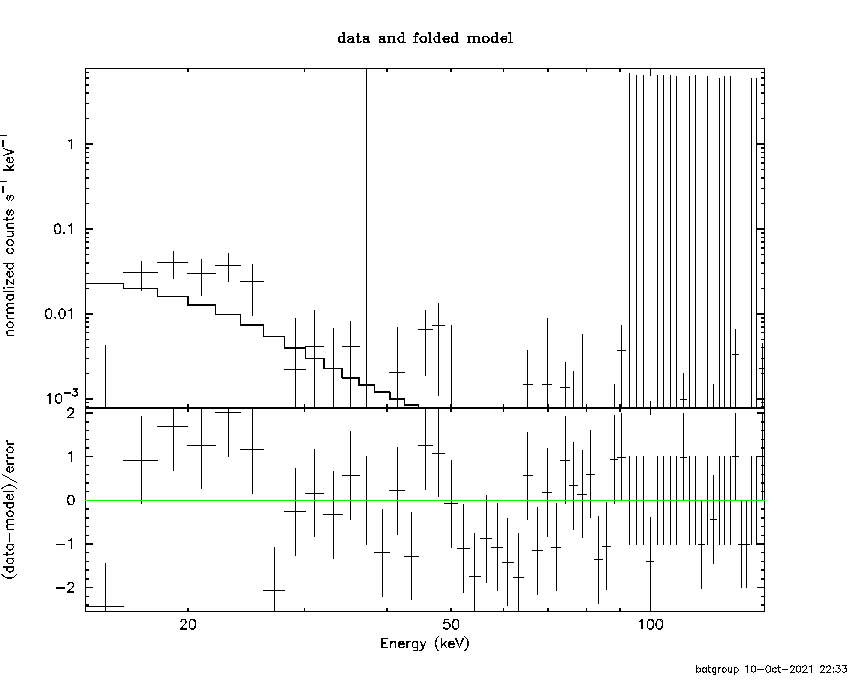
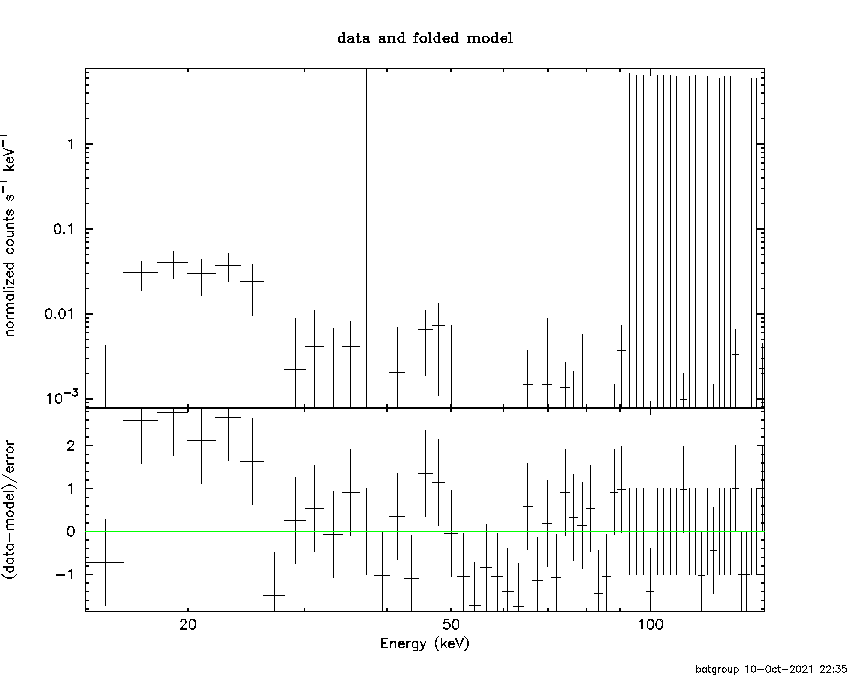
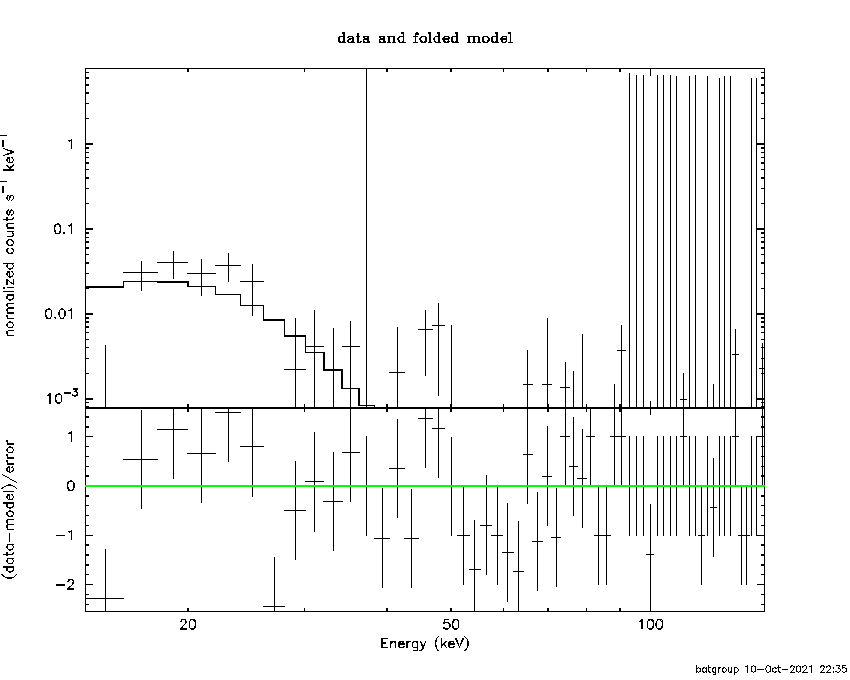
Time averaged spectrum fit using the pre-slew DRM
Power-law model

Time interval is from    0.000 sec. to    0.064 sec.

Spectral model in power-law:
------------------------------------------------------------
Parameters  : value       lower 90%   higher 90%
Photon index: 4.03198     ( -0.903677   1.37517 )
Norm@50keV  : 4.04707E-03    ( -0.00400158   0.00416588 )
------------------------------------------------------------
#Fit statistic : Chi-Squared =          55.75 using 59 PHA bins.
# Reduced chi-squared =         0.9780 for     57 degrees of freedom
# Null hypothesis probability =   5.221094e-01

Photon flux (15-150 keV)    in 0.064 sec: 2.58240 ( -1.28313  1.28089 ) ph/cm2/s
Energy fluence (15-150 keV)             : 5.74659e-09 ( -3.07277e-09  3.08012e-09 ) ergs/cm2
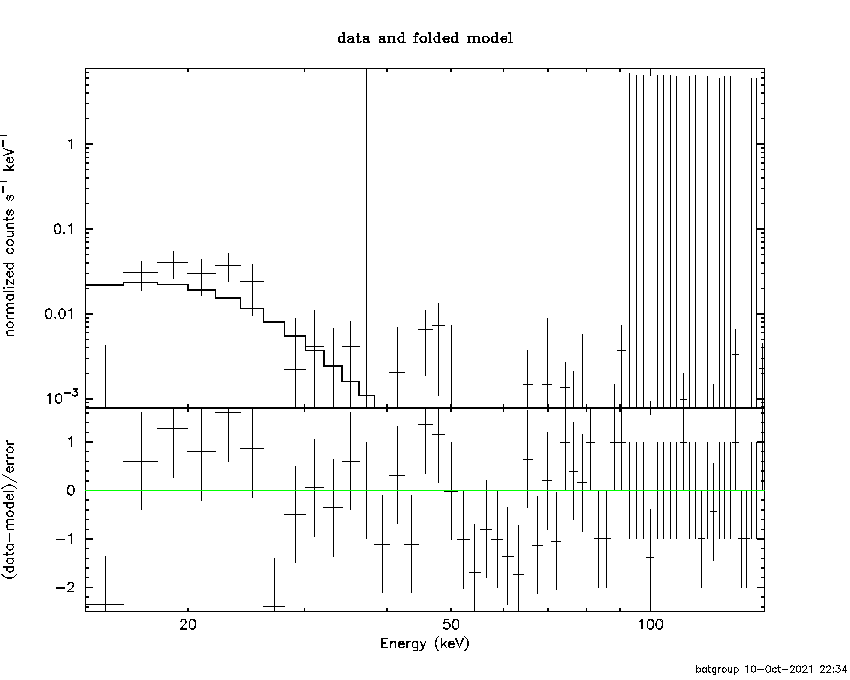
Cutoff power-law model

Time interval is from    0.000 sec. to    0.064 sec.
Spectral model in the cutoff power-law:
------------------------------------------------------------
Parameters  : value       lower 90%   higher 90%
Photon index: 1.00000     (     )
Epeak [keV] : 50.0000      (   )
Norm@50keV  : 5.04931E-03    (     )
------------------------------------------------------------
#Fit statistic : Chi-Squared =          66.26 using 59 PHA bins.
# Reduced chi-squared =          1.183 for     56 degrees of freedom
# Null hypothesis probability =   1.639724e-01

Photon flux (15-150 keV)    in 0.064 sec: 3.53415 3.55136 (    ) ph/cm2/s
Energy fluence (15-150 keV)             : 1.32786e-14 ( 0  0 ) ergs/cm2
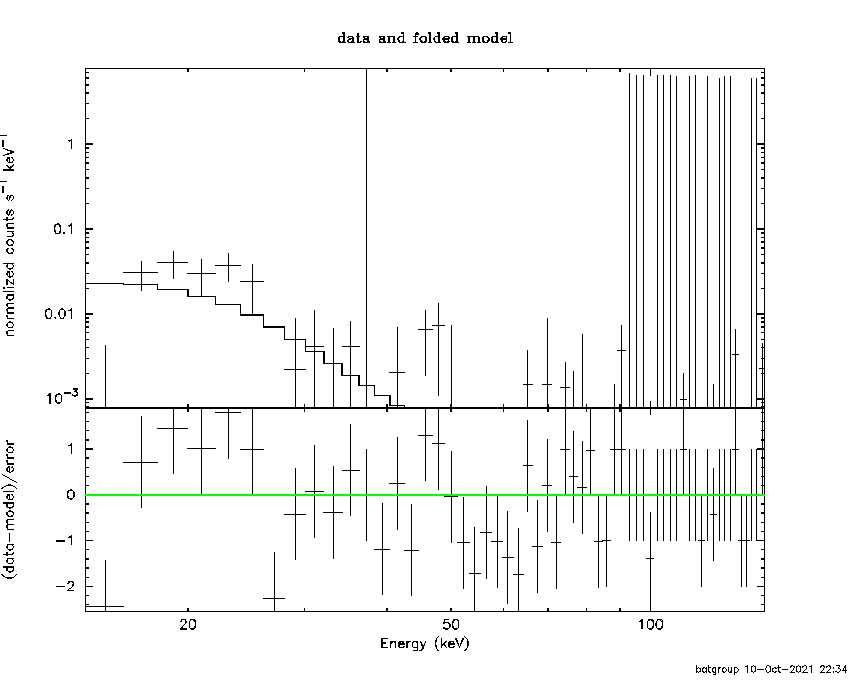
Band function

Time interval is from    0.000 sec. to    0.064 sec.

Spectral model in the Band function:
------------------------------------------------------------
Parameters  : value       lower 90%   higher 90%
alpha       : 4.32162   ( 1.24546   1.24546 )
beta        : -10.0000    ( 10   10 )
Epeak [keV] : 17.3270      ( -3.4072 4.11025 )
Norm@50keV   : 2.10669E+04    ( -20902.7   97003 )
------------------------------------------------------------
#Fit statistic : Chi-Squared =          49.98 using 59 PHA bins.
# Reduced chi-squared =         0.9087 for     55 degrees of freedom
# Null hypothesis probability =   6.664903e-01

Photon flux (15-150 keV)    in 0.064 sec:  (    ) ph/cm2/s
Energy fluence (15-150 keV)             : 0 ( 0  0 ) ergs/cm2
Single BB

Spectral model blackbody:
------------------------------------------------------------
Parameters  : value    Lower 90%  Upper 90%
kT [keV]    : 3.88196  (-0.995464  1.27619)
R^2/D10^2   : 101.495  (-100.662   389.692)
(R is the radius in km and D10 is the distance to the source in units of 10 kpc)
------------------------------------------------------------
#Fit statistic : Chi-Squared =          51.16 using 59 PHA bins.
# Reduced chi-squared =         0.8975 for     57 degrees of freedom
# Null hypothesis probability =   6.928180e-01

Energy  Fluence     90% Error
[keV]   [erg/cm2]   [erg/cm2]
15- 25  5.100e-09   3.222e-09
25- 50  1.689e-09   1.235e-09
50-150  1.709e-11   2.325e-11
15-150  6.806e-09   4.272e-09
Thermal bremsstrahlung (OTTB)

XSPEC12>exit
 XSPEC: quit


Spectral model: thermal bremsstrahlung
------------------------------------------------------------
Parameters  : value         Lower 90%    Upper 90%
kT [keV]    : 9.29400       (-3.77125      7.49352)
Norm        : 120.651       (-122.171     344.891)
------------------------------------------------------------
 Reduced chi-squared =

Energy  Fluence     90% Error
[keV]   [erg/cm2]   [erg/cm2]
15- 25  4.543e-09   2.942e-09
25- 50  1.768e-09   1.234e-09
50-150  9.875e-11   1.132e-10
15-150  6.410e-09   4.230e-09
Double BB

XSPEC12>exit
 XSPEC: quit


Spectral model: bbodyrad<1> + bbodyrad<2>
------------------------------------------------------------
Parameters  : value         Lower 90%    Upper 90%
kT1 [keV]   : 3.89746        (-0.98819      1.28281)
R1^2/D10^2  : 99.5149        (-99.8692      390.752)
kT2 [keV]   : 4.15335E-02        (-0.0415335      -0.0415335)
R2^2/D10^2  : 7.00358E-02    (-0.0700403   -0.0700403)
------------------------------------------------------------
 Reduced chi-squared =

Energy  Fluence     90% Error
[keV]   [erg/cm2]   [erg/cm2]
15- 25  0.000e+00   0.000e+00
25- 50  0.000e+00   0.000e+00
50-150  0.000e+00   0.000e+00
15-150  0.000e+00   0.000e+00
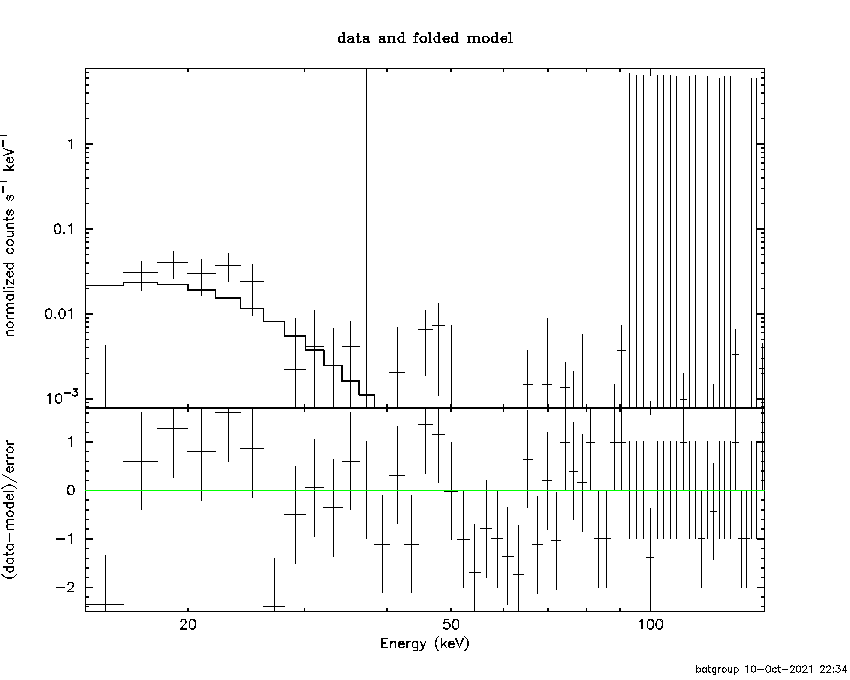
Peak spectrum fit
Power-law model
Time interval is from    0.000 sec. to    0.064 sec.

Spectral model in power-law:
------------------------------------------------------------
Parameters  : value       lower 90%   higher 90%
Photon index: 4.03198     ( -0.903677   1.37517 )
Norm@50keV  : 4.04707E-03    ( -0.00400158   0.00416588 )
------------------------------------------------------------
#Fit statistic : Chi-Squared =          55.75 using 59 PHA bins.
# Reduced chi-squared =         0.9780 for     57 degrees of freedom
# Null hypothesis probability =   5.221094e-01

Photon flux (15-150 keV)    in 0.064 sec: 2.58240 ( -1.28313  1.28089 ) ph/cm2/s
Energy fluence (15-150 keV)             : 5.74659e-09 ( -3.07277e-09  3.08012e-09 ) ergs/cm2
Cutoff power-law model

Time interval is from    0.000 sec. to    0.064 sec.
Spectral model in the cutoff power-law:
------------------------------------------------------------
Parameters  : value       lower 90%   higher 90%
Photon index: 1.00000     (     )
Epeak [keV] : 50.0000      (   )
Norm@50keV  : 5.04931E-03    (     )
------------------------------------------------------------
#Fit statistic : Chi-Squared =          66.26 using 59 PHA bins.
# Reduced chi-squared =          1.183 for     56 degrees of freedom
# Null hypothesis probability =   1.639724e-01

Photon flux (15-150 keV)    in 0.064 sec: 3.53415 3.55136 (    ) ph/cm2/s
Energy fluence (15-150 keV)             : 1.32786e-14 ( 0  0 ) ergs/cm2
Band function

Time interval is from    0.000 sec. to    0.064 sec.

Spectral model in the Band function:
------------------------------------------------------------
Parameters  : value       lower 90%   higher 90%
alpha       : 4.32162   ( 1.24546   1.24546 )
beta        : -10.0000    ( 10   10 )
Epeak [keV] : 17.3270      ( -3.4072 4.11025 )
Norm@50keV   : 2.10669E+04    ( -20902.7   97003 )
------------------------------------------------------------
#Fit statistic : Chi-Squared =          49.98 using 59 PHA bins.
# Reduced chi-squared =         0.9087 for     55 degrees of freedom
# Null hypothesis probability =   6.664903e-01

Photon flux (15-150 keV)    in 0.064 sec:  (    ) ph/cm2/s
Energy fluence (15-150 keV)             : 0 ( 0  0 ) ergs/cm2
Single BB
 XSPEC: quit


Spectral model blackbody:
------------------------------------------------------------
Parameters  : value    Lower 90%  Upper 90%
kT [keV]    : 3.88196  (-0.995464  1.27619)
R^2/D10^2   : 101.495  (-100.662   389.692)
(R is the radius in km and D10 is the distance to the source in units of 10 kpc)
------------------------------------------------------------
 Reduced chi-squared =

Energy  Fluence     90% Error
[keV]   [erg/cm2]   [erg/cm2]
15- 25  5.100e-09   3.148e-09
25- 50  1.689e-09   1.193e-09
50-150  1.709e-11   2.158e-11
15-150  6.806e-09   4.288e-09
Thermal bremsstrahlung (OTTB)
XSPEC12>exit
 XSPEC: quit


Spectral model: thermal bremsstrahlung
------------------------------------------------------------
Parameters  : value         Lower 90%    Upper 90%
kT [keV]    : 9.29400       (-3.77125      7.49352)
Norm        : 120.651       (-122.171     344.891)
------------------------------------------------------------
 Reduced chi-squared =

Energy  Fluence     90% Error
[keV]   [erg/cm2]   [erg/cm2]
15- 25  4.543e-09   2.756e-09
25- 50  1.768e-09   1.247e-09
50-150  9.875e-11   1.168e-10
15-150  6.410e-09   4.064e-09
Double BB
XSPEC12>exit
 XSPEC: quit


Spectral model: bbodyrad<1> + bbodyrad<2>
------------------------------------------------------------
Parameters  : value         Lower 90%    Upper 90%
kT1 [keV]   : 3.89746        (-0.98819      1.28281)
R1^2/D10^2  : 99.5149        (-99.8692      390.752)
kT2 [keV]   : 4.15335E-02        (-0.0415335      -0.0415335)
R2^2/D10^2  : 7.00358E-02    (-0.0700403   -0.0700403)
------------------------------------------------------------
 Reduced chi-squared =

Energy  Fluence     90% Error
[keV]   [erg/cm2]   [erg/cm2]
15- 25  0.000e+00   0.000e+00
25- 50  0.000e+00   0.000e+00
50-150  0.000e+00   0.000e+00
15-150  0.000e+00   0.000e+00
Pre-slew spectrum (Pre-slew PHA with pre-slew DRM)
Power-law model

Spectral model in power-law:
------------------------------------------------------------
Parameters  : value       lower 90%   higher 90%
Photon index: 4.03198     ( -0.903677   1.37517 )
Norm@50keV  : 4.04707E-03    ( -0.00400158   0.00416588 )
------------------------------------------------------------
#Fit statistic : Chi-Squared =          55.75 using 59 PHA bins.
# Reduced chi-squared =         0.9780 for     57 degrees of freedom
# Null hypothesis probability =   5.221094e-01

Photon flux (15-150 keV)    in 0.064 sec: 2.58240 ( -1.28313  1.28089 ) ph/cm2/s
Energy fluence (15-150 keV)             : 5.74659e-09 ( -3.07277e-09  3.08012e-09 ) ergs/cm2
Cutoff power-law model
Spectral model in the cutoff power-law:
------------------------------------------------------------
Parameters  : value       lower 90%   higher 90%
Photon index: 1.00000     (     )
Epeak [keV] : 50.0000      (   )
Norm@50keV  : 5.04931E-03    (     )
------------------------------------------------------------
#Fit statistic : Chi-Squared =          66.26 using 59 PHA bins.
# Reduced chi-squared =          1.183 for     56 degrees of freedom
# Null hypothesis probability =   1.639724e-01

Photon flux (15-150 keV)    in 0.064 sec: 3.53415 3.55136 (    ) ph/cm2/s
Energy fluence (15-150 keV)             : 1.32786e-14 ( 0  0 ) ergs/cm2
Band function
Spectral model in the Band function:
------------------------------------------------------------
Parameters  : value       lower 90%   higher 90%
alpha       : 4.32162   ( 1.24546   1.24546 )
beta        : -10.0000    ( 10   10 )
Epeak [keV] : 17.3270      ( -3.4072 4.11025 )
Norm@50keV   : 2.10669E+04    ( -20902.7   97003 )
------------------------------------------------------------
#Fit statistic : Chi-Squared =          49.98 using 59 PHA bins.
# Reduced chi-squared =         0.9087 for     55 degrees of freedom
# Null hypothesis probability =   6.664903e-01

Photon flux (15-150 keV)    in 0.064 sec:  (    ) ph/cm2/s
Energy fluence (15-150 keV)             : 0 ( 0  0 ) ergs/cm2
S(25-50 keV) vs. S(50-100 keV) plot

S(25-50 keV)  = 1.54e-09
S(50-100 keV) = 3.36e-10
T90 vs. Hardness ratio plot

T90                                   = 0.0640000104904175 sec.
Hardness ratio (energy fluence ratio) = 0.218182
Color vs. Color plot

Count Ratio  (25-50 keV) / (15-25 keV) = 0.13941
Count Ratio (50-100 keV) / (15-25 keV) = -0.361958
Mask shadow pattern

IMX = 1.047853608555413E+00, IMY = 1.519794155521229E-01
TIME vs. PHA plot around the trigger time

Blue+Cyan dotted lines: Time interval of the scaled map
From 0.000000 to 0.064000
TIME vs. DetID plot around the trigger time

Blue+Cyan dotted lines: Time interval of the scaled map
From 0.000000 to 0.064000
100 us light curve (15-350 keV)

Blue+Cyan dotted lines: Time interval of the scaled map
From 0.000000 to 0.064000
Spacecraft aspect plot

Bright source in the pre-burst/pre-slew/post-slew images
Pre-burst image of 15-350 keV band
Time interval of the image:
-60.904000 -7.904000

# RAcent  DECcent POSerr Theta    Phi  PeakCts   SNR AngSep     Name
#  [deg]    [deg]    ['] [deg]  [deg]                   [']
268.5006  -1.3886    7.8  43.2  -59.7   0.4540   1.5    8.8	SW J1753.5-0127
274.1292 -14.1306    5.7  36.1  -78.6   0.3883   2.0    9.1	GX 17+2
275.9485 -30.4522    7.5  38.0 -105.8   0.3630   1.5    5.3	H1820-303
284.9822 -25.0411   48.5  28.5 -102.9  -0.0313  -0.2    7.8	HT1900.1-2455
288.8885  10.9879    4.4  30.9  -25.3   0.2860   2.6    5.9	GRS 1915+105
299.5769  35.2380    1.8  47.2    8.0   1.1508   6.3    2.3	Cyg X-1
308.1193  40.9004   12.6  51.7   18.0   0.2862   0.9    3.2	Cyg X-3
341.1965  16.2508    3.1  40.2   69.1   1.3736   3.8 ------	UNKNOWN
303.2249  44.1330    2.7  55.3   14.0   2.4312   4.3 ------	UNKNOWN
297.3978 -15.1467    2.9  14.0  -89.2   0.3726   4.1 ------	UNKNOWN
277.5253 -51.9946    2.8  49.4 -132.7   1.6764   4.1 ------	UNKNOWN
Pre-slew background subtracted image of 15-350 keV band
Time interval of the image:
0.000000 0.064000

# RAcent  DECcent POSerr Theta    Phi  PeakCts   SNR AngSep     Name
#  [deg]    [deg]    ['] [deg]  [deg]                   [']
268.3290  -1.5913    3.2  43.3  -60.1   0.0394   3.6    8.6	SW J1753.5-0127
274.0797 -14.0991  114.5  36.2  -78.5  -0.0007  -0.1    5.7	GX 17+2
275.8920 -30.4559    4.6  38.1 -105.8  -0.0195  -2.5    5.6	H1820-303
285.1854 -24.8477    5.1  28.3 -102.7   0.0100   2.3    9.2	HT1900.1-2455
288.7639  11.0907   14.0  31.0  -25.3   0.0028   0.8    8.9	GRS 1915+105
299.5602  35.3519    4.4  47.3    8.1   0.0164   2.6    9.1	Cyg X-1
308.1343  40.9698   13.6  51.7   18.0   0.0085   0.8    1.5	Cyg X-3
327.9215 -18.1254    2.3  18.0  137.1   0.0155   5.1 ------	UNKNOWN
321.5877 -57.4333    2.2  47.4 -167.0   0.0320   5.3 ------	UNKNOWN
286.6084  13.1018    2.4  33.9  -25.3   0.0184   4.9 ------	UNKNOWN
Post-slew image of 15-350 keV band
Time interval of the image:
76.396590 235.796600

# RAcent  DECcent POSerr Theta    Phi  PeakCts   SNR AngSep     Name
#  [deg]    [deg]    ['] [deg]  [deg]                   [']
254.3812  35.3247    5.1  28.0  -64.5   0.6267   2.2    3.9	Her X-1
268.4013  -1.5042    6.9  36.1 -141.5   0.4655   1.7    3.7	SW J1753.5-0127
270.3122 -24.9456    6.1  57.1 -156.3   2.1266   2.0    8.2	GX 5-1
270.3842 -25.6976    5.9  57.8 -156.6   2.4325   1.9    5.2	GRS 1758-258
273.9621 -14.0782    6.0  45.7 -156.5   0.6807   1.9    3.6	GX 17+2
284.9454 -24.8875    5.7  54.8 -172.0  -1.4099  -2.0    5.3	HT1900.1-2455
288.7989  10.9706    3.3  18.9 -179.6   0.6683   3.5    1.5	GRS 1915+105
299.6009  35.2055    0.5  11.8   65.3   4.9697  25.5    0.6	Cyg X-1
307.9835  41.0341    5.2  20.3   56.4  -0.5027  -2.2    7.5	Cyg X-3
326.0620  38.2482    3.2  33.1   70.3   1.3997   3.6    6.8	Cyg X-2
308.0646  37.6336    1.4  19.1   65.8   1.8977   8.1 ------	UNKNOWN
304.3886   8.2489    2.3  27.0  145.2   1.1246   5.1 ------	UNKNOWN
299.6199  -7.6574    2.6  39.4  165.8   1.3755   4.5 ------	UNKNOWN
212.4734  81.7167    3.1  58.3   -3.8   4.5128   3.7 ------	UNKNOWN
267.7761  50.2063    2.8  25.0  -24.5   0.8644   4.1 ------	UNKNOWN
215.5079  72.6937    2.6  56.2  -14.3   3.2055   4.4 ------	UNKNOWN
Plot creation:
Sun Oct 10 22:36:07 EDT 2021