Estimated redshift from machine learning (Ukwatta et al. 2016) - may take a few minute to calcaulte
Image
Pre-slew 15.0-350.0 keV image (Event data)
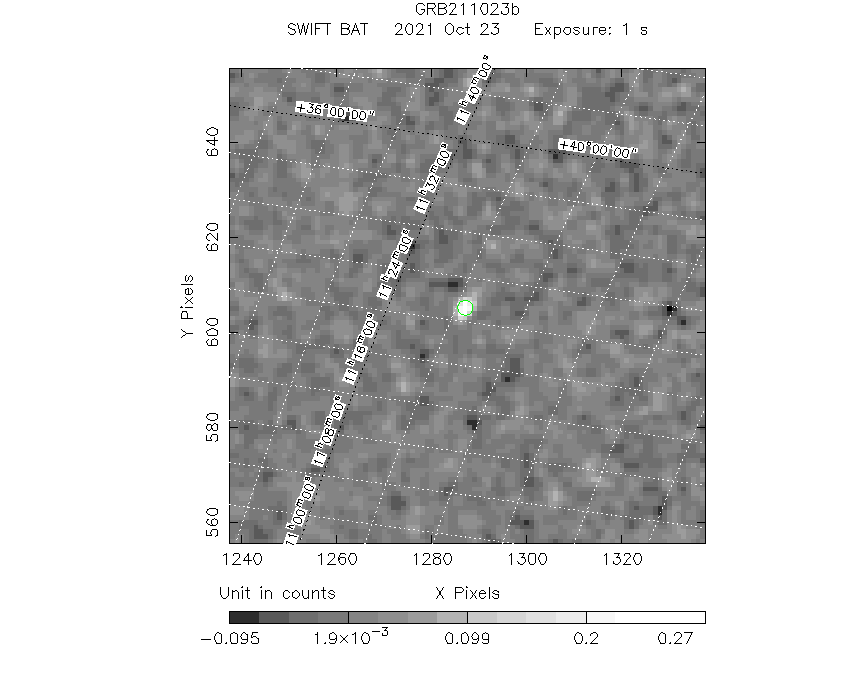
#   RAcent    DECcent   POSerr    Theta     Phi              Peak Cts       SNR   Name
  170.3186    39.1343   0.0163    41.9099  -162.4949         0.2943256     11.784 TRIG_01080859

Foreground time interval of the image:
 -0.012   1.452 (delta_t =   1.464 [sec])
Background time interval of the image:
-239.096  -0.012 (delta_t = 239.084 [sec])
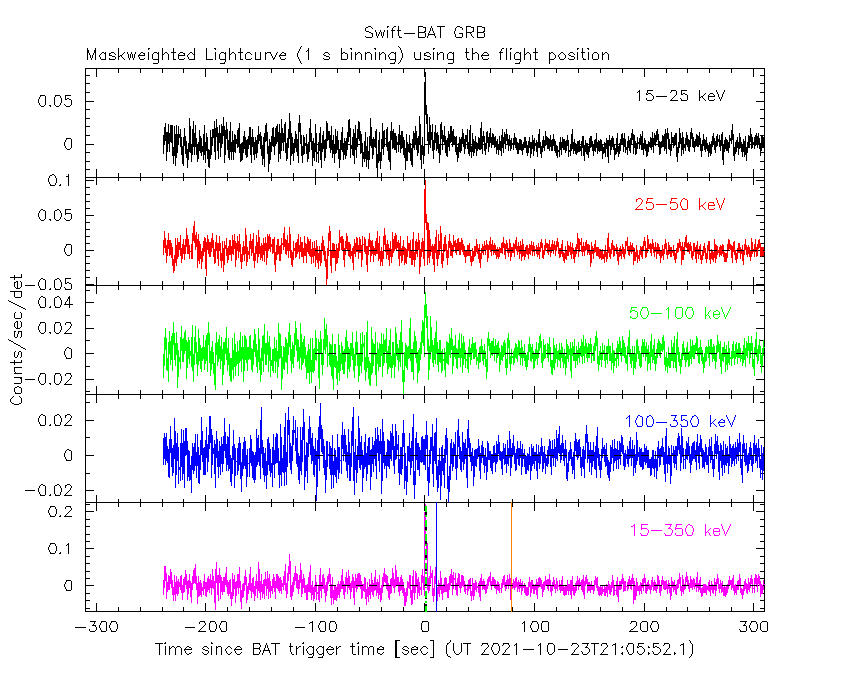
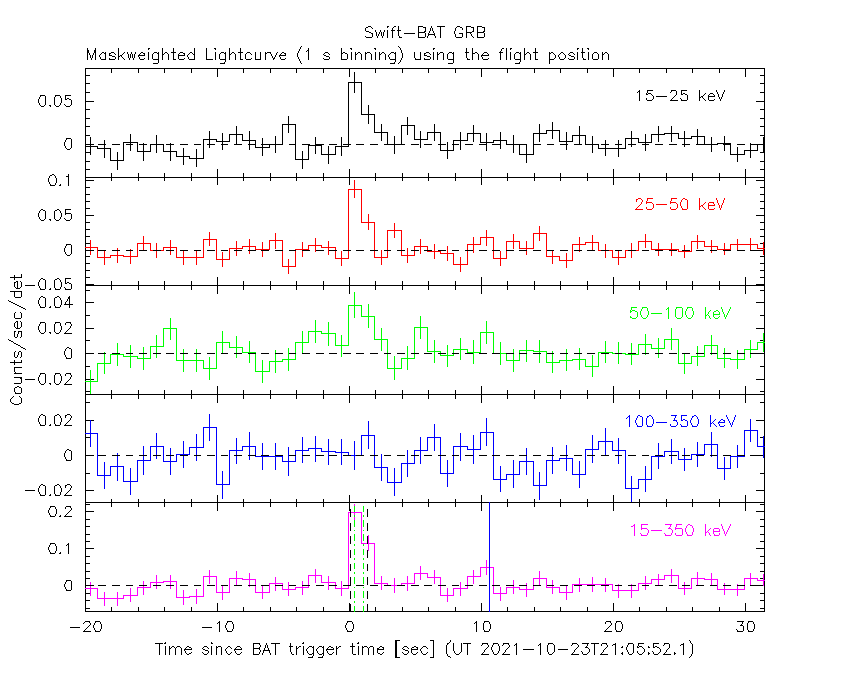
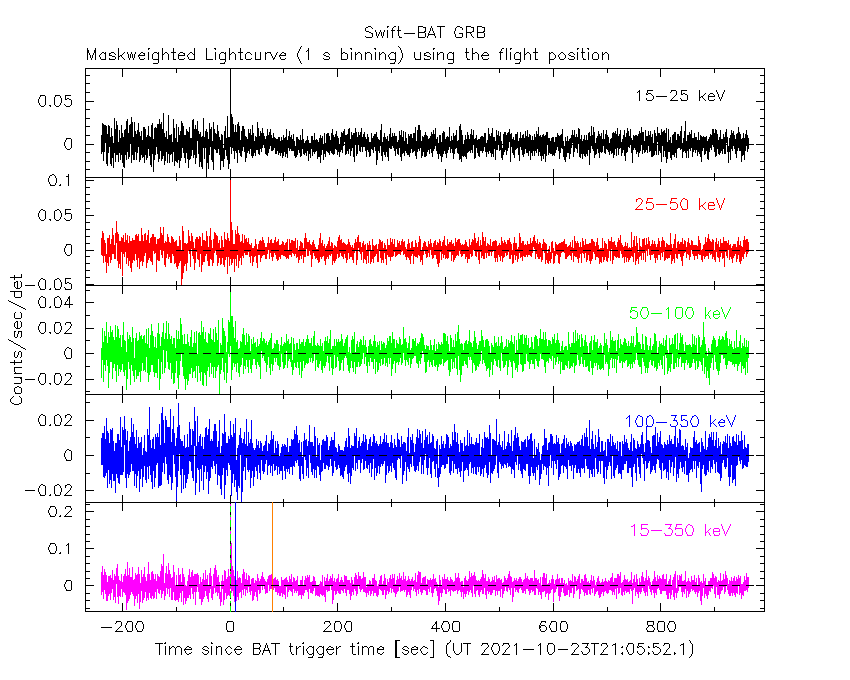
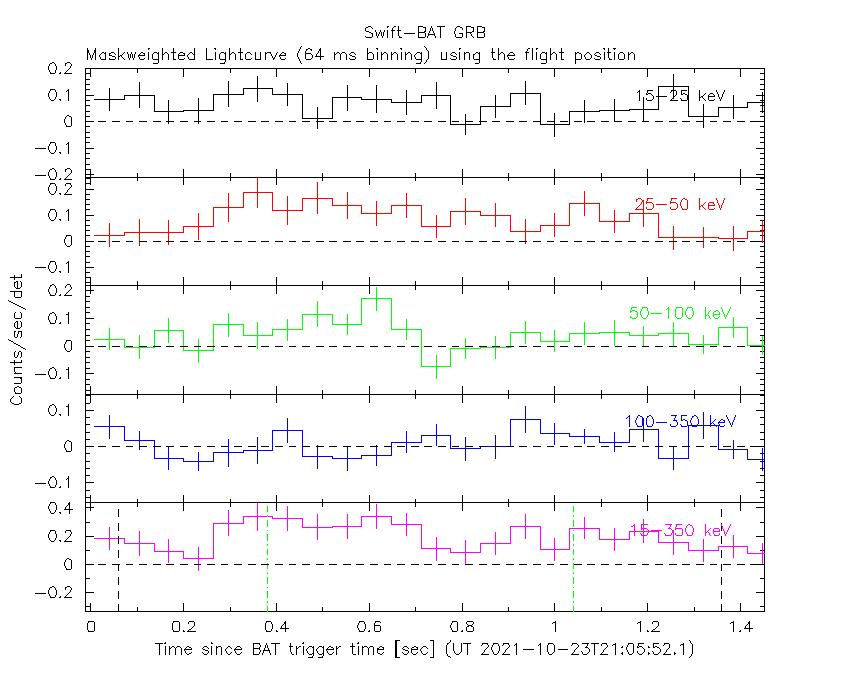
Lightcurves
Notes:
- 1) The mask-weighted light curves are using the flight position.
- 2) Multiple plots of different time binning/intervals are shown to cover all scenarios of short/long GRBs, rate/image triggers, and real/false positives.
- 3) For all the mask-weighted lightcurves, the y-axis units are counts/sec/det where a det is 0.4 x 0.4 = 0.16 sq cm.
- 4) The verticle lines correspond to following: green dotted lines are T50 interval, black dotted lines are T90 interval, blue solid line(s) is a spacecraft slew start time, and orange solid line(s) is a spacecraft slew end time.
- 5) Time of each bin is in the middle of the bin.
1 s binning
From T0-310 s to T0+310 s
From T100_start - 20 s to T100_end + 30 s
Full time interval
64 ms binning
Full time interval

From T100_start to T100_end
From T0-5 sec to T0+5 sec

16 ms binning
From T100_start-5 s to T100_start+5 s
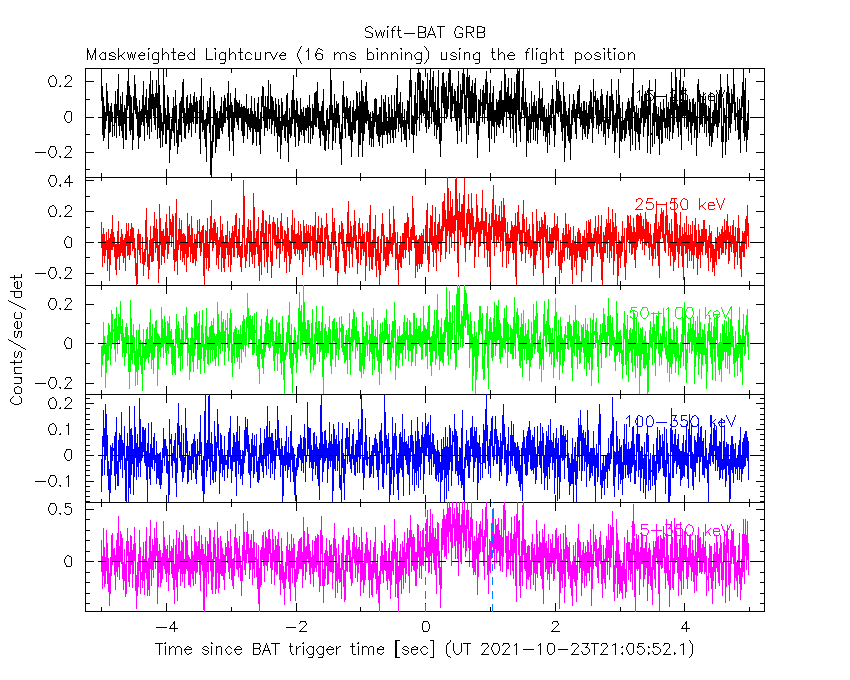
Blue+Cyan dotted lines: Time interval of the scaled map
From 0.000000 to 1.024000
8 ms binning
From T100_start-3 s to T100_start+3 s

Blue+Cyan dotted lines: Time interval of the scaled map
From 0.000000 to 1.024000
2 ms binning
From T100_start-1 s to T100_start+1 s

Blue+Cyan dotted lines: Time interval of the scaled map
From 0.000000 to 1.024000
SN=5 or 10 sec. binning (whichever binning is satisfied first)

SN=5 or 10 sec. binning (T < 200 sec)

Quad-rate summed light curves (from T0-300s to T0+1000s)

Spectral Evolution

Spectra
Notes:
- 1) The fitting includes the systematic errors.
- 2) When the burst includes telescope slew time periods, the fitting uses an average response file made from multiple 5-s response files through out the slew time plus single time preiod for the non-slew times, and weighted by the total counts in the corresponding time period using addrmf. An average response file is needed becuase a spectral fit using the pre-slew DRM will introduce some errors in both a spectral shape and a normalization if the PHA file contains a lot of the slew/post-slew time interval.
- 3) For fits to more complicated models (e.g. a power-law over a cutoff power-law), the BAT team has decided to require a chi-square improvement of more than 6 for each extra dof.
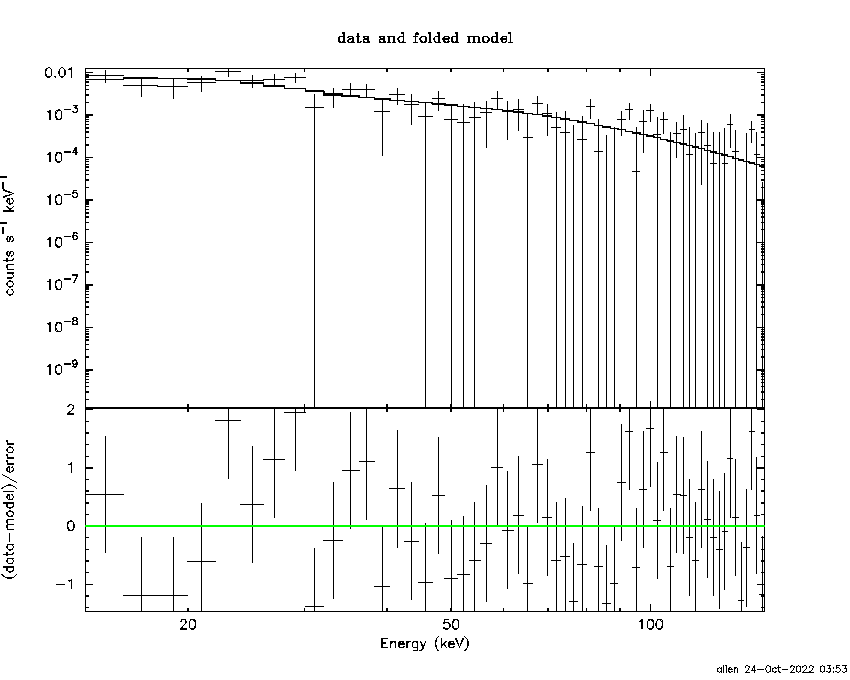
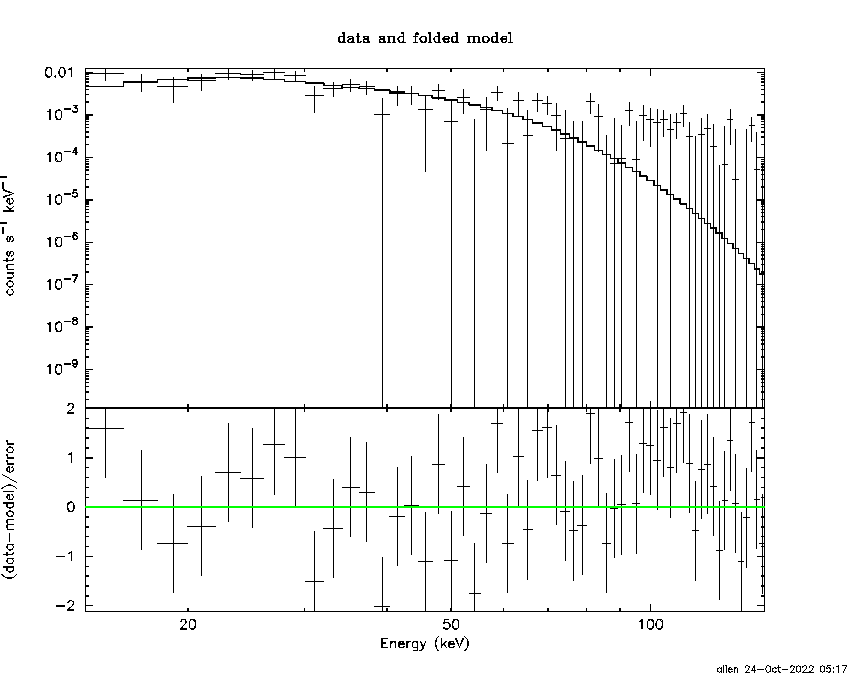
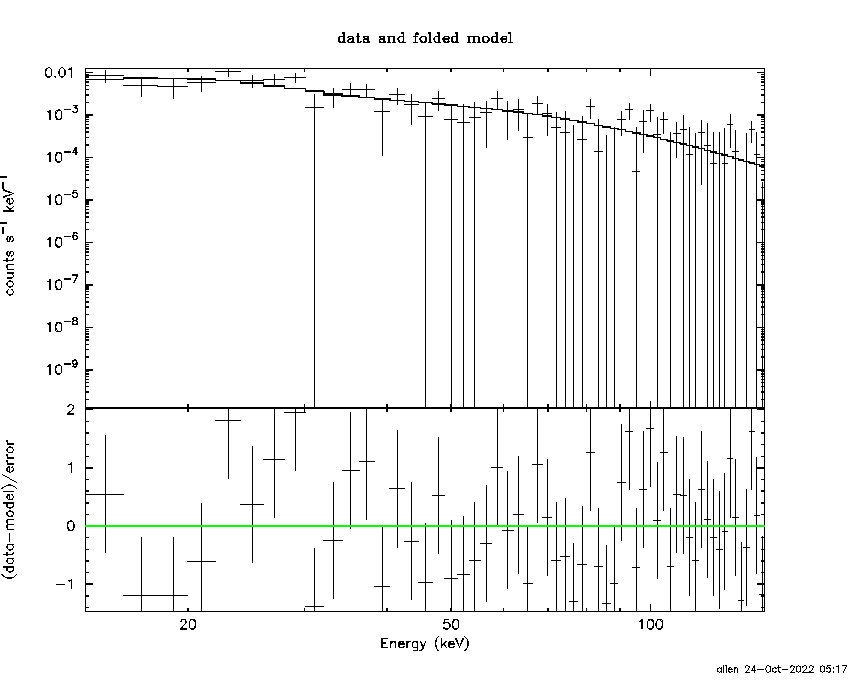
Time averaged spectrum fit using the average DRM
Power-law model

Time interval is from   -0.012 sec. to    1.452 sec.

Spectral model in power-law:
------------------------------------------------------------
Parameters  : value       lower 90%   higher 90%
Photon index: 1.99344     ( -0.244405   0.262283 )
Norm@50keV  : 1.24896E-02    ( -0.00213603   0.00206606 )
------------------------------------------------------------
#Fit statistic  : Chi-Squared                   49.55     using 59 bins.
 Reduced chi-squared = 0.869298
# Null hypothesis probability of 7.48e-01 with 57 degrees of freedom

Photon flux (15-150 keV)    in 1.464 sec: 1.86795 ( -0.26064  0.26077 ) ph/cm2/s
Energy fluence (15-150 keV)             : 1.68594e-07 ( -2.69395e-08  2.73267e-08 ) ergs/cm2
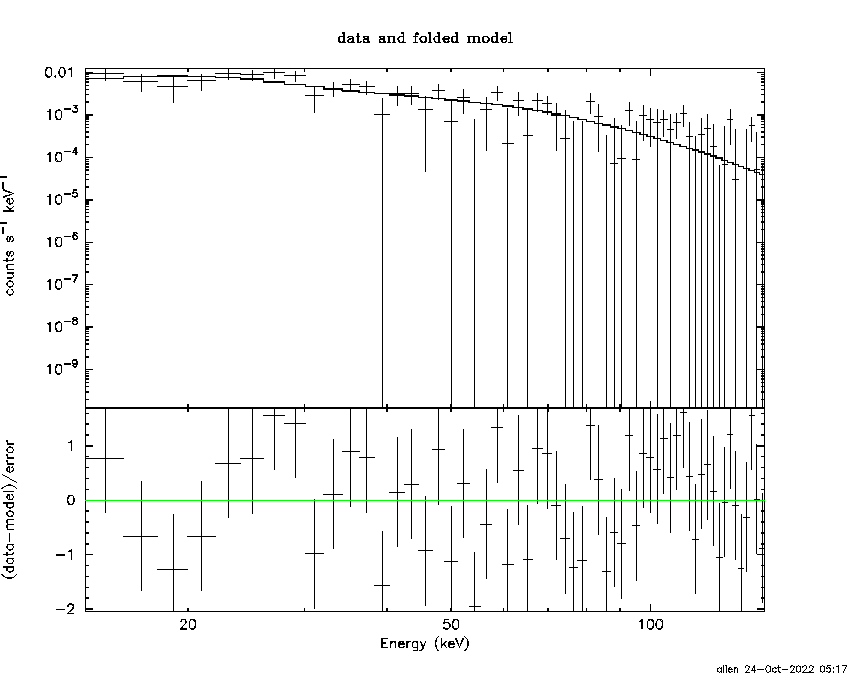
Cutoff power-law model
Time interval is from   -0.012 sec. to    1.452 sec.
Spectral model in the cutoff power-law:
------------------------------------------------------------
Parameters  : value       lower 90%   higher 90%
Photon index: 1.98198     ( -1.10201   0.254876 )
Epeak [keV] : 64.1709      ( -52.3872 -53.6476 )
Norm@50keV  : 1.26867E-02    ( -0.00801636   0.043286 )
------------------------------------------------------------
#Fit statistic  : Chi-Squared                   49.55     using 59 bins.
 Reduced chi-squared = 0.884821
# Null hypothesis probability of 7.16e-01 with 56 degrees of freedom

Photon flux (15-150 keV)    in 1.464 sec: 1.86662 ( -0.26364  0.26318 ) ph/cm2/s
Energy fluence (15-150 keV)             : 1.68164e-07 ( -3.0414e-08  2.75679e-08 ) ergs/cm2
Band function

Time interval is from   -0.012 sec. to    1.452 sec.


Spectral model in the Band function:
------------------------------------------------------------
Parameters  : value       lower 90%   higher 90%
alpha       :    (     )
beta        :     (     )
Epeak [keV] :       (   )
Norm@50keV   :     (     )
------------------------------------------------------------

Photon flux (15-150 keV)    in  sec:  (    ) ph/cm2/s
Energy fluence (15-150 keV)             : 0 ( 0  0 ) ergs/cm2
Single BB
Spectral model blackbody:
------------------------------------------------------------
Parameters  : value    Lower 90%  Upper 90%
kT [keV]    : 8.94055  (-1.42452  1.77712)
R^2/D10^2   : 1.33557  (-0.676118   1.30111)
(R is the radius in km and D10 is the distance to the source in units of 10 kpc)
------------------------------------------------------------
#Fit statistic  : Chi-Squared                   62.38     using 59 bins.
 Reduced chi-squared =
# Null hypothesis probability of 2.91e-01 with 57 degrees of freedom

Energy  Fluence     90% Error
[keV]   [erg/cm2]   [erg/cm2]
15- 25  3.032e-08   8.960e-09
25- 50  6.379e-08   1.333e-08
50-150  2.384e-08   8.889e-09
15-150  1.180e-07   2.588e-08
Thermal bremsstrahlung (OTTB)

Spectral model: thermal bremsstrahlung
------------------------------------------------------------
Parameters  : value         Lower 90%    Upper 90%
kT [keV]    : 69.2258       (-24.494      48.5203)
Norm        : 9.22943       (-1.94491     2.51262)
------------------------------------------------------------
#Fit statistic  : Chi-Squared                   50.61     using 59 bins.
 Reduced chi-squared =
# Null hypothesis probability of 7.12e-01 with 57 degrees of freedom

Energy  Fluence     90% Error
[keV]   [erg/cm2]   [erg/cm2]
15- 25  3.462e-08   6.339e-09
25- 50  5.492e-08   9.575e-09
50-150  6.996e-08   3.257e-08
15-150  1.595e-07   3.323e-08
Double BB

Spectral model: bbodyrad<1> + bbodyrad<2>
------------------------------------------------------------
Parameters  : value         Lower 90%    Upper 90%
kT1 [keV]   : 6.98540        (-1.36667      1.52963)
R1^2/D10^2  : 3.03646        (-1.60108      3.60456)
kT2 [keV]   : 37.9870        (-17.0209      -37.987)
R2^2/D10^2  : 4.34582E-03    (-0.00392126   0.0279522)
------------------------------------------------------------
#Fit statistic  : Chi-Squared                   45.57     using 59 bins.
 Reduced chi-squared =
# Null hypothesis probability of 8.14e-01 with 55 degrees of freedom

Energy  Fluence     90% Error
[keV]   [erg/cm2]   [erg/cm2]
15- 25  3.600e-08   1.577e-08
25- 50  5.568e-08   2.368e-08
50-150  8.169e-08   4.463e-08
15-150  1.734e-07   6.882e-08
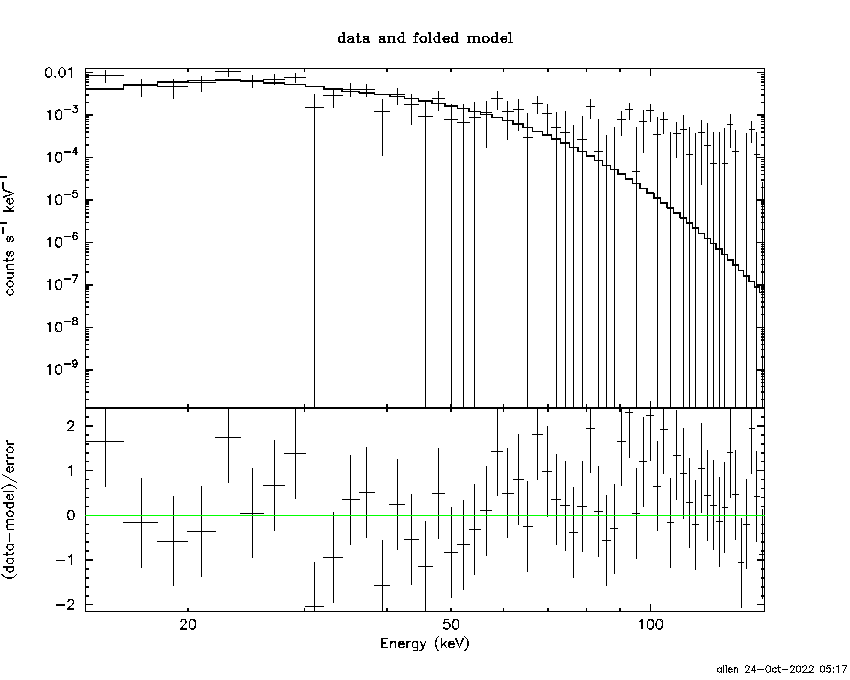
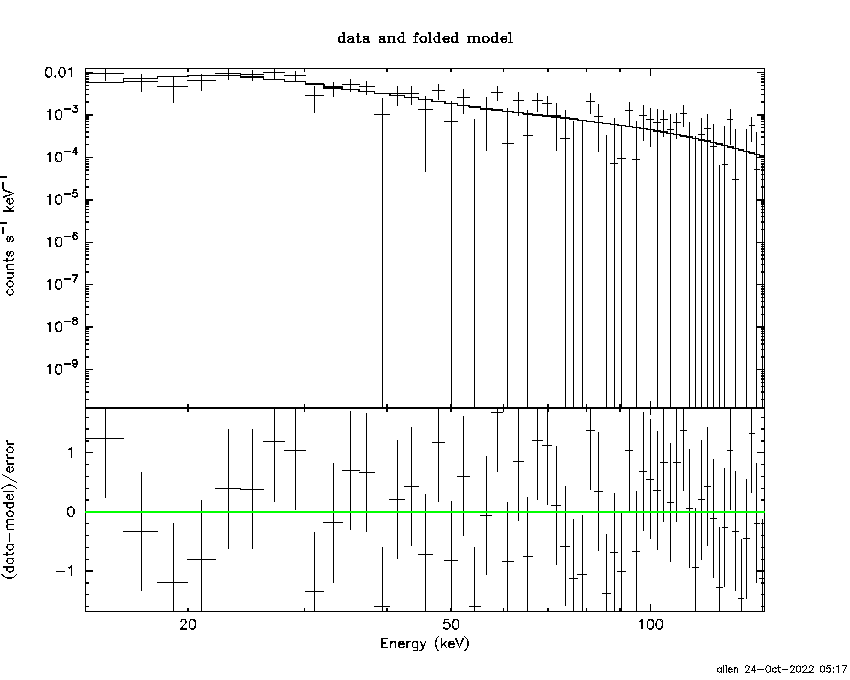
Peak spectrum fit
Power-law model

Time interval is from    0.244 sec. to    1.244 sec.

Spectral model in power-law:
------------------------------------------------------------
Parameters  : value       lower 90%   higher 90%
Photon index: 1.95060     ( -0.241214   0.257596 )
Norm@50keV  : 1.51730E-02    ( -0.00256514   0.00249103 )
------------------------------------------------------------
#Fit statistic  : Chi-Squared                   52.61     using 59 bins.
 Reduced chi-squared = 0.922982
# Null hypothesis probability of 6.40e-01 with 57 degrees of freedom

Photon flux (15-150 keV)    in 1 sec: 2.22593 ( -0.31657  0.31677 ) ph/cm2/s
Energy fluence (15-150 keV)             : 1.39659e-07 ( -2.25015e-08  2.27986e-08 ) ergs/cm2
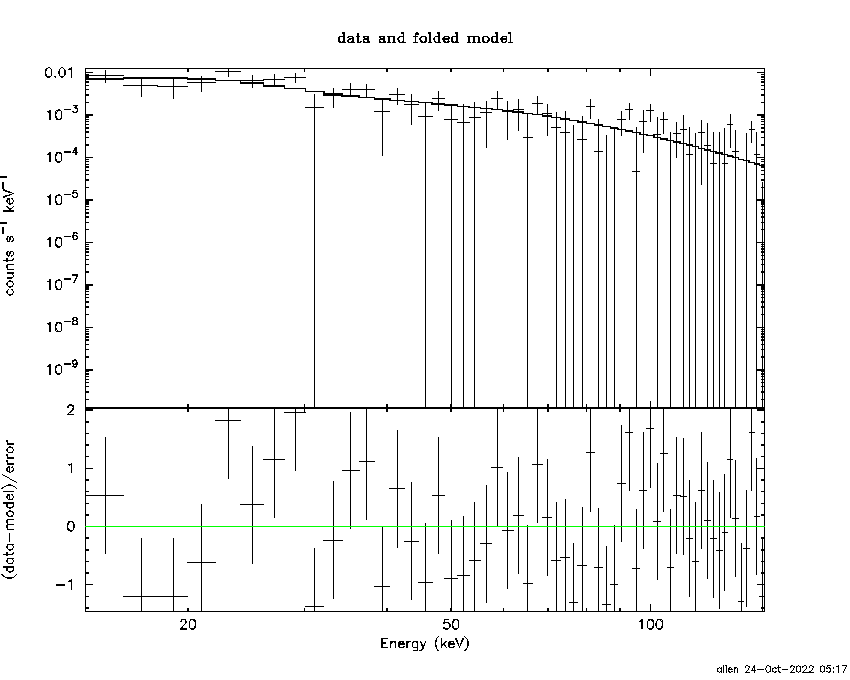
Cutoff power-law model

Time interval is from    0.244 sec. to    1.244 sec.
Spectral model in the cutoff power-law:
------------------------------------------------------------
Parameters  : value       lower 90%   higher 90%
Photon index: 1.66722     ( -1.26168   0.511996 )
Epeak [keV] : 50.9341      ( -50.8416 -50.9108 )
Norm@50keV  : 2.20452E-02    ( -0.0120185   0.0995767 )
------------------------------------------------------------
#Fit statistic  : Chi-Squared                   52.36     using 59 bins.
 Reduced chi-squared = 0.935
# Null hypothesis probability of 6.13e-01 with 56 degrees of freedom

Photon flux (15-150 keV)    in 1 sec: 2.21203 ( -0.32063  0.32031 ) ph/cm2/s
Energy fluence (15-150 keV)             : 1.36518e-07 ( -2.56235e-08  2.47432e-08 ) ergs/cm2
Band function

Time interval is from    0.244 sec. to    1.244 sec.


Spectral model in the Band function:
------------------------------------------------------------
Parameters  : value       lower 90%   higher 90%
alpha       :    (     )
beta        :     (     )
Epeak [keV] :       (   )
Norm@50keV   :     (     )
------------------------------------------------------------

Photon flux (15-150 keV)    in  sec:  (    ) ph/cm2/s
Energy fluence (15-150 keV)             : 0 ( 0  0 ) ergs/cm2
Single BB
Spectral model blackbody:
------------------------------------------------------------
Parameters  : value    Lower 90%  Upper 90%
kT [keV]    : 9.54573  (-1.50735  1.82155)
R^2/D10^2   : 1.26344  (-0.619251   1.18428)
(R is the radius in km and D10 is the distance to the source in units of 10 kpc)
------------------------------------------------------------
#Fit statistic  : Chi-Squared                   62.28     using 59 bins.
 Reduced chi-squared =
# Null hypothesis probability of 2.94e-01 with 57 degrees of freedom

Energy  Fluence     90% Error
[keV]   [erg/cm2]   [erg/cm2]
15- 25  2.304e-08   5.770e-09
25- 50  5.355e-08   1.118e-08
50-150  2.439e-08   1.014e-08
15-150  1.010e-07   2.046e-08
Thermal bremsstrahlung (OTTB)
Spectral model: thermal bremsstrahlung
------------------------------------------------------------
Parameters  : value         Lower 90%    Upper 90%
kT [keV]    : 73.8508       (-26.087      52.6581)
Norm        : 10.8044       (-2.22297     2.80483)
------------------------------------------------------------
#Fit statistic  : Chi-Squared                   52.60     using 59 bins.
 Reduced chi-squared =
# Null hypothesis probability of 6.41e-01 with 57 degrees of freedom

Energy  Fluence     90% Error
[keV]   [erg/cm2]   [erg/cm2]
15- 25  2.786e-08   5.730e-09
25- 50  4.496e-08   7.330e-09
50-150  6.005e-08   2.960e-08
15-150  1.329e-07   2.896e-08
Double BB
Spectral model: bbodyrad<1> + bbodyrad<2>
------------------------------------------------------------
Parameters  : value         Lower 90%    Upper 90%
kT1 [keV]   : 7.48740        (-1.52826      1.68959)
R1^2/D10^2  : 2.77971        (-1.46481      3.51998)
kT2 [keV]   : 39.5397        (-19.107      -39.5397)
R2^2/D10^2  : 4.42680E-03    (-0.00421169   0.0377364)
------------------------------------------------------------
#Fit statistic  : Chi-Squared                   48.41     using 59 bins.
 Reduced chi-squared =
# Null hypothesis probability of 7.23e-01 with 55 degrees of freedom

Energy  Fluence     90% Error
[keV]   [erg/cm2]   [erg/cm2]
15- 25  2.761e-08   1.036e-08
25- 50  4.765e-08   1.927e-08
50-150  6.640e-08   3.500e-08
15-150  1.417e-07   5.598e-08
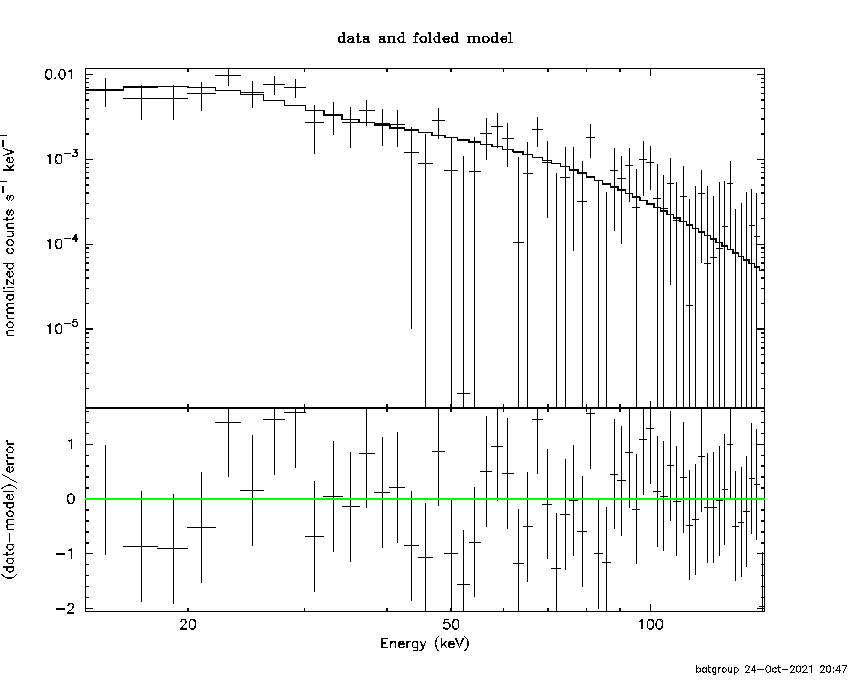
Pre-slew spectrum (Pre-slew PHA with pre-slew DRM)
Power-law model
Spectral model in power-law:
------------------------------------------------------------
Parameters  : value       lower 90%   higher 90%
Photon index: 1.99344     ( -0.244405   0.262283 )
Norm@50keV  : 1.24896E-02    ( -0.00213603   0.00206606 )
------------------------------------------------------------
#Fit statistic  : Chi-Squared                   49.55     using 59 bins.
 Reduced chi-squared =
# Null hypothesis probability of 7.48e-01 with 57 degrees of freedom

Photon flux (15-150 keV)    in 1.464 sec: 1.86781 ( -0.260617  0.260748 ) ph/cm2/s
Energy fluence (15-150 keV)             : 1.68563e-07 ( -2.69336e-08  2.73332e-08 ) ergs/cm2
Cutoff power-law model
Spectral model in the cutoff power-law:
------------------------------------------------------------
Parameters  : value       lower 90%   higher 90%
Photon index: 1.96312     ( -1.09149   0.222033 )
Epeak [keV] : 52.5981      ( -46.6644 -52.6888 )
Norm@50keV  : 1.30021E-02    ( -0.00802299   0.0432757 )
------------------------------------------------------------
#Fit statistic  : Chi-Squared                   49.55     using 59 bins.
 Reduced chi-squared =
# Null hypothesis probability of 7.16e-01 with 56 degrees of freedom

Photon flux (15-150 keV)    in 1.464 sec: 1.86560 ( -0.26302  0.26214 ) ph/cm2/s
Energy fluence (15-150 keV)             : 1.67493e-07 ( -2.97658e-08  2.83782e-08 ) ergs/cm2
Band function
Spectral model in the Band function:
------------------------------------------------------------
Parameters  : value       lower 90%   higher 90%
alpha       :    (     )
beta        :     (     )
Epeak [keV] :       (   )
Norm@50keV   :     (     )
------------------------------------------------------------

Photon flux (15-150 keV)    in  sec:  (    ) ph/cm2/s
Energy fluence (15-150 keV)             : 0 ( 0  0 ) ergs/cm2
S(25-50 keV) vs. S(50-100 keV) plot

S(25-50 keV)  = 5.07e-08
S(50-100 keV) = 5.09e-08
T90 vs. Hardness ratio plot
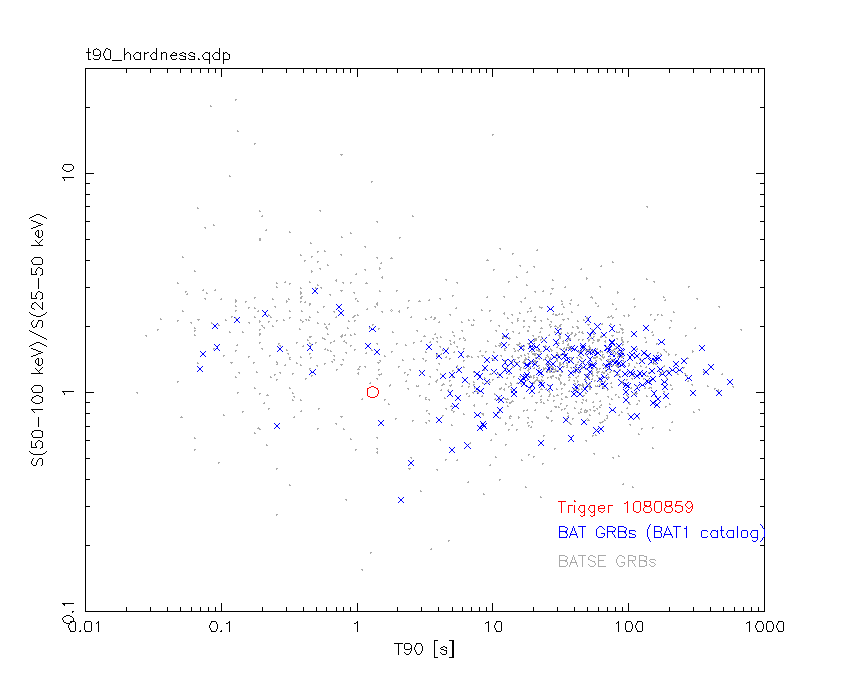
T90                                   = 1.29999995231628 sec.
Hardness ratio (energy fluence ratio) = 1.00394
Color vs. Color plot

Count Ratio  (25-50 keV) / (15-25 keV) = 1.27362
Count Ratio (50-100 keV) / (15-25 keV) = 0.599605
Mask shadow pattern

IMX = -8.559957113769353E-01, IMY = 2.699789472553979E-01
TIME vs. PHA plot around the trigger time

Blue+Cyan dotted lines: Time interval of the scaled map
From 0.000000 to 1.024000
TIME vs. DetID plot around the trigger time
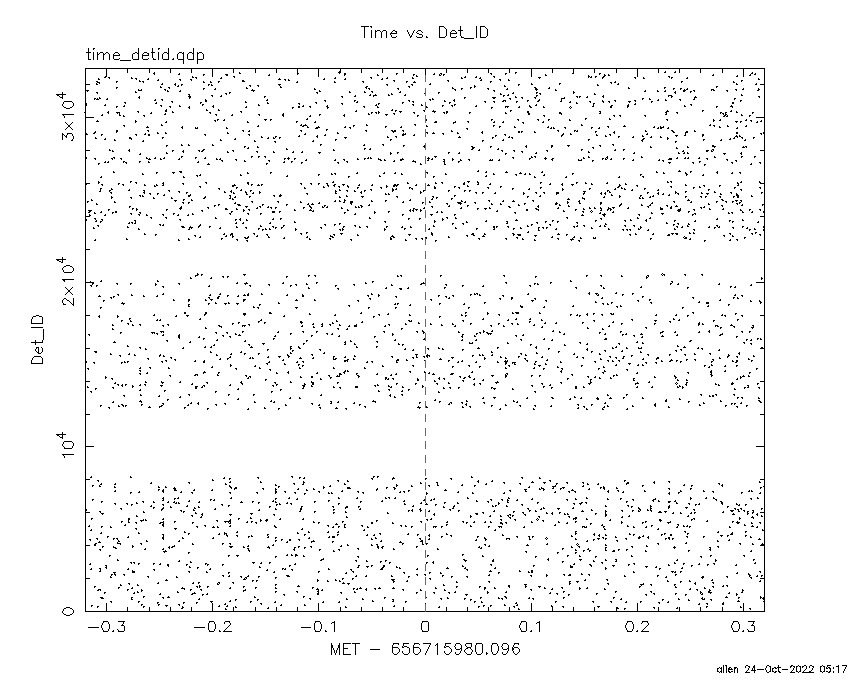
Blue+Cyan dotted lines: Time interval of the scaled map
From 0.000000 to 1.024000
100 us light curve (15-350 keV)

Blue+Cyan dotted lines: Time interval of the scaled map
From 0.000000 to 1.024000
Spacecraft aspect plot

Bright source in the pre-burst/pre-slew/post-slew images
Pre-burst image of 15-350 keV band
Time interval of the image:
-239.096000 -0.012000

# RAcent  DECcent POSerr Theta    Phi  PeakCts   SNR AngSep     Name
#  [deg]    [deg]    ['] [deg]  [deg]                   [']
135.5544 -40.5738    2.9  44.3    7.6   1.8169   3.9    1.6	Vela X-1
119.2150  -7.8218    2.7  31.5   64.4   1.5986   4.3 ------	UNKNOWN
161.2801 -33.6724    3.2  37.4  -23.9   1.2850   3.6 ------	UNKNOWN
159.7279 -53.6995    2.8  56.3  -14.7   3.4506   4.1 ------	UNKNOWN
180.2194  17.2289    2.6  34.1 -125.9   1.7838   4.5 ------	UNKNOWN
185.1550 -26.6019    2.3  44.9  -55.3   4.6842   5.0 ------	UNKNOWN
Pre-slew background subtracted image of 15-350 keV band
Time interval of the image:
-0.012000 1.452000

# RAcent  DECcent POSerr Theta    Phi  PeakCts   SNR AngSep     Name
#  [deg]    [deg]    ['] [deg]  [deg]                   [']
135.5350 -40.5241    7.1  44.2    7.7   0.0461   1.6    1.9	Vela X-1
170.3188  39.1344    1.0  41.9 -162.5   0.2942  11.8 ------	UNKNOWN
Post-slew image of 15-350 keV band
Time interval of the image:
79.004600 962.967500

# RAcent  DECcent POSerr Theta    Phi  PeakCts   SNR AngSep     Name
#  [deg]    [deg]    ['] [deg]  [deg]                   [']
138.7786  -0.7184    3.5  49.2   -2.8   4.3016   3.3 ------	UNKNOWN
197.9379  25.2200    2.9  27.1 -113.8   3.7735   4.0 ------	UNKNOWN
200.7377  19.7643    3.3  32.6 -108.8   4.4654   3.5 ------	UNKNOWN
202.1651   9.2723    3.6  41.3  -98.7  12.6428   3.2 ------	UNKNOWN
Plot creation:
Mon Oct 24 05:17:35 EDT 2022