Estimated redshift from machine learning (Ukwatta et al. 2016) - may take a few minute to calcaulte
Image
Pre-slew 15.0-350.0 keV image (Event data)

#   RAcent    DECcent   POSerr    Theta     Phi              Peak Cts       SNR   Name
  154.7093    24.5659   0.0056     2.6971   166.1435         4.5106442     34.237 TRIG_01081073

Foreground time interval of the image:
-16.299  72.701 (delta_t =  89.000 [sec])
Background time interval of the image:
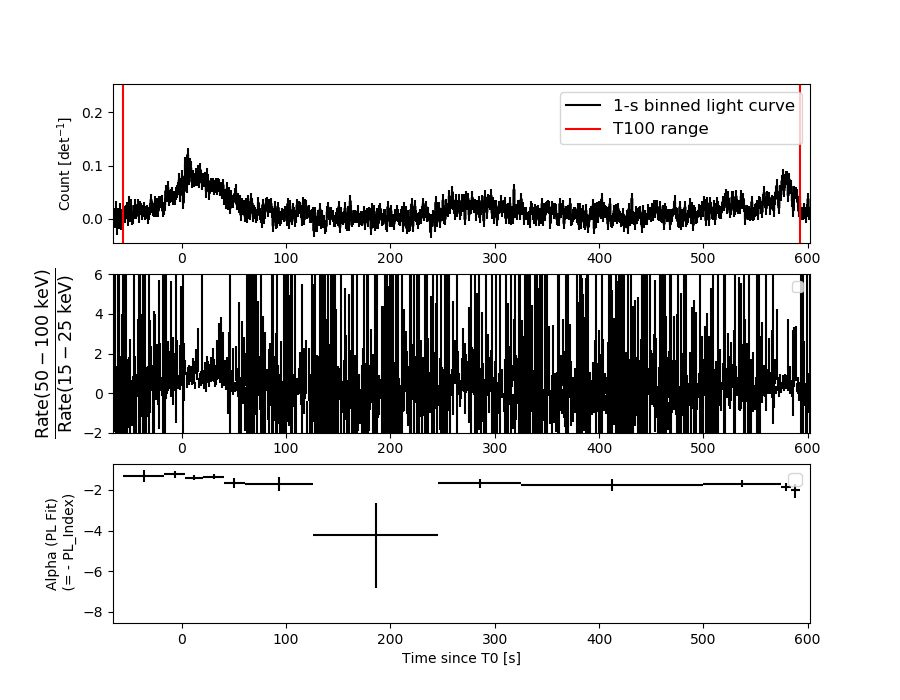
Lightcurves
Notes:
- 1) The mask-weighted light curves are using the flight position.
- 2) Multiple plots of different time binning/intervals are shown to cover all scenarios of short/long GRBs, rate/image triggers, and real/false positives.
- 3) For all the mask-weighted lightcurves, the y-axis units are counts/sec/det where a det is 0.4 x 0.4 = 0.16 sq cm.
- 4) The verticle lines correspond to following: green dotted lines are T50 interval, black dotted lines are T90 interval, blue solid line(s) is a spacecraft slew start time, and orange solid line(s) is a spacecraft slew end time.
- 5) Time of each bin is in the middle of the bin.
1 s binning
From T0-310 s to T0+310 s

From T100_start - 20 s to T100_end + 30 s

Full time interval

64 ms binning
Full time interval

From T100_start to T100_end

From T0-5 sec to T0+5 sec

16 ms binning
From T100_start-5 s to T100_start+5 s

Blue+Cyan dotted lines: Time interval of the scaled map
From 0.000000 to 64.000000
8 ms binning
From T100_start-3 s to T100_start+3 s

Blue+Cyan dotted lines: Time interval of the scaled map
From 0.000000 to 64.000000
2 ms binning
From T100_start-1 s to T100_start+1 s

Blue+Cyan dotted lines: Time interval of the scaled map
From 0.000000 to 64.000000
SN=5 or 10 sec. binning (whichever binning is satisfied first)

SN=5 or 10 sec. binning (T < 200 sec)

Quad-rate summed light curves (from T0-300s to T0+1000s)

Spectral Evolution
Spectra
Notes:
- 1) The fitting includes the systematic errors.
- 2) When the burst includes telescope slew time periods, the fitting uses an average response file made from multiple 5-s response files through out the slew time plus single time preiod for the non-slew times, and weighted by the total counts in the corresponding time period using addrmf. An average response file is needed becuase a spectral fit using the pre-slew DRM will introduce some errors in both a spectral shape and a normalization if the PHA file contains a lot of the slew/post-slew time interval.
- 3) For fits to more complicated models (e.g. a power-law over a cutoff power-law), the BAT team has decided to require a chi-square improvement of more than 6 for each extra dof.
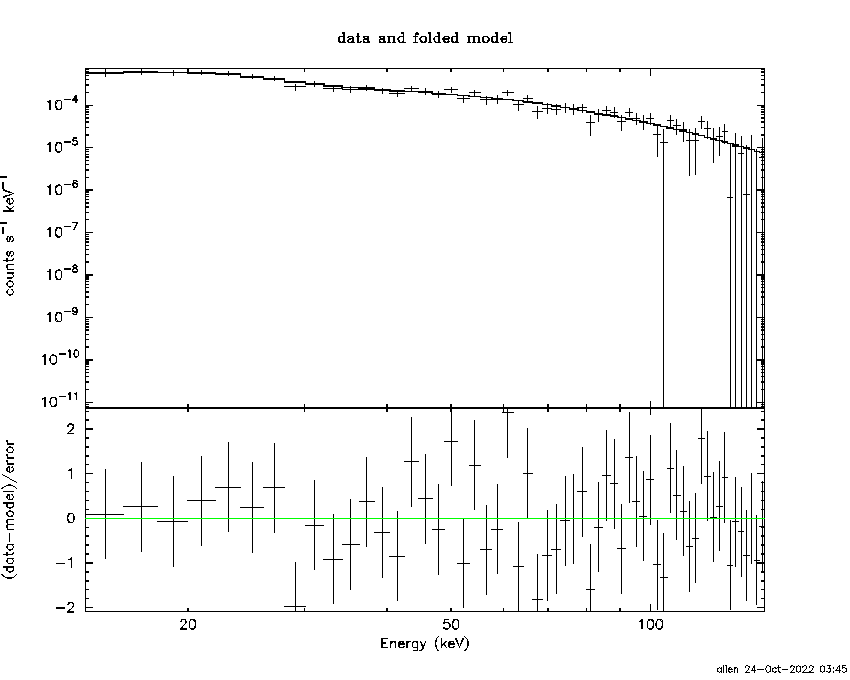
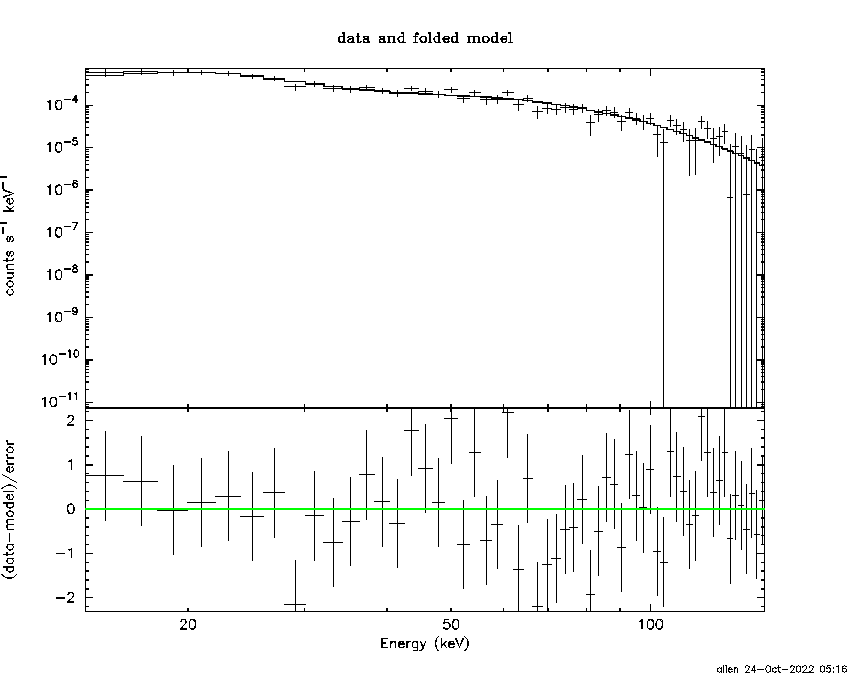
Time averaged spectrum fit using the average DRM
Power-law model

Time interval is from  -56.504 sec. to  592.396 sec.

Spectral model in power-law:
------------------------------------------------------------
Parameters  : value       lower 90%   higher 90%
Photon index: 1.61200     ( -0.0871712   0.08795 )
Norm@50keV  : 1.13439E-03    ( -5.28952e-05   5.26863e-05 )
------------------------------------------------------------
#Fit statistic  : Chi-Squared                   47.83     using 59 bins.
 Reduced chi-squared = 0.839123
# Null hypothesis probability of 8.01e-01 with 57 degrees of freedom

Photon flux (15-150 keV)    in 648.9 sec: 0.146326 ( -0.006837  0.006858 ) ph/cm2/s
Energy fluence (15-150 keV)             : 6.87523e-06 ( -3.45306e-07  3.47611e-07 ) ergs/cm2
Cutoff power-law model
Time interval is from  -56.504 sec. to  592.396 sec.
Spectral model in the cutoff power-law:
------------------------------------------------------------
Parameters  : value       lower 90%   higher 90%
Photon index: 1.61354     ( -0.0902259   0.0864798 )
Epeak [keV] : 9999.36      ( -9999.36 -9999.36 )
Norm@50keV  : 1.13313E-03    ( -5.19636e-05   0.00039102 )
------------------------------------------------------------
#Fit statistic  : Chi-Squared                   47.85     using 59 bins.
 Reduced chi-squared = 0.854464
# Null hypothesis probability of 7.72e-01 with 56 degrees of freedom

Photon flux (15-150 keV)    in 648.9 sec: 0.147024 ( -0.010206  0.008457 ) ph/cm2/s
Energy fluence (15-150 keV)             : 6.91078e-06 ( -5.1509e-07  3.9838e-07 ) ergs/cm2
Band function

Time interval is from  -56.504 sec. to  592.396 sec.


Spectral model in the Band function:
------------------------------------------------------------
Parameters  : value       lower 90%   higher 90%
alpha       :    (     )
beta        :     (     )
Epeak [keV] :       (   )
Norm@50keV   :     (     )
------------------------------------------------------------

Photon flux (15-150 keV)    in  sec:  (    ) ph/cm2/s
Energy fluence (15-150 keV)             : 0 ( 0  0 ) ergs/cm2
Single BB
Spectral model blackbody:
------------------------------------------------------------
Parameters  : value    Lower 90%  Upper 90%
kT [keV]    : 14.4446  (  )
R^2/D10^2   : 1.76543E-02  (   )
(R is the radius in km and D10 is the distance to the source in units of 10 kpc)
------------------------------------------------------------
#Fit statistic  : Chi-Squared                  179.80     using 59 bins.
 Reduced chi-squared =
# Null hypothesis probability of 1.21e-14 with 57 degrees of freedom

Energy  Fluence     90% Error
[keV]   [erg/cm2]   [erg/cm2]
15- 25  5.032e-07   4.636e-08
25- 50  1.930e-06   1.113e-07
50-150  2.692e-06   2.725e-07
15-150  5.125e-06   2.897e-07
Thermal bremsstrahlung (OTTB)
Spectral model: thermal bremsstrahlung
------------------------------------------------------------
Parameters  : value         Lower 90%    Upper 90%
kT [keV]    : 185.079       (-42.7735      -185.236)
Norm        : 0.588360       (-0.0284781     0.0314177)
------------------------------------------------------------
#Fit statistic  : Chi-Squared                   52.02     using 59 bins.
 Reduced chi-squared =
# Null hypothesis probability of 6.62e-01 with 57 degrees of freedom

Energy  Fluence     90% Error
[keV]   [erg/cm2]   [erg/cm2]
15- 25  9.596e-07   6.067e-08
25- 50  1.830e-06   2.122e-07
50-150  3.912e-06   1.296e-06
15-150  6.701e-06   1.669e-06
Double BB
Spectral model: bbodyrad<1> + bbodyrad<2>
------------------------------------------------------------
Parameters  : value         Lower 90%    Upper 90%
kT1 [keV]   : 5.83328        (-1.00363      1.21419)
R1^2/D10^2  : 0.312169        (-0.156716      0.357675)
kT2 [keV]   : 24.1214        (-3.25541      4.99044)
R2^2/D10^2  : 2.41919E-03    (-0.00118931   0.00171153)
------------------------------------------------------------
#Fit statistic  : Chi-Squared                   55.77     using 59 bins.
 Reduced chi-squared =
# Null hypothesis probability of 4.46e-01 with 55 degrees of freedom

Energy  Fluence     90% Error
[keV]   [erg/cm2]   [erg/cm2]
15- 25  1.040e-06   1.483e-07
25- 50  1.724e-06   1.966e-07
50-150  3.967e-06   5.688e-07
15-150  6.731e-06   7.774e-07
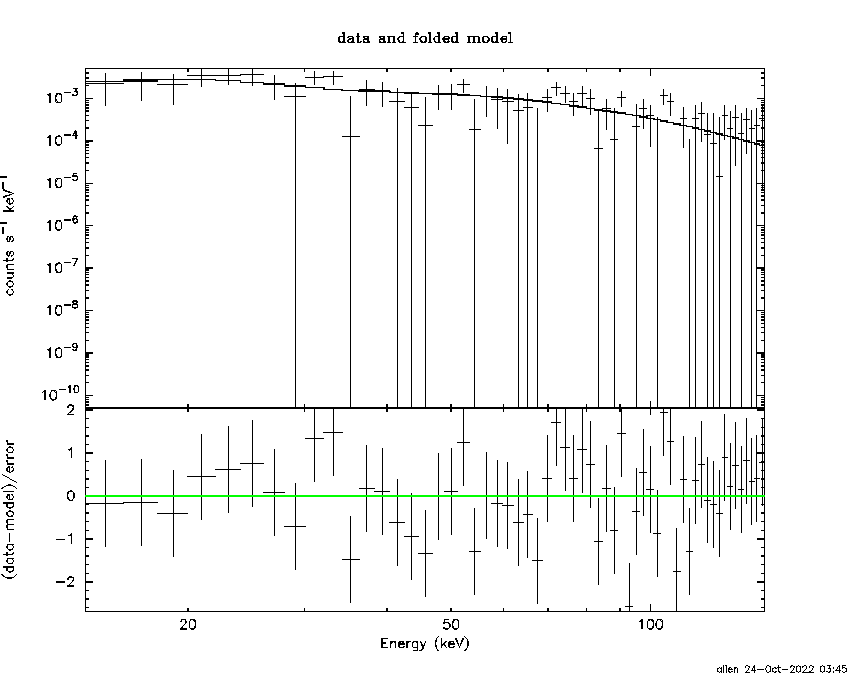
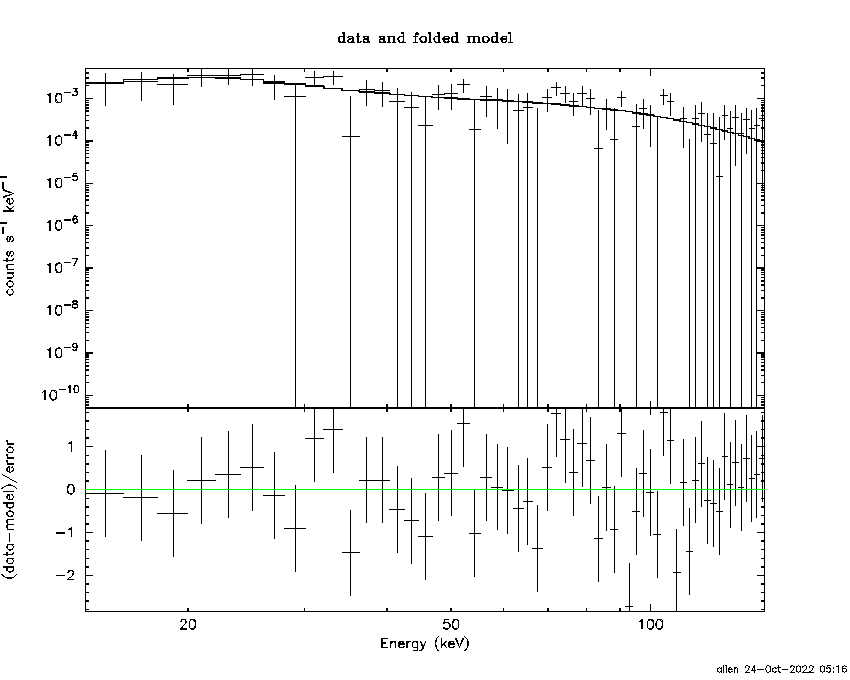
Peak spectrum fit
Power-law model

Time interval is from    5.172 sec. to    6.172 sec.

Spectral model in power-law:
------------------------------------------------------------
Parameters  : value       lower 90%   higher 90%
Photon index: 1.20643     ( -0.327887   0.314234 )
Norm@50keV  : 7.43867E-03    ( -0.0012823   0.00128152 )
------------------------------------------------------------
#Fit statistic  : Chi-Squared                   49.56     using 59 bins.
 Reduced chi-squared = 0.869474
# Null hypothesis probability of 7.48e-01 with 57 degrees of freedom

Photon flux (15-150 keV)    in 1 sec: 0.873951 ( -0.154269  0.154749 ) ph/cm2/s
Energy fluence (15-150 keV)             : 7.53408e-08 ( -1.46378e-08  1.48267e-08 ) ergs/cm2
Cutoff power-law model
Time interval is from    5.172 sec. to    6.172 sec.
Spectral model in the cutoff power-law:
------------------------------------------------------------
Parameters  : value       lower 90%   higher 90%
Photon index: 1.21288     ( -0.34255   0.306567 )
Epeak [keV] : 9999.34      ( -9999.36 -9999.36 )
Norm@50keV  : 7.47075E-03    ( -0.00128842   0.00881674 )
------------------------------------------------------------
#Fit statistic  : Chi-Squared                   49.57     using 59 bins.
 Reduced chi-squared = 0.885179
# Null hypothesis probability of 7.15e-01 with 56 degrees of freedom

Photon flux (15-150 keV)    in 1 sec: 0.880677 ( -0.205712  0.192243 ) ph/cm2/s
Energy fluence (15-150 keV)             : 2.6313e-08 ( -1.521e-08  1.34455e-08 ) ergs/cm2
Band function

Time interval is from    5.172 sec. to    6.172 sec.


Spectral model in the Band function:
------------------------------------------------------------
Parameters  : value       lower 90%   higher 90%
alpha       :    (     )
beta        :     (     )
Epeak [keV] :       (   )
Norm@50keV   :     (     )
------------------------------------------------------------

Photon flux (15-150 keV)    in  sec:  (    ) ph/cm2/s
Energy fluence (15-150 keV)             : 0 ( 0  0 ) ergs/cm2
Single BB

Spectral model blackbody:
------------------------------------------------------------
Parameters  : value    Lower 90%  Upper 90%
kT [keV]    : 19.4481  (-4.9131  7.33832)
R^2/D10^2   : 4.22111E-02  (-0.0266287   0.0680458)
(R is the radius in km and D10 is the distance to the source in units of 10 kpc)
------------------------------------------------------------
#Fit statistic  : Chi-Squared                   62.64     using 59 bins.
 Reduced chi-squared =
# Null hypothesis probability of 2.83e-01 with 57 degrees of freedom

Energy  Fluence     90% Error
[keV]   [erg/cm2]   [erg/cm2]
15- 25  3.111e-09   1.270e-09
25- 50  1.521e-08   5.512e-09
50-150  4.246e-08   1.613e-08
15-150  6.078e-08   1.742e-08
Thermal bremsstrahlung (OTTB)

Spectral model: thermal bremsstrahlung
------------------------------------------------------------
Parameters  : value         Lower 90%    Upper 90%
kT [keV]    : 200.000       (-64.1942      -200)
Norm        : 3.58813       (-0.631984     0.631984)
------------------------------------------------------------
#Fit statistic  : Chi-Squared                   53.50     using 59 bins.
 Reduced chi-squared =
# Null hypothesis probability of 6.07e-01 with 57 degrees of freedom

Energy  Fluence     90% Error
[keV]   [erg/cm2]   [erg/cm2]
15- 25  8.935e-09   5.265e-09
25- 50  1.719e-08   9.775e-09
50-150  3.770e-08   2.147e-08
15-150  6.382e-08   3.609e-08
Double BB
Spectral model: bbodyrad<1> + bbodyrad<2>
------------------------------------------------------------
Parameters  : value         Lower 90%    Upper 90%
kT1 [keV]   : 7.24028        (-2.46625      2.11417)
R1^2/D10^2  : 0.846073        (-0.640352      2.94719)
kT2 [keV]   : 45.1552        (-35.9465      -45.1536)
R2^2/D10^2  : 2.90338E-03    (-0.00275749   0.0135971)
------------------------------------------------------------
#Fit statistic  : Chi-Squared                   47.98     using 59 bins.
 Reduced chi-squared =
# Null hypothesis probability of 7.37e-01 with 55 degrees of freedom

Energy  Fluence     90% Error
[keV]   [erg/cm2]   [erg/cm2]
15- 25  8.068e-09   4.768e-09
25- 50  1.569e-08   8.535e-09
50-150  5.621e-08   3.133e-08
15-150  7.997e-08   4.303e-08
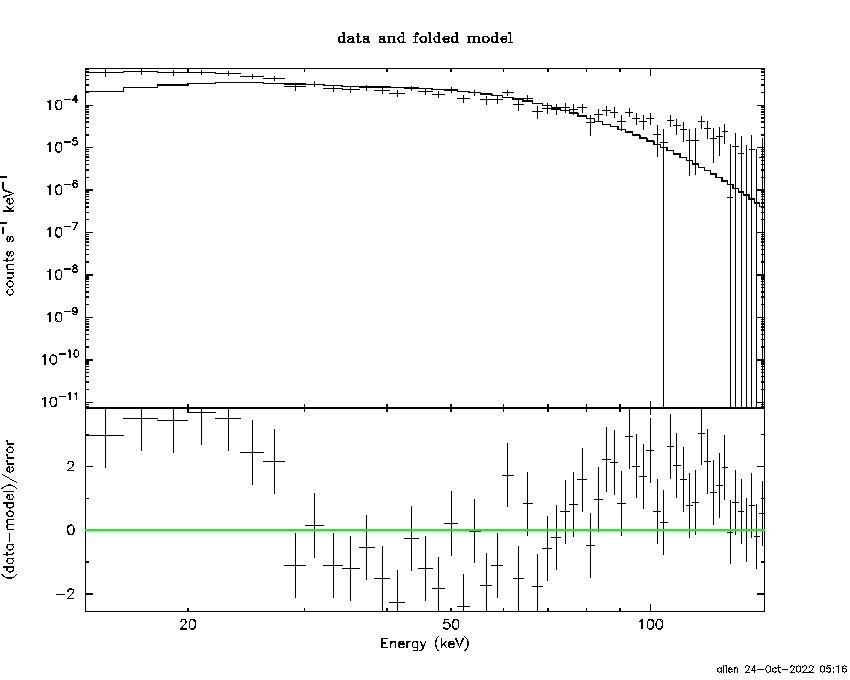
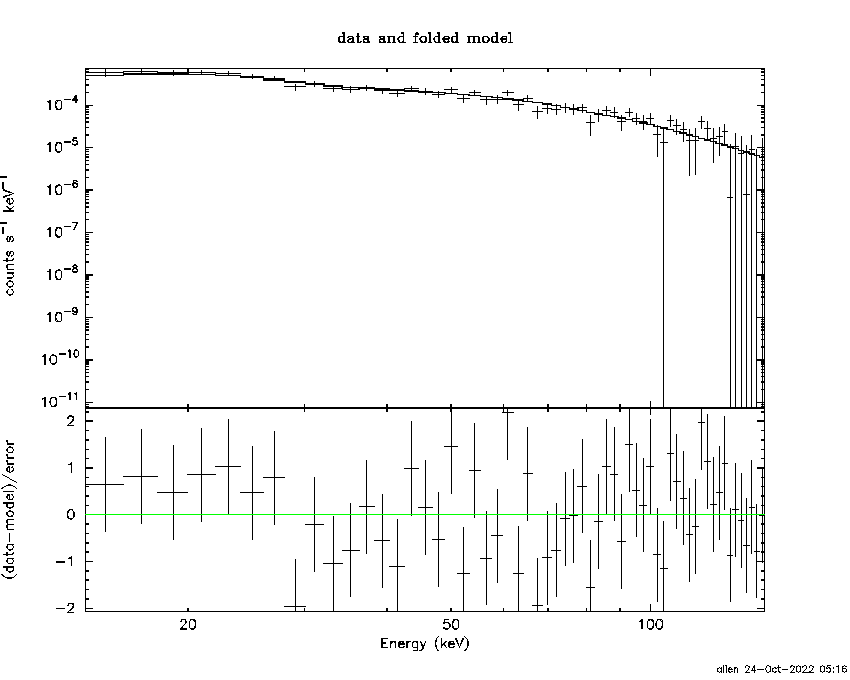
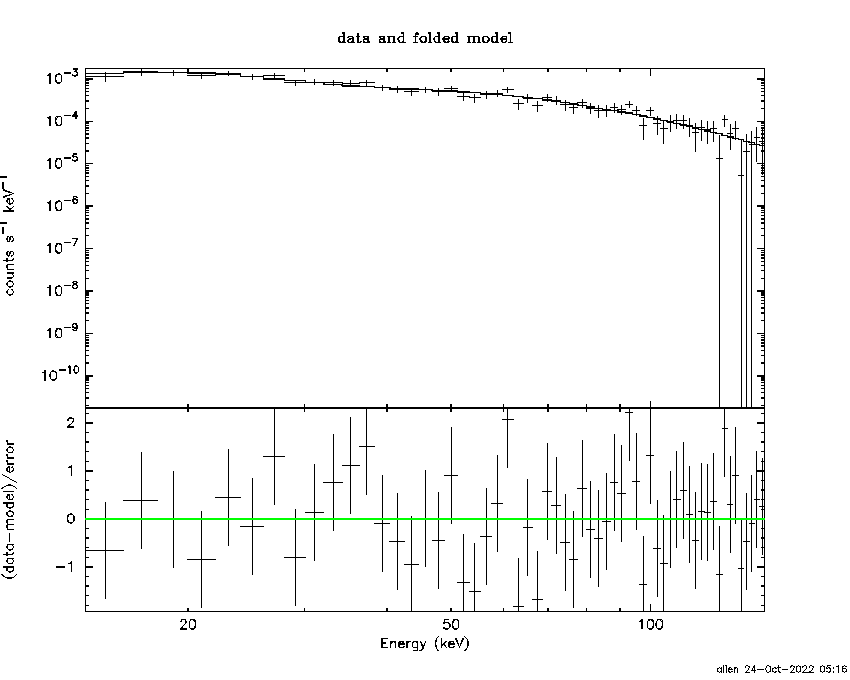
Pre-slew spectrum (Pre-slew PHA with pre-slew DRM)
Power-law model

Spectral model in power-law:
------------------------------------------------------------
Parameters  : value       lower 90%   higher 90%
Photon index: 1.40777     ( -0.0840118   0.0839594 )
Norm@50keV  : 3.12735E-03    ( -0.000140298   0.000140083 )
------------------------------------------------------------
#Fit statistic  : Chi-Squared                   46.29     using 59 bins.
 Reduced chi-squared =
# Null hypothesis probability of 8.44e-01 with 57 degrees of freedom

Photon flux (15-150 keV)    in 89 sec: 0.381529 ( -0.0176559  0.0176961 ) ph/cm2/s
Energy fluence (15-150 keV)             : 2.68522e-06 ( -1.33925e-07  1.34554e-07 ) ergs/cm2
Cutoff power-law model
Spectral model in the cutoff power-law:
------------------------------------------------------------
Parameters  : value       lower 90%   higher 90%
Photon index: 1.40473     ( -0.207431   0.112902 )
Epeak [keV] : 9999.23      ( -9999.24 -9999.24 )
Norm@50keV  : 3.13834E-03    ( -0.000140924   0.00085942 )
------------------------------------------------------------
#Fit statistic  : Chi-Squared                   46.31     using 59 bins.
 Reduced chi-squared =
# Null hypothesis probability of 8.19e-01 with 56 degrees of freedom

Photon flux (15-150 keV)    in 89 sec: 0.381632 ( -0.017892  0.017436 ) ph/cm2/s
Energy fluence (15-150 keV)             : 2.6843e-06 ( -1.26522e-07  1.33562e-07 ) ergs/cm2
Band function

Spectral model in the Band function:
------------------------------------------------------------
Parameters  : value       lower 90%   higher 90%
alpha       :    (     )
beta        :     (     )
Epeak [keV] :       (   )
Norm@50keV   :     (     )
------------------------------------------------------------

Photon flux (15-150 keV)    in  sec:  (    ) ph/cm2/s
Energy fluence (15-150 keV)             : 0 ( 0  0 ) ergs/cm2
S(25-50 keV) vs. S(50-100 keV) plot

S(25-50 keV)  = 1.79e-06
S(50-100 keV) = 2.34e-06
T90 vs. Hardness ratio plot

T90                                   = 600.007999897003 sec.
Hardness ratio (energy fluence ratio) = 1.30726
Color vs. Color plot

Count Ratio  (25-50 keV) / (15-25 keV) = 1.08367
Count Ratio (50-100 keV) / (15-25 keV) = 0.805038
Mask shadow pattern

IMX = -4.573684583323155E-02, IMY = -1.128187447192058E-02
TIME vs. PHA plot around the trigger time

Blue+Cyan dotted lines: Time interval of the scaled map
From 0.000000 to 64.000000
TIME vs. DetID plot around the trigger time

Blue+Cyan dotted lines: Time interval of the scaled map
From 0.000000 to 64.000000
100 us light curve (15-350 keV)

Blue+Cyan dotted lines: Time interval of the scaled map
From 0.000000 to 64.000000
Spacecraft aspect plot

Bright source in the pre-burst/pre-slew/post-slew images
Pre-burst image of 15-350 keV band
Time interval of the image:
Pre-slew background subtracted image of 15-350 keV band
Time interval of the image:
-16.299410 72.700600

# RAcent  DECcent POSerr Theta    Phi  PeakCts   SNR AngSep     Name
#  [deg]    [deg]    ['] [deg]  [deg]                   [']
130.4257  18.7747    2.4  22.8   69.0   0.8514   4.9 ------	UNKNOWN
154.7093  24.5659    0.3   2.7  166.1   4.5121  34.2 ------	UNKNOWN
180.7156   1.9804    2.8  32.3  -73.1   1.0201   4.0 ------	UNKNOWN
Post-slew image of 15-350 keV band
Time interval of the image:
99.900600 117.700590

# RAcent  DECcent POSerr Theta    Phi  PeakCts   SNR AngSep     Name
#  [deg]    [deg]    ['] [deg]  [deg]                   [']
199.5868  72.7381    2.4  54.0  167.3   1.0462   4.8 ------	UNKNOWN
172.2487  11.5338    2.7  21.1  -82.8   0.2405   4.4 ------	UNKNOWN
145.9147 -34.1228    2.5  59.3  -19.3   1.6637   4.7 ------	UNKNOWN
Plot creation:
Mon Oct 24 05:16:54 EDT 2022