Estimated redshift from machine learning (Ukwatta et al. 2016) - may take a few minute to calcaulte
Image
Pre-slew 15.0-350.0 keV image (Event data)
#   RAcent    DECcent   POSerr    Theta     Phi              Peak Cts       SNR   Name
  274.5659    31.7808   0.0107    21.6619   -39.3332         1.2496804     17.897 TRIG_01085430

Foreground time interval of the image:
 -1.804  14.301 (delta_t =  16.105 [sec])
Background time interval of the image:
-138.899  -1.804 (delta_t = 137.095 [sec])
Lightcurves
Notes:
- 1) The mask-weighted light curves are using the flight position.
- 2) Multiple plots of different time binning/intervals are shown to cover all scenarios of short/long GRBs, rate/image triggers, and real/false positives.
- 3) For all the mask-weighted lightcurves, the y-axis units are counts/sec/det where a det is 0.4 x 0.4 = 0.16 sq cm.
- 4) The verticle lines correspond to following: green dotted lines are T50 interval, black dotted lines are T90 interval, blue solid line(s) is a spacecraft slew start time, and orange solid line(s) is a spacecraft slew end time.
- 5) Time of each bin is in the middle of the bin.
1 s binning
From T0-310 s to T0+310 s
From T100_start - 20 s to T100_end + 30 s
Full time interval
64 ms binning
Full time interval
From T100_start to T100_end
From T0-5 sec to T0+5 sec
16 ms binning
From T100_start-5 s to T100_start+5 s

Blue+Cyan dotted lines: Time interval of the scaled map
From 0.000000 to 1.024000
8 ms binning
From T100_start-3 s to T100_start+3 s
Blue+Cyan dotted lines: Time interval of the scaled map
From 0.000000 to 1.024000
2 ms binning
From T100_start-1 s to T100_start+1 s
Blue+Cyan dotted lines: Time interval of the scaled map
From 0.000000 to 1.024000
SN=5 or 10 sec. binning (whichever binning is satisfied first)
SN=5 or 10 sec. binning (T < 200 sec)

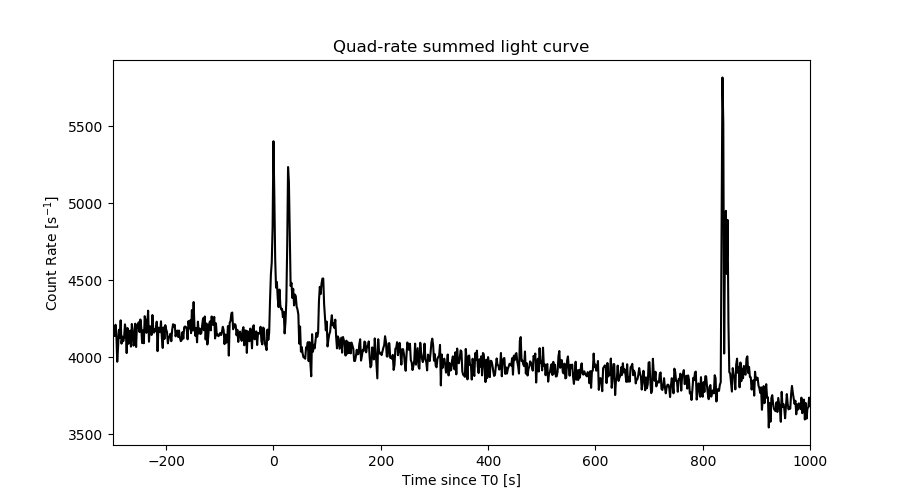
Quad-rate summed light curves (from T0-300s to T0+1000s)
Spectral Evolution

Spectra
Notes:
- 1) The fitting includes the systematic errors.
- 2) When the burst includes telescope slew time periods, the fitting uses an average response file made from multiple 5-s response files through out the slew time plus single time preiod for the non-slew times, and weighted by the total counts in the corresponding time period using addrmf. An average response file is needed becuase a spectral fit using the pre-slew DRM will introduce some errors in both a spectral shape and a normalization if the PHA file contains a lot of the slew/post-slew time interval.
- 3) For fits to more complicated models (e.g. a power-law over a cutoff power-law), the BAT team has decided to require a chi-square improvement of more than 6 for each extra dof.
Time averaged spectrum fit using the average DRM
Power-law model
Time interval is from   -1.804 sec. to  848.544 sec.

Spectral model in power-law:
------------------------------------------------------------
Parameters  : value       lower 90%   higher 90%
Photon index: 1.77485     ( -0.272151   0.286875 )
Norm@50keV  : 3.01610E-04    ( -5.51669e-05   5.32909e-05 )
------------------------------------------------------------
#Fit statistic  : Chi-Squared                   58.52     using 59 bins.
 Reduced chi-squared = 1.02667
# Null hypothesis probability of 4.20e-01 with 57 degrees of freedom

Photon flux (15-150 keV)    in 850.3 sec: 4.11650E-02 ( -0.0060319  0.0060318 ) ph/cm2/s
Energy fluence (15-150 keV)             : 2.36376e-06 ( -4.34136e-07  4.49064e-07 ) ergs/cm2
Cutoff power-law model

Time interval is from   -1.804 sec. to  848.544 sec.
Spectral model in the cutoff power-law:
------------------------------------------------------------
Parameters  : value       lower 90%   higher 90%
Photon index: 1.77877     ( -0.919922   0.71319 )
Epeak [keV] : 9996.16      ( -9999.23 -9999.24 )
Norm@50keV  : 2.99797E-04    ( -0.000301624   0.000739153 )
------------------------------------------------------------
#Fit statistic  : Chi-Squared                   58.52     using 59 bins.
 Reduced chi-squared = 1.045
# Null hypothesis probability of 3.83e-01 with 56 degrees of freedom

Photon flux (15-150 keV)    in 850.3 sec: 3.69056E-02 ( -0.0100465  0.0086929 ) ph/cm2/s
Energy fluence (15-150 keV)             : 2.36332e-06 ( -3.46007e-07  4.48988e-07 ) ergs/cm2
Band function

Time interval is from   -1.804 sec. to  848.544 sec.


Spectral model in the Band function:
------------------------------------------------------------
Parameters  : value       lower 90%   higher 90%
alpha       :    (     )
beta        :     (     )
Epeak [keV] :       (   )
Norm@50keV   :     (     )
------------------------------------------------------------

Photon flux (15-150 keV)    in  sec:  (    ) ph/cm2/s
Energy fluence (15-150 keV)             : 0 ( 0  0 ) ergs/cm2
Single BB
Spectral model blackbody:
------------------------------------------------------------
Parameters  : value    Lower 90%  Upper 90%
kT [keV]    : 9.41771  (-1.68227  2.25789)
R^2/D10^2   : 2.36614E-02  (-0.0130359   0.026288)
(R is the radius in km and D10 is the distance to the source in units of 10 kpc)
------------------------------------------------------------
#Fit statistic  : Chi-Squared                   72.16     using 59 bins.
 Reduced chi-squared =
# Null hypothesis probability of 8.51e-02 with 57 degrees of freedom

Energy  Fluence     90% Error
[keV]   [erg/cm2]   [erg/cm2]
15- 25  3.550e-07   1.040e-07
25- 50  8.089e-07   1.804e-07
50-150  3.539e-07   1.541e-07
15-150  1.518e-06   3.422e-07
Thermal bremsstrahlung (OTTB)
Spectral model: thermal bremsstrahlung
------------------------------------------------------------
Parameters  : value         Lower 90%    Upper 90%
kT [keV]    : 99.9614       (-45.2688      -101.245)
Norm        : 0.181471       (-0.0312132     0.0472759)
------------------------------------------------------------
#Fit statistic  : Chi-Squared                   59.56     using 59 bins.
 Reduced chi-squared =
# Null hypothesis probability of 3.83e-01 with 57 degrees of freedom

Energy  Fluence     90% Error
[keV]   [erg/cm2]   [erg/cm2]
15- 25  4.033e-07   8.248e-08
25- 50  6.973e-07   1.630e-07
50-150  1.130e-06   6.887e-07
15-150  2.230e-06   8.197e-07
Double BB
Spectral model: bbodyrad<1> + bbodyrad<2>
------------------------------------------------------------
Parameters  : value         Lower 90%    Upper 90%
kT1 [keV]   : 6.71417        (-1.64943      1.88777)
R1^2/D10^2  : 7.05929E-02        (-0.0416596      0.0675471)
kT2 [keV]   : 38.1611        (-18.191      -38.1644)
R2^2/D10^2  : 1.35021E-04    (-0.000127763   0.00094164)
------------------------------------------------------------
#Fit statistic  : Chi-Squared                   55.83     using 59 bins.
 Reduced chi-squared =
# Null hypothesis probability of 4.43e-01 with 55 degrees of freedom

Energy  Fluence     90% Error
[keV]   [erg/cm2]   [erg/cm2]
15- 25  4.377e-07   1.944e-07
25- 50  6.741e-07   3.078e-07
50-150  1.426e-06   8.553e-07
15-150  2.538e-06   1.245e-06
Peak spectrum fit
Power-law model
Time interval is from    0.988 sec. to    1.988 sec.

Spectral model in power-law:
------------------------------------------------------------
Parameters  : value       lower 90%   higher 90%
Photon index: 1.53287     ( -0.240277   0.24406 )
Norm@50keV  : 1.22489E-02    ( -0.00190974   0.00188839 )
------------------------------------------------------------
#Fit statistic  : Chi-Squared                   89.18     using 59 bins.
 Reduced chi-squared = 1.56456
# Null hypothesis probability of 4.12e-03 with 57 degrees of freedom

Photon flux (15-150 keV)    in 1 sec: 1.54311 ( -0.22766  0.22781 ) ph/cm2/s
Energy fluence (15-150 keV)             : 1.15617e-07 ( -1.94425e-08  1.97959e-08 ) ergs/cm2
Cutoff power-law model
Time interval is from    0.988 sec. to    1.988 sec.
Spectral model in the cutoff power-law:
------------------------------------------------------------
Parameters  : value       lower 90%   higher 90%
Photon index: 0.450858     ( -1.485   1.12 )
Epeak [keV] : 63.6572      ( -16.8746 -63.5633 )
Norm@50keV  : 4.87912E-02    ( -0.0490723   0.272947 )
------------------------------------------------------------
#Fit statistic  : Chi-Squared                   86.51     using 59 bins.
 Reduced chi-squared = 1.54482
# Null hypothesis probability of 5.52e-03 with 56 degrees of freedom

Photon flux (15-150 keV)    in 1 sec: 1.48928 ( -0.23532  0.23537 ) ph/cm2/s
Energy fluence (15-150 keV)             : 1.03727e-07 ( -2.13435e-08  2.31988e-08 ) ergs/cm2
Band function

Time interval is from    0.988 sec. to    1.988 sec.


Spectral model in the Band function:
------------------------------------------------------------
Parameters  : value       lower 90%   higher 90%
alpha       :    (     )
beta        :     (     )
Epeak [keV] :       (   )
Norm@50keV   :     (     )
------------------------------------------------------------

Photon flux (15-150 keV)    in  sec:  (    ) ph/cm2/s
Energy fluence (15-150 keV)             : 0 ( 0  0 ) ergs/cm2
Single BB
Spectral model blackbody:
------------------------------------------------------------
Parameters  : value    Lower 90%  Upper 90%
kT [keV]    : 13.0001  (-1.9969  2.4315)
R^2/D10^2   : 0.299072  (-0.138156   0.245378)
(R is the radius in km and D10 is the distance to the source in units of 10 kpc)
------------------------------------------------------------
#Fit statistic  : Chi-Squared                   90.90     using 59 bins.
 Reduced chi-squared =
# Null hypothesis probability of 2.88e-03 with 57 degrees of freedom

Energy  Fluence     90% Error
[keV]   [erg/cm2]   [erg/cm2]
15- 25  1.072e-08   3.302e-09
25- 50  3.692e-08   8.130e-09
50-150  3.945e-08   1.402e-08
15-150  8.709e-08   1.915e-08
Thermal bremsstrahlung (OTTB)
Spectral model: thermal bremsstrahlung
------------------------------------------------------------
Parameters  : value         Lower 90%    Upper 90%
kT [keV]    : 183.104       (-90.0911      -181.958)
Norm        : 6.36418       (-0.949541     1.12728)
------------------------------------------------------------
#Fit statistic  : Chi-Squared                   87.79     using 59 bins.
 Reduced chi-squared =
# Null hypothesis probability of 5.48e-03 with 57 degrees of freedom

Energy  Fluence     90% Error
[keV]   [erg/cm2]   [erg/cm2]
15- 25  1.602e-08   9.000e-09
25- 50  3.050e-08   1.700e-08
50-150  6.497e-08   3.621e-08
15-150  1.115e-07   6.190e-08
Double BB
Spectral model: bbodyrad<1> + bbodyrad<2>
------------------------------------------------------------
Parameters  : value         Lower 90%    Upper 90%
kT1 [keV]   : 11.0295        (-6.95212      2.3086)
R1^2/D10^2  : 0.484160        (-0.238056      5.88438)
kT2 [keV]   : 199.363        (-199.363      -199.363)
R2^2/D10^2  : 1.26788E-04    (-7.75088e-05   0.198837)
------------------------------------------------------------
#Fit statistic  : Chi-Squared                   85.27     using 59 bins.
 Reduced chi-squared =
# Null hypothesis probability of 5.52e-03 with 55 degrees of freedom

Energy  Fluence     90% Error
[keV]   [erg/cm2]   [erg/cm2]
15- 25  1.464e-08   8.380e-09
25- 50  3.347e-08   1.789e-08
50-150  5.504e-08   3.162e-08
15-150  1.031e-07   5.505e-08
Pre-slew spectrum (Pre-slew PHA with pre-slew DRM)
Power-law model
Spectral model in power-law:
------------------------------------------------------------
Parameters  : value       lower 90%   higher 90%
Photon index: 1.66500     ( -0.156251   0.15926 )
Norm@50keV  : 4.71933E-03    ( -0.000459044   0.000452774 )
------------------------------------------------------------
#Fit statistic  : Chi-Squared                   57.64     using 59 bins.
 Reduced chi-squared =
# Null hypothesis probability of 4.51e-01 with 57 degrees of freedom

Photon flux (15-150 keV)    in 16.1 sec: 0.619310 ( -0.0540011  0.0540201 ) ph/cm2/s
Energy fluence (15-150 keV)             : 7.05626e-07 ( -7.27374e-08  7.38162e-08 ) ergs/cm2
Cutoff power-law model

Spectral model in the cutoff power-law:
------------------------------------------------------------
Parameters  : value       lower 90%   higher 90%
Photon index: 1.51890     ( -0.648527   0.558745 )
Epeak [keV] : 147.003      ( -147.335 -147.335 )
Norm@50keV  : 5.68972E-03    ( -0.00112842   0.00719695 )
------------------------------------------------------------
#Fit statistic  : Chi-Squared                   57.46     using 59 bins.
 Reduced chi-squared =
# Null hypothesis probability of 4.21e-01 with 56 degrees of freedom

Photon flux (15-150 keV)    in 16.1 sec: 0.615414 ( -0.056159  0.055879 ) ph/cm2/s
Energy fluence (15-150 keV)             : 6.94129e-07 ( -8.6523e-08  8.28812e-08 ) ergs/cm2
Band function
Spectral model in the Band function:
------------------------------------------------------------
Parameters  : value       lower 90%   higher 90%
alpha       :    (     )
beta        :     (     )
Epeak [keV] :       (   )
Norm@50keV   :     (     )
------------------------------------------------------------

Photon flux (15-150 keV)    in  sec:  (    ) ph/cm2/s
Energy fluence (15-150 keV)             : 0 ( 0  0 ) ergs/cm2
S(25-50 keV) vs. S(50-100 keV) plot
S(25-50 keV)  = 6.59e-07
S(50-100 keV) = 7.70e-07
T90 vs. Hardness ratio plot
T90                                   = 643.68799996376 sec.
Hardness ratio (energy fluence ratio) = 1.16844
Color vs. Color plot
Count Ratio  (25-50 keV) / (15-25 keV) = 1.1562
Count Ratio (50-100 keV) / (15-25 keV) = 0.561813
Mask shadow pattern
IMX = 3.072063213645213E-01, IMY = 2.517427789715487E-01
TIME vs. PHA plot around the trigger time
Blue+Cyan dotted lines: Time interval of the scaled map
From 0.000000 to 1.024000
TIME vs. DetID plot around the trigger time
Blue+Cyan dotted lines: Time interval of the scaled map
From 0.000000 to 1.024000
100 us light curve (15-350 keV)

Blue+Cyan dotted lines: Time interval of the scaled map
From 0.000000 to 1.024000
Spacecraft aspect plot
Bright source in the pre-burst/pre-slew/post-slew images
Pre-burst image of 15-350 keV band
Time interval of the image:
-138.899400 -1.804000

# RAcent  DECcent POSerr Theta    Phi  PeakCts   SNR AngSep     Name
#  [deg]    [deg]    ['] [deg]  [deg]                   [']
254.3908  35.3566  111.5  38.7  -34.9  -0.0354  -0.1    3.4	Her X-1
268.3190  -1.6277    0.0  40.6  -98.3  -2.4650  -2.6   10.9	SW J1753.5-0127
288.6311  10.9207    8.6  18.2 -116.0  -0.2974  -1.3   10.0	GRS 1915+105
299.6000  35.2156    0.5   8.8   35.8   4.8820  24.3    1.0	Cyg X-1
307.8449  41.0216    0.0  16.4   56.0   0.4799   2.0   12.7	Cyg X-3
325.9394  38.4114    0.0  25.8   86.4   0.7595   2.6   12.2	Cyg X-2
333.8360  68.7835    3.2  47.1   47.3   3.4401   3.6 ------	UNKNOWN
340.8599  -8.2613    2.7  53.7  155.2   5.0604   4.3 ------	UNKNOWN
310.6797  68.0138    2.5  42.2   37.4   2.1299   4.6 ------	UNKNOWN
297.2286  66.2692    3.0  39.8   29.9   1.3977   3.8 ------	UNKNOWN
240.8950  68.3309    2.2  53.8    8.0   4.6756   5.1 ------	UNKNOWN
Pre-slew background subtracted image of 15-350 keV band
Time interval of the image:
-1.804000 14.300600

# RAcent  DECcent POSerr Theta    Phi  PeakCts   SNR AngSep     Name
#  [deg]    [deg]    ['] [deg]  [deg]                   [']
254.6292  35.3098    4.7  38.5  -34.9  -0.2558  -2.5    8.6	Her X-1
268.2370  -1.5286    5.9  40.6  -98.1  -0.5605  -1.9    9.1	SW J1753.5-0127
288.9860  10.9418    4.0  18.0 -117.0   0.1994   2.9   11.1	GRS 1915+105
299.4918  35.0455    3.9   8.6   35.3   0.1864   3.0   10.5	Cyg X-1
308.3752  40.8832    0.0  16.5   57.5   0.0103   0.1   12.7	Cyg X-3
326.1726  38.1819    4.6  25.9   87.0  -0.2467  -2.5    8.4	Cyg X-2
274.5659  31.7808    0.6  21.7  -39.3   1.2494  17.9 ------	UNKNOWN
254.8956  27.3415    1.7  38.8  -47.7   0.8172   6.9 ------	UNKNOWN
Post-slew image of 15-350 keV band
Time interval of the image:
62.300600 830.200600

# RAcent  DECcent POSerr Theta    Phi  PeakCts   SNR AngSep     Name
#  [deg]    [deg]    ['] [deg]  [deg]                   [']
254.3123  35.4261   23.7  17.2  -13.4  -0.4180  -0.5    8.7	Her X-1
268.3800  -1.2942   16.6  33.6 -109.9   1.3634   0.7    9.5	SW J1753.5-0127
288.8353  10.7530    0.0  24.8 -156.4  -0.6929  -0.7   11.8	GRS 1915+105
299.6102  35.2040    0.4  21.1  132.7  26.6454  29.9    1.0	Cyg X-1
307.9239  40.8992   15.5  28.2  120.6   0.8306   0.7    9.0	Cyg X-3
326.1852  38.2376    6.5  42.2  125.3   5.1019   1.8    5.1	Cyg X-2
244.2022  59.6415    3.3  34.4   32.0   4.4453   3.5 ------	UNKNOWN
201.5822  52.4537    2.8  55.3   13.7  22.0409   4.1 ------	UNKNOWN
303.5739  16.7315    3.1  30.3  171.8   3.6649   3.7 ------	UNKNOWN
297.0950  11.5673    3.1  29.0 -172.0   3.2437   3.7 ------	UNKNOWN
235.9005  29.3703    2.0  33.2  -25.0   5.6395   5.7 ------	UNKNOWN
289.0285   0.4311    2.6  34.2 -147.5   4.5006   4.4 ------	UNKNOWN
241.9174  12.1119    2.4  35.9  -57.0   6.4055   4.8 ------	UNKNOWN
280.7647 -15.7984    3.6  48.0 -129.2  13.9108   3.2 ------	UNKNOWN
234.0044   5.8256    2.8  45.9  -56.9  17.8327   4.2 ------	UNKNOWN
Plot creation:
Mon Oct 24 05:15:33 EDT 2022