Estimated redshift from machine learning (Ukwatta et al. 2016) - may take a few minute to calcaulte
Image
Pre-slew 15.0-350.0 keV image (Event data)

#   RAcent    DECcent   POSerr    Theta     Phi              Peak Cts       SNR   Name
  149.6010   -24.3607   0.0204    33.0060     8.9684         0.3040143      9.391 TRIG_01088376

Foreground time interval of the image:
 -1.304   2.972 (delta_t =   4.276 [sec])
Background time interval of the image:
-239.992  -1.304 (delta_t = 238.688 [sec])
Lightcurves
Notes:
- 1) The mask-weighted light curves are using the flight position.
- 2) Multiple plots of different time binning/intervals are shown to cover all scenarios of short/long GRBs, rate/image triggers, and real/false positives.
- 3) For all the mask-weighted lightcurves, the y-axis units are counts/sec/det where a det is 0.4 x 0.4 = 0.16 sq cm.
- 4) The verticle lines correspond to following: green dotted lines are T50 interval, black dotted lines are T90 interval, blue solid line(s) is a spacecraft slew start time, and orange solid line(s) is a spacecraft slew end time.
- 5) Time of each bin is in the middle of the bin.
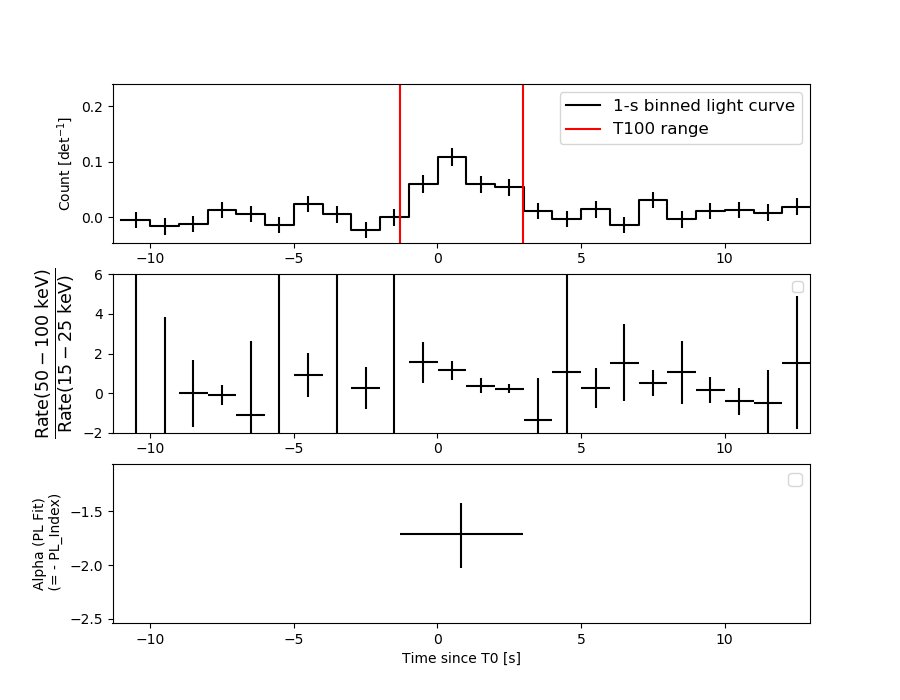
1 s binning
From T0-310 s to T0+310 s
From T100_start - 20 s to T100_end + 30 s

Full time interval

64 ms binning
Full time interval

From T100_start to T100_end

From T0-5 sec to T0+5 sec
16 ms binning
From T100_start-5 s to T100_start+5 s

Blue+Cyan dotted lines: Time interval of the scaled map
From 0.000000 to 1.024000
8 ms binning
From T100_start-3 s to T100_start+3 s
Blue+Cyan dotted lines: Time interval of the scaled map
From 0.000000 to 1.024000
2 ms binning
From T100_start-1 s to T100_start+1 s

Blue+Cyan dotted lines: Time interval of the scaled map
From 0.000000 to 1.024000
SN=5 or 10 sec. binning (whichever binning is satisfied first)

SN=5 or 10 sec. binning (T < 200 sec)

Quad-rate summed light curves (from T0-300s to T0+1000s)

Spectral Evolution
Spectra
Notes:
- 1) The fitting includes the systematic errors.
- 2) When the burst includes telescope slew time periods, the fitting uses an average response file made from multiple 5-s response files through out the slew time plus single time preiod for the non-slew times, and weighted by the total counts in the corresponding time period using addrmf. An average response file is needed becuase a spectral fit using the pre-slew DRM will introduce some errors in both a spectral shape and a normalization if the PHA file contains a lot of the slew/post-slew time interval.
- 3) For fits to more complicated models (e.g. a power-law over a cutoff power-law), the BAT team has decided to require a chi-square improvement of more than 6 for each extra dof.
Time averaged spectrum fit using the average DRM
Power-law model

Time interval is from   -1.304 sec. to    2.972 sec.

Spectral model in power-law:
------------------------------------------------------------
Parameters  : value       lower 90%   higher 90%
Photon index: 1.71518     ( -0.294775   0.314738 )
Norm@50keV  : 4.67777E-03    ( -0.000881097   0.000850935 )
------------------------------------------------------------
#Fit statistic  : Chi-Squared                   67.35     using 59 bins.
 Reduced chi-squared = 1.18158
# Null hypothesis probability of 1.64e-01 with 57 degrees of freedom

Photon flux (15-150 keV)    in 4.276 sec: 0.624618 ( -0.102047  0.10212 ) ph/cm2/s
Energy fluence (15-150 keV)             : 1.85011e-07 ( -3.57598e-08  3.65318e-08 ) ergs/cm2
Cutoff power-law model

Time interval is from   -1.304 sec. to    2.972 sec.
Spectral model in the cutoff power-law:
------------------------------------------------------------
Parameters  : value       lower 90%   higher 90%
Photon index: 1.69842     ( -1.25961   1.9755 )
Epeak [keV] : 840.849      ( -826.61 -826.62 )
Norm@50keV  : 4.77525E-03    ( -0.000981027   0.0172159 )
------------------------------------------------------------
#Fit statistic  : Chi-Squared                   67.35     using 59 bins.
 Reduced chi-squared = 1.20268
# Null hypothesis probability of 1.42e-01 with 56 degrees of freedom

Photon flux (15-150 keV)    in 4.276 sec: 0.624207 ( -0.10421  0.102063 ) ph/cm2/s
Energy fluence (15-150 keV)             : 1.84756e-07 ( -3.91234e-08  3.6125e-08 ) ergs/cm2
Band function

Time interval is from   -1.304 sec. to    2.972 sec.


Spectral model in the Band function:
------------------------------------------------------------
Parameters  : value       lower 90%   higher 90%
alpha       :    (     )
beta        :     (     )
Epeak [keV] :       (   )
Norm@50keV   :     (     )
------------------------------------------------------------

Photon flux (15-150 keV)    in  sec:  (    ) ph/cm2/s
Energy fluence (15-150 keV)             : 0 ( 0  0 ) ergs/cm2
Single BB

Spectral model blackbody:
------------------------------------------------------------
Parameters  : value    Lower 90%  Upper 90%
kT [keV]    : 12.4252  (-2.44777  3.17721)
R^2/D10^2   : 0.132378  (-0.0740683   0.160487)
(R is the radius in km and D10 is the distance to the source in units of 10 kpc)
------------------------------------------------------------
#Fit statistic  : Chi-Squared                   78.23     using 59 bins.
 Reduced chi-squared =
# Null hypothesis probability of 3.25e-02 with 57 degrees of freedom

Energy  Fluence     90% Error
[keV]   [erg/cm2]   [erg/cm2]
15- 25  1.852e-08   6.023e-09
25- 50  6.068e-08   1.688e-08
50-150  5.762e-08   2.172e-08
15-150  1.368e-07   3.575e-08
Thermal bremsstrahlung (OTTB)
Spectral model: thermal bremsstrahlung
------------------------------------------------------------
Parameters  : value         Lower 90%    Upper 90%
kT [keV]    : 139.664       (-69.9913      -137.256)
Norm        : 2.57639       (-0.464635     0.67658)
------------------------------------------------------------
#Fit statistic  : Chi-Squared                   67.76     using 59 bins.
 Reduced chi-squared =
# Null hypothesis probability of 1.56e-01 with 57 degrees of freedom

Energy  Fluence     90% Error
[keV]   [erg/cm2]   [erg/cm2]
15- 25  2.845e-08   1.558e-08
25- 50  5.218e-08   2.910e-08
50-150  9.992e-08   6.245e-08
15-150  1.805e-07   1.050e-07
Double BB

Spectral model: bbodyrad<1> + bbodyrad<2>
------------------------------------------------------------
Parameters  : value         Lower 90%    Upper 90%
kT1 [keV]   : 3.04930        (-1.79541      6.64225)
R1^2/D10^2  : 23.7796        (-20.5727      132.263)
kT2 [keV]   : 16.5732        (-4.5146      73.517)
R2^2/D10^2  : 4.20282E-02    (-0.0313078   0.0941176)
------------------------------------------------------------
#Fit statistic  : Chi-Squared                   68.90     using 59 bins.
 Reduced chi-squared =
# Null hypothesis probability of 9.84e-02 with 55 degrees of freedom

Energy  Fluence     90% Error
[keV]   [erg/cm2]   [erg/cm2]
15- 25  3.114e-08   1.660e-08
25- 50  4.711e-08   2.325e-08
50-150  8.531e-08   4.202e-08
15-150  1.636e-07   7.242e-08
Peak spectrum fit
Power-law model
Time interval is from   -0.152 sec. to    0.848 sec.

Spectral model in power-law:
------------------------------------------------------------
Parameters  : value       lower 90%   higher 90%
Photon index: 1.56004     ( -0.373015   0.39674 )
Norm@50keV  : 7.33184E-03    ( -0.00179196   0.00175792 )
------------------------------------------------------------
#Fit statistic  : Chi-Squared                   66.04     using 59 bins.
 Reduced chi-squared = 1.1586
# Null hypothesis probability of 1.93e-01 with 57 degrees of freedom

Photon flux (15-150 keV)    in 1 sec: 0.930918 ( -0.213908  0.214232 ) ph/cm2/s
Energy fluence (15-150 keV)             : 6.89334e-08 ( -1.78688e-08  1.83316e-08 ) ergs/cm2
Cutoff power-law model
Time interval is from   -0.152 sec. to    0.848 sec.
Spectral model in the cutoff power-law:
------------------------------------------------------------
Parameters  : value       lower 90%   higher 90%
Photon index: -1.23266E-02     ( -3.13305   1.82364 )
Epeak [keV] : 62.8684      ( -14.6765 -62.7733 )
Norm@50keV  : 4.62132E-02    ( -0.0469938   1.61633 )
------------------------------------------------------------
#Fit statistic  : Chi-Squared                   63.92     using 59 bins.
 Reduced chi-squared = 1.14143
# Null hypothesis probability of 2.18e-01 with 56 degrees of freedom

Photon flux (15-150 keV)    in 1 sec: 0.878142 ( -0.226049  0.224458 ) ph/cm2/s
Energy fluence (15-150 keV)             : 6.27581e-08 ( -1.80115e-08  1.96595e-08 ) ergs/cm2
Band function

Time interval is from   -0.152 sec. to    0.848 sec.


Spectral model in the Band function:
------------------------------------------------------------
Parameters  : value       lower 90%   higher 90%
alpha       :    (     )
beta        :     (     )
Epeak [keV] :       (   )
Norm@50keV   :     (     )
------------------------------------------------------------

Photon flux (15-150 keV)    in  sec:  (    ) ph/cm2/s
Energy fluence (15-150 keV)             : 0 ( 0  0 ) ergs/cm2
Single BB

Spectral model blackbody:
------------------------------------------------------------
Parameters  : value    Lower 90%  Upper 90%
kT [keV]    : 14.3980  (-3.04015  3.97905)
R^2/D10^2   : 0.128786  (-0.0750525   0.166464)
(R is the radius in km and D10 is the distance to the source in units of 10 kpc)
------------------------------------------------------------
#Fit statistic  : Chi-Squared                   64.70     using 59 bins.
 Reduced chi-squared =
# Null hypothesis probability of 2.26e-01 with 57 degrees of freedom

Energy  Fluence     90% Error
[keV]   [erg/cm2]   [erg/cm2]
15- 25  5.622e-09   2.643e-09
25- 50  2.149e-08   8.146e-09
50-150  2.975e-08   1.535e-08
15-150  5.687e-08   2.303e-08
Thermal bremsstrahlung (OTTB)

Spectral model: thermal bremsstrahlung
------------------------------------------------------------
Parameters  : value         Lower 90%    Upper 90%
kT [keV]    : 184.449       (-108.628      -178.969)
Norm        : 3.83526       (-0.884979     1.14088)
------------------------------------------------------------
#Fit statistic  : Chi-Squared                   65.19     using 59 bins.
 Reduced chi-squared =
# Null hypothesis probability of 2.13e-01 with 57 degrees of freedom

Energy  Fluence     90% Error
[keV]   [erg/cm2]   [erg/cm2]
15- 25  9.644e-09   5.595e-09
25- 50  1.838e-08   1.067e-08
50-150  3.925e-08   2.278e-08
15-150  6.728e-08   3.841e-08
Double BB

Spectral model: bbodyrad<1> + bbodyrad<2>
------------------------------------------------------------
Parameters  : value         Lower 90%    Upper 90%
kT1 [keV]   : 2.51724        (-2.48728      14.0669)
R1^2/D10^2  : 62.8329        (-65.1706      -65.1706)
kT2 [keV]   : 15.5945        (-3.56291      -15.5846)
R2^2/D10^2  : 9.26266E-02    (-0.0928046   0.116521)
------------------------------------------------------------
#Fit statistic  : Chi-Squared                   62.92     using 59 bins.
 Reduced chi-squared =
# Null hypothesis probability of 2.16e-01 with 55 degrees of freedom

Energy  Fluence     90% Error
[keV]   [erg/cm2]   [erg/cm2]
15- 25  8.305e-09   3.718e-09
25- 50  1.954e-08   1.094e-08
50-150  3.243e-08   2.057e-08
15-150  6.028e-08   3.510e-08
Pre-slew spectrum (Pre-slew PHA with pre-slew DRM)
Power-law model
Spectral model in power-law:
------------------------------------------------------------
Parameters  : value       lower 90%   higher 90%
Photon index: 1.71518     ( -0.294775   0.314738 )
Norm@50keV  : 4.67777E-03    ( -0.000881097   0.000850935 )
------------------------------------------------------------
#Fit statistic  : Chi-Squared                   67.35     using 59 bins.
 Reduced chi-squared =
# Null hypothesis probability of 1.64e-01 with 57 degrees of freedom

Photon flux (15-150 keV)    in 4.276 sec: 0.624591 ( -0.102041  0.102113 ) ph/cm2/s
Energy fluence (15-150 keV)             : 1.84984e-07 ( -3.57518e-08  3.65494e-08 ) ergs/cm2
Cutoff power-law model

Spectral model in the cutoff power-law:
------------------------------------------------------------
Parameters  : value       lower 90%   higher 90%
Photon index: 1.69781     ( -1.2595   1.97561 )
Epeak [keV] : 826.917      ( -826.12 -826.131 )
Norm@50keV  : 4.77887E-03    ( -0.000981037   0.0172159 )
------------------------------------------------------------
#Fit statistic  : Chi-Squared                   67.35     using 59 bins.
 Reduced chi-squared =
# Null hypothesis probability of 1.42e-01 with 56 degrees of freedom

Photon flux (15-150 keV)    in 4.276 sec: 0.624212 ( -0.105294  0.102 ) ph/cm2/s
Energy fluence (15-150 keV)             : 1.84884e-07 ( -3.92686e-08  3.65679e-08 ) ergs/cm2
Band function

Spectral model in the Band function:
------------------------------------------------------------
Parameters  : value       lower 90%   higher 90%
alpha       :    (     )
beta        :     (     )
Epeak [keV] :       (   )
Norm@50keV   :     (     )
------------------------------------------------------------

Photon flux (15-150 keV)    in  sec:  (    ) ph/cm2/s
Energy fluence (15-150 keV)             : 0 ( 0  0 ) ergs/cm2
S(25-50 keV) vs. S(50-100 keV) plot
S(25-50 keV)  = 5.05e-08
S(50-100 keV) = 6.16e-08
T90 vs. Hardness ratio plot
T90                                   = 3.7279999256134 sec.
Hardness ratio (energy fluence ratio) = 1.2198
Color vs. Color plot

Count Ratio  (25-50 keV) / (15-25 keV) = 1.41961
Count Ratio (50-100 keV) / (15-25 keV) = 0.754325
Mask shadow pattern
IMX = 6.416148507647752E-01, IMY = -1.012591665025407E-01
TIME vs. PHA plot around the trigger time

Blue+Cyan dotted lines: Time interval of the scaled map
From 0.000000 to 1.024000
TIME vs. DetID plot around the trigger time
Blue+Cyan dotted lines: Time interval of the scaled map
From 0.000000 to 1.024000
100 us light curve (15-350 keV)
Blue+Cyan dotted lines: Time interval of the scaled map
From 0.000000 to 1.024000
Spacecraft aspect plot
Bright source in the pre-burst/pre-slew/post-slew images
Pre-burst image of 15-350 keV band
Time interval of the image:
-239.992000 -1.304000

# RAcent  DECcent POSerr Theta    Phi  PeakCts   SNR AngSep     Name
#  [deg]    [deg]    ['] [deg]  [deg]                   [']
135.4300 -40.4738    6.1  52.9   12.3   1.6362   1.9    6.6	Vela X-1
189.8198  -2.8156    2.4  28.1  -86.6   1.8037   4.8 ------	UNKNOWN
188.3276 -19.9533    3.2  35.8  -57.2   1.5307   3.6 ------	UNKNOWN
213.4814  36.4109    3.8  55.1 -144.9   5.0286   3.1 ------	UNKNOWN
Pre-slew background subtracted image of 15-350 keV band
Time interval of the image:
-1.304000 2.972000

# RAcent  DECcent POSerr Theta    Phi  PeakCts   SNR AngSep     Name
#  [deg]    [deg]    ['] [deg]  [deg]                   [']
135.5550 -40.6035   20.9  52.9   12.1   0.0464   0.6    3.2	Vela X-1
133.4481   2.0971    2.3  29.8   69.9   0.2034   5.0 ------	UNKNOWN
149.6010 -24.3607    1.2  33.0    9.0   0.3040   9.4 ------	UNKNOWN
182.0644  29.1655    2.2  29.4 -158.6   0.1426   5.3 ------	UNKNOWN
205.4777  53.4457    2.6  58.6 -166.0   0.5559   4.5 ------	UNKNOWN
196.9903 -25.0231    2.1  45.2  -59.4   0.5052   5.3 ------	UNKNOWN
Post-slew image of 15-350 keV band
Time interval of the image:
64.708610 962.039800

# RAcent  DECcent POSerr Theta    Phi  PeakCts   SNR AngSep     Name
#  [deg]    [deg]    ['] [deg]  [deg]                   [']
135.5058 -40.5751    1.0  20.1    6.1   8.1694  11.7    1.6	Vela X-1
170.4575 -60.4927    5.9  38.9  -42.8   2.5294   1.9    8.9	Cen X-3
186.5932 -62.6475    9.1  45.5  -49.4   3.0272   1.3    7.6	GX 301-2
 92.5683 -33.0337    4.2  50.2   39.7  12.3287   2.7 ------	UNKNOWN
156.5385  28.8356    3.4  53.6  160.9  10.2342   3.4 ------	UNKNOWN
164.6153  26.2338    4.1  52.6  170.3   6.4796   2.9 ------	UNKNOWN
145.9252  -6.8460    3.8  17.9  141.3   2.1546   3.0 ------	UNKNOWN
187.8417  -3.8507    2.3  42.1 -139.7   6.5832   5.0 ------	UNKNOWN
193.6214  14.6383    3.0  58.0 -154.2  16.1165   3.8 ------	UNKNOWN
Plot creation:
Mon Oct 24 05:14:17 EDT 2022