Estimated redshift from machine learning (Ukwatta et al. 2016) - may take a few minute to calcaulte
Image
Pre-slew 15.0-350.0 keV image (Event data)
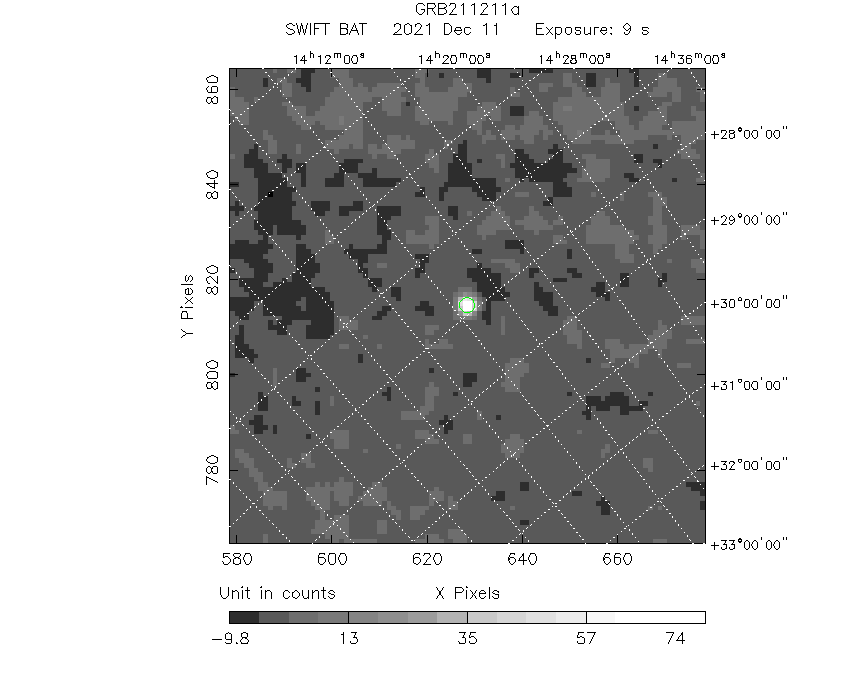
#   RAcent    DECcent   POSerr    Theta     Phi              Peak Cts       SNR   Name
  212.2718    27.8844   0.0046    41.5073   -53.3807        90.1512993     41.935 TRIG_01088940

Foreground time interval of the image:
 -0.004   8.829 (delta_t =   8.833 [sec])
Background time interval of the image:
-239.872  -0.004 (delta_t = 239.868 [sec])
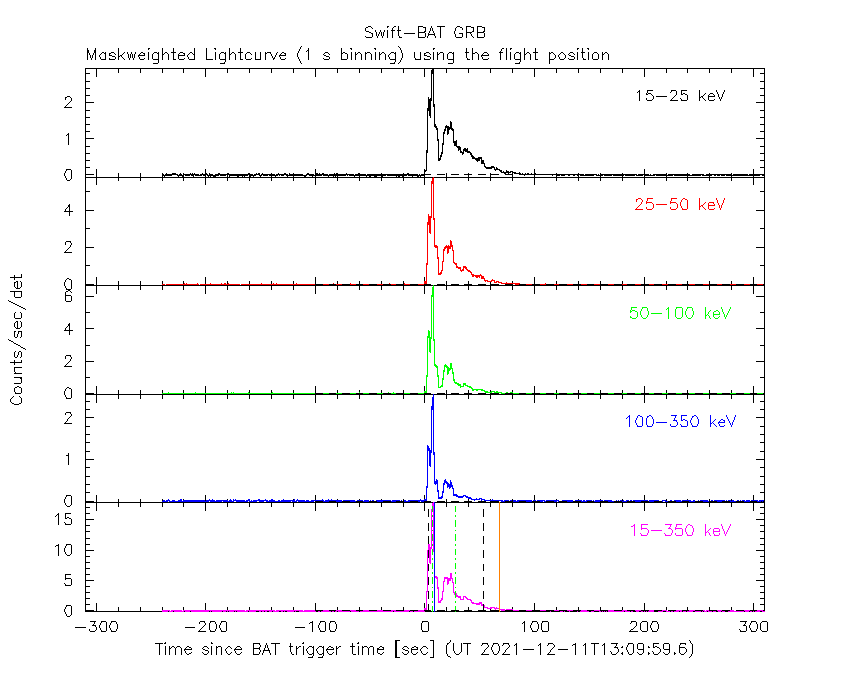
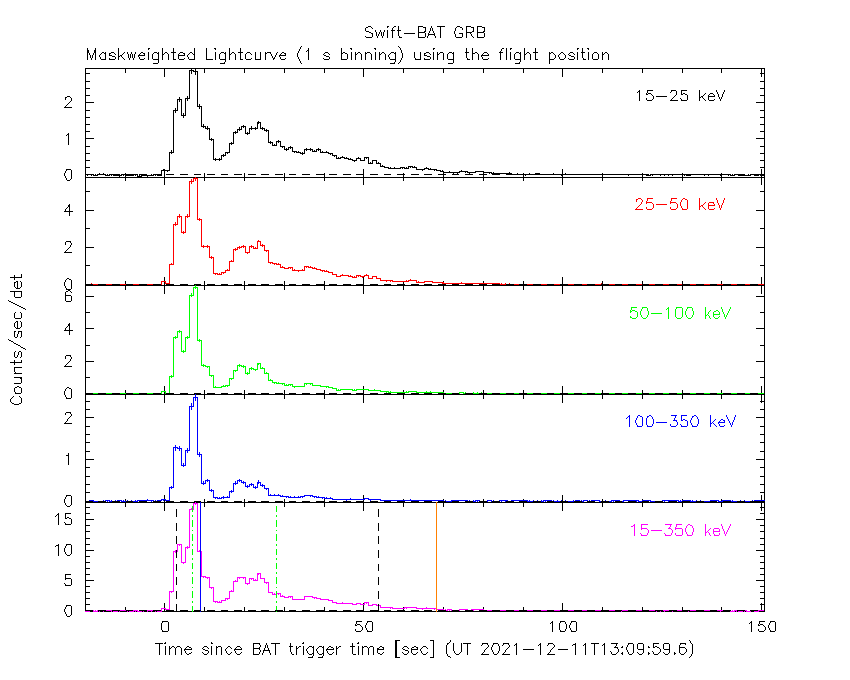
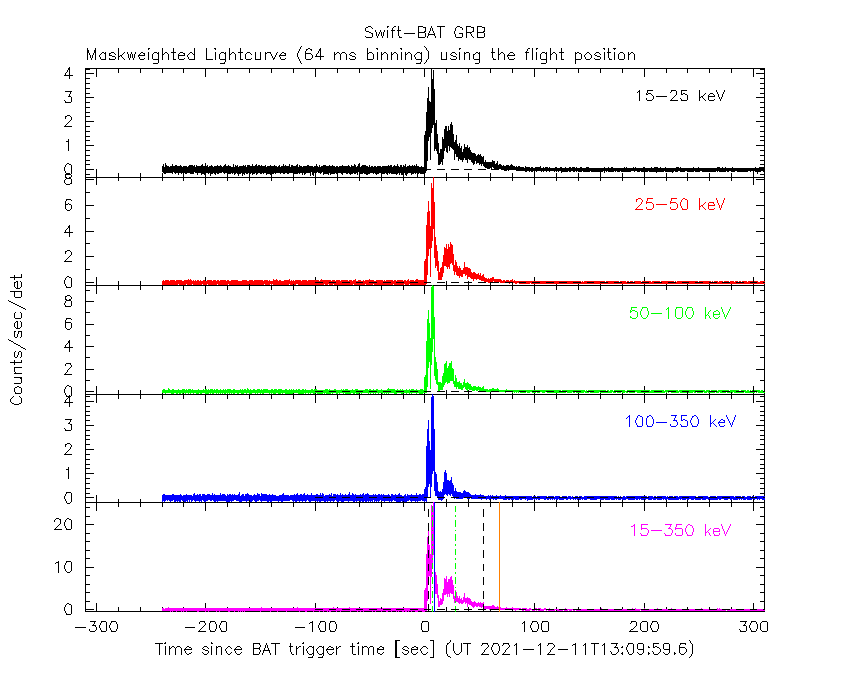
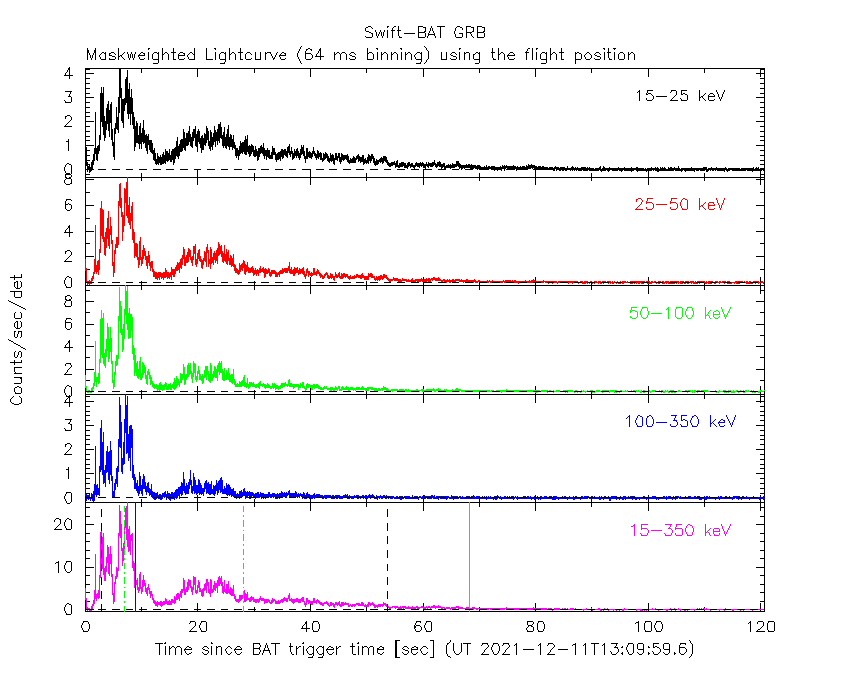
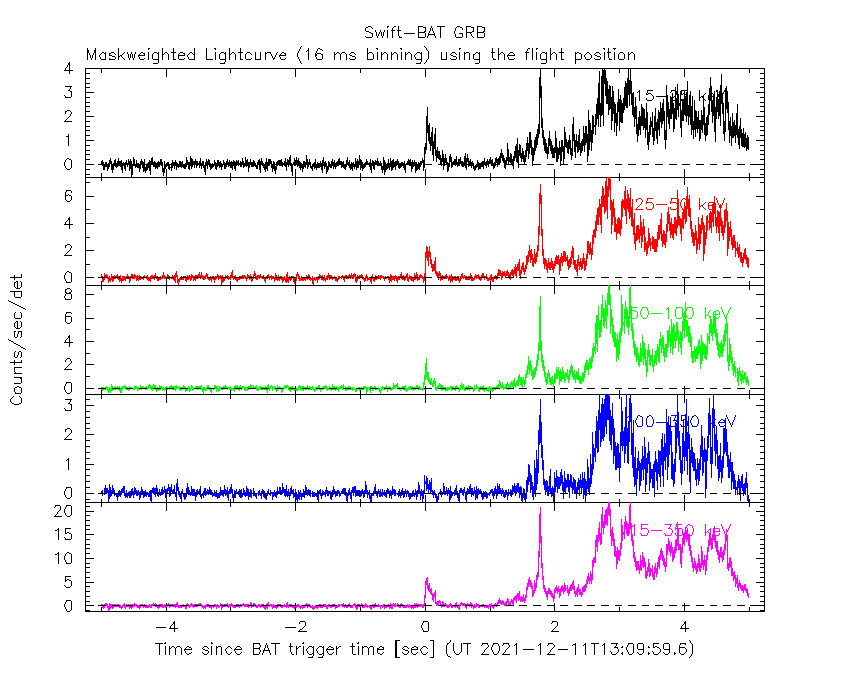
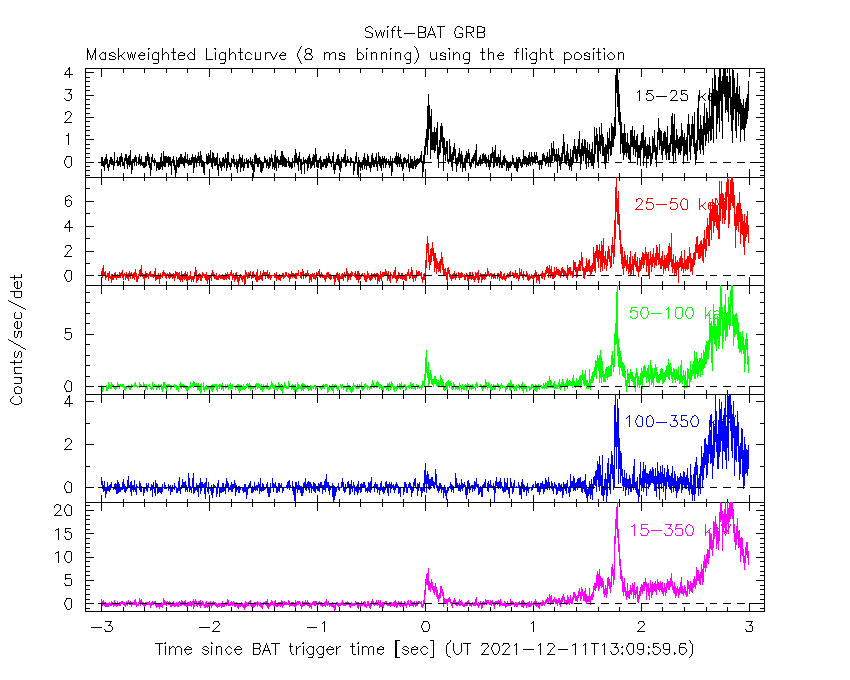
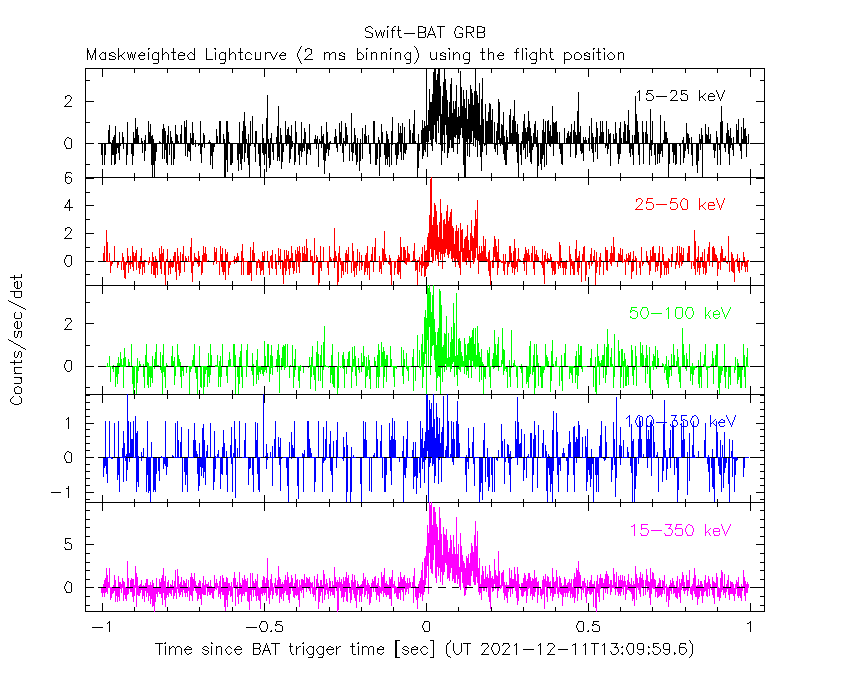
Lightcurves
Notes:
- 1) The mask-weighted light curves are using the flight position.
- 2) Multiple plots of different time binning/intervals are shown to cover all scenarios of short/long GRBs, rate/image triggers, and real/false positives.
- 3) For all the mask-weighted lightcurves, the y-axis units are counts/sec/det where a det is 0.4 x 0.4 = 0.16 sq cm.
- 4) The verticle lines correspond to following: green dotted lines are T50 interval, black dotted lines are T90 interval, blue solid line(s) is a spacecraft slew start time, and orange solid line(s) is a spacecraft slew end time.
- 5) Time of each bin is in the middle of the bin.
1 s binning
From T0-310 s to T0+310 s
From T100_start - 20 s to T100_end + 30 s
Full time interval

64 ms binning
Full time interval
From T100_start to T100_end
From T0-5 sec to T0+5 sec

16 ms binning
From T100_start-5 s to T100_start+5 s
8 ms binning
From T100_start-3 s to T100_start+3 s
2 ms binning
From T100_start-1 s to T100_start+1 s
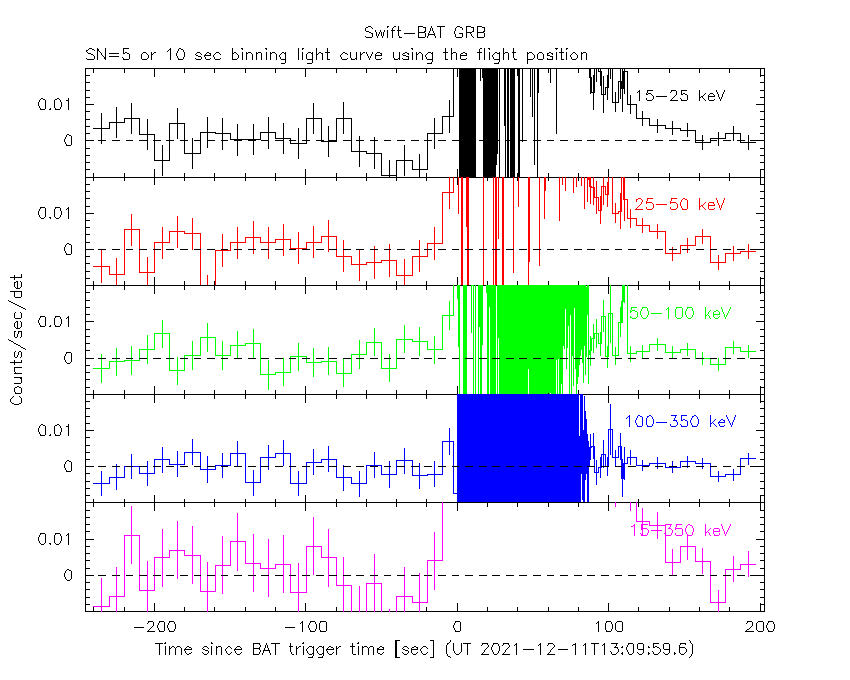
SN=5 or 10 sec. binning (whichever binning is satisfied first)

SN=5 or 10 sec. binning (T < 200 sec)
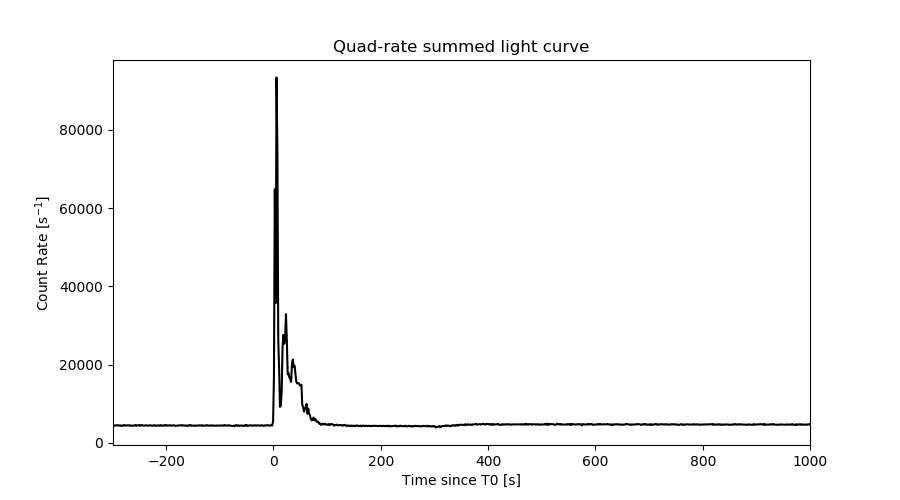
Quad-rate summed light curves (from T0-300s to T0+1000s)
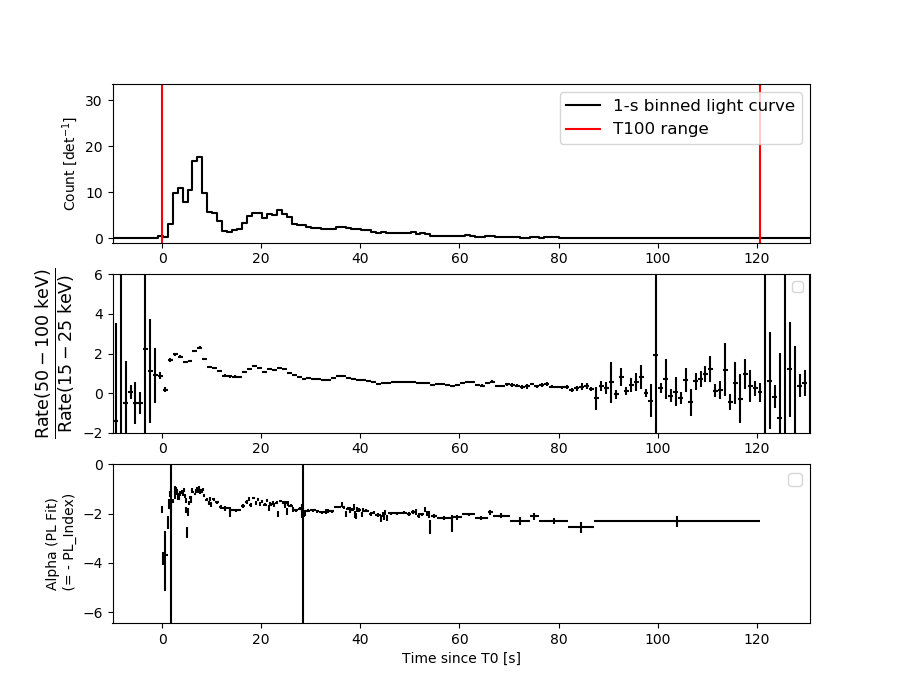
Spectral Evolution
Spectra
Notes:
- 1) The fitting includes the systematic errors.
- 2) When the burst includes telescope slew time periods, the fitting uses an average response file made from multiple 5-s response files through out the slew time plus single time preiod for the non-slew times, and weighted by the total counts in the corresponding time period using addrmf. An average response file is needed becuase a spectral fit using the pre-slew DRM will introduce some errors in both a spectral shape and a normalization if the PHA file contains a lot of the slew/post-slew time interval.
- 3) For fits to more complicated models (e.g. a power-law over a cutoff power-law), the BAT team has decided to require a chi-square improvement of more than 6 for each extra dof.
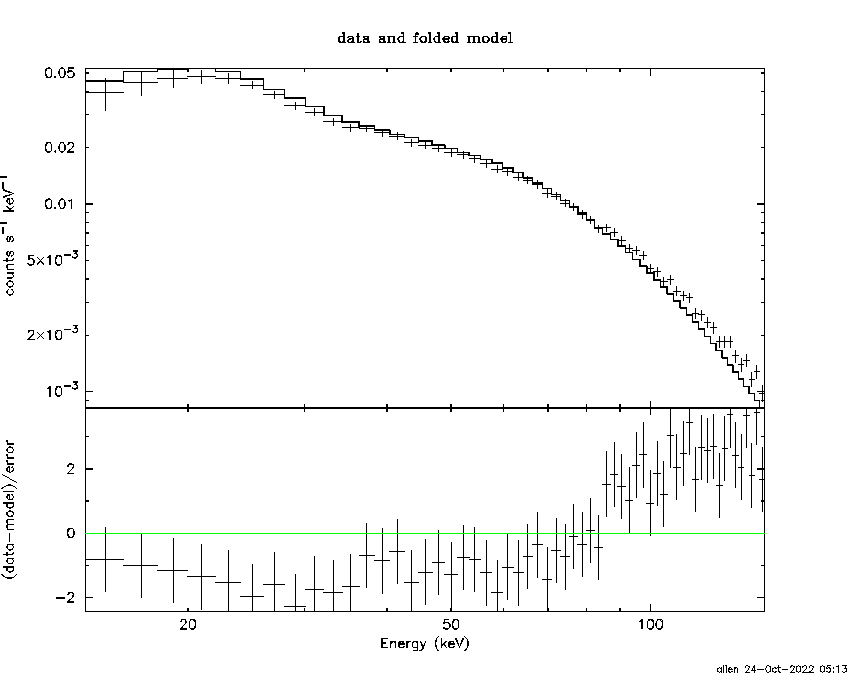
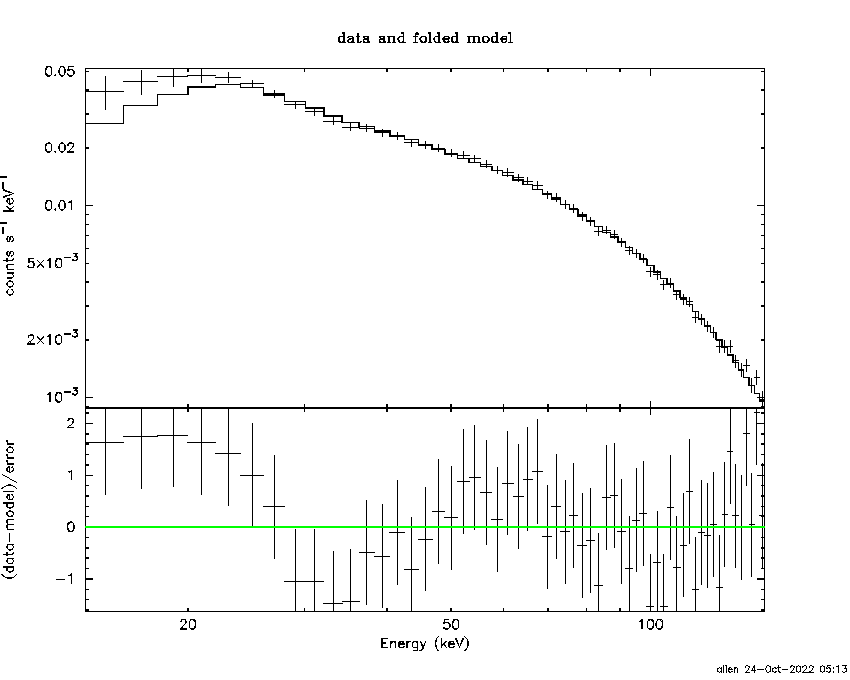
Time averaged spectrum fit using the average DRM
Power-law model

Time interval is from   -0.004 sec. to  120.712 sec.

Spectral model in power-law:
------------------------------------------------------------
Parameters  : value       lower 90%   higher 90%
Photon index: 1.51526     ( -0.0203569   0.0202739 )
Norm@50keV  : 0.127390    ( -0.00157609   0.0015727 )
------------------------------------------------------------
#Fit statistic  : Chi-Squared                   29.53     using 59 bins.
 Reduced chi-squared = 0.51807
# Null hypothesis probability of 9.99e-01 with 57 degrees of freedom

Photon flux (15-150 keV)    in 120.7 sec: 15.9699 ( -0.2528  0.2538 ) ph/cm2/s
Energy fluence (15-150 keV)             : 0.000145524 ( -1.62222e-06  1.62461e-06 ) ergs/cm2
Cutoff power-law model

Time interval is from   -0.004 sec. to  120.712 sec.
Spectral model in the cutoff power-law:
------------------------------------------------------------
Parameters  : value       lower 90%   higher 90%
Photon index: 1.44200     ( -0.0838663   0.0663039 )
Epeak [keV] : 512.674      ( -234.723 -512.768 )
Norm@50keV  : 0.135641    ( -0.00563691   0.00989233 )
------------------------------------------------------------
#Fit statistic  : Chi-Squared                   27.26     using 59 bins.
 Reduced chi-squared = 0.486786
# Null hypothesis probability of 1.00e+00 with 56 degrees of freedom

Photon flux (15-150 keV)    in 120.7 sec: 15.8328 ( -0.2916  0.2933 ) ph/cm2/s
Energy fluence (15-150 keV)             : 0.000145184 ( -1.6657e-06  1.66374e-06 ) ergs/cm2
Band function

Time interval is from   -0.004 sec. to  120.712 sec.


Spectral model in the Band function:
------------------------------------------------------------
Parameters  : value       lower 90%   higher 90%
alpha       :    (     )
beta        :     (     )
Epeak [keV] :       (   )
Norm@50keV   :     (     )
------------------------------------------------------------

Photon flux (15-150 keV)    in  sec:  (    ) ph/cm2/s
Energy fluence (15-150 keV)             : 0 ( 0  0 ) ergs/cm2
Single BB

Spectral model blackbody:
------------------------------------------------------------
Parameters  : value    Lower 90%  Upper 90%
kT [keV]    : 21.9950  (  )
R^2/D10^2   : 0.448797  (   )
(R is the radius in km and D10 is the distance to the source in units of 10 kpc)
------------------------------------------------------------
#Fit statistic  : Chi-Squared                 1922.70     using 59 bins.
 Reduced chi-squared =
# Null hypothesis probability of 0.00e+00 with 57 degrees of freedom

Energy  Fluence     90% Error
[keV]   [erg/cm2]   [erg/cm2]
15- 25  4.850e-06   1.243e-07
25- 50  2.565e-05   5.371e-07
50-150  9.269e-05   1.207e-06
15-150  1.232e-04   1.388e-06
Thermal bremsstrahlung (OTTB)
Spectral model: thermal bremsstrahlung
------------------------------------------------------------
Parameters  : value         Lower 90%    Upper 90%
kT [keV]    : 199.363       (      )
Norm        : 67.6541       (     )
------------------------------------------------------------
#Fit statistic  : Chi-Squared                  195.09     using 59 bins.
 Reduced chi-squared =
# Null hypothesis probability of 5.28e-17 with 57 degrees of freedom

Energy  Fluence     90% Error
[keV]   [erg/cm2]   [erg/cm2]
15- 25  2.033e-05   3.259e-07
25- 50  3.912e-05   5.552e-07
50-150  8.579e-05   1.165e-06
15-150  1.452e-04   2.173e-06
Double BB
Spectral model: bbodyrad<1> + bbodyrad<2>
------------------------------------------------------------
Parameters  : value         Lower 90%    Upper 90%
kT1 [keV]   : 8.98365        (-0.365733      0.379228)
R1^2/D10^2  : 6.90942        (-0.921893      1.09458)
kT2 [keV]   : 34.4279        (-1.32941      1.50798)
R2^2/D10^2  : 7.61731E-02    (-0.0107856   0.0116934)
------------------------------------------------------------
#Fit statistic  : Chi-Squared                   50.60     using 59 bins.
 Reduced chi-squared =
# Null hypothesis probability of 6.43e-01 with 55 degrees of freedom

Energy  Fluence     90% Error
[keV]   [erg/cm2]   [erg/cm2]
15- 25  1.465e-05   7.121e-07
25- 50  3.789e-05   7.664e-07
50-150  8.998e-05   1.460e-06
15-150  1.425e-04   1.871e-06
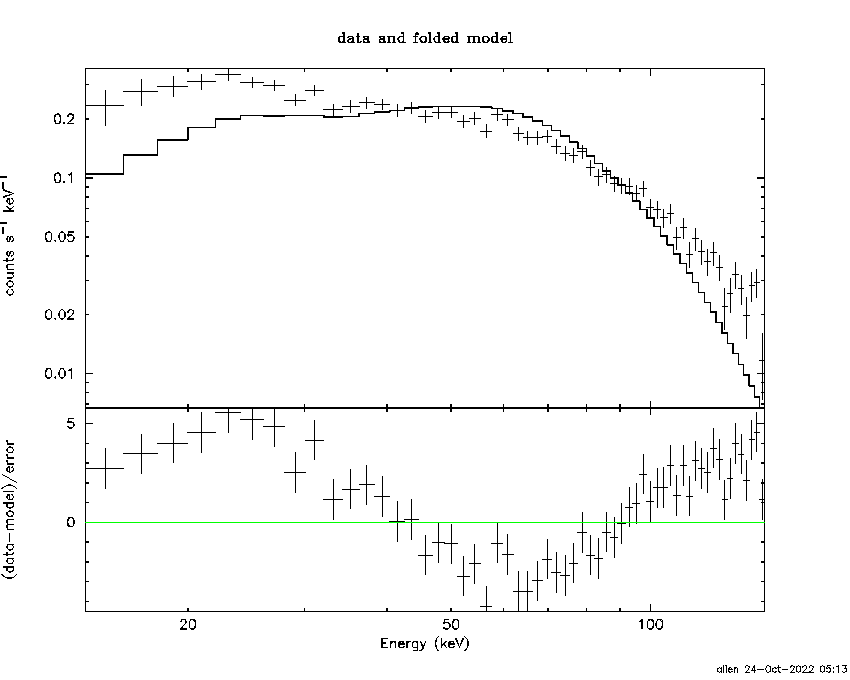
Peak spectrum fit
Power-law model

Time interval is from    6.864 sec. to    7.864 sec.

Spectral model in power-law:
------------------------------------------------------------
Parameters  : value       lower 90%   higher 90%
Photon index: 1.03556     ( -0.033601   0.0334794 )
Norm@50keV  : 1.34635    ( -0.0261386   0.0261007 )
------------------------------------------------------------
#Fit statistic  : Chi-Squared                   58.33     using 59 bins.
 Reduced chi-squared = 1.02333
# Null hypothesis probability of 4.26e-01 with 57 degrees of freedom

Photon flux (15-150 keV)    in 1 sec: 6.71672 (    ) ph/cm2/s
Energy fluence (15-150 keV)             : 1.4381e-05 ( -2.80971e-07  2.81229e-07 ) ergs/cm2
Cutoff power-law model

Time interval is from    6.864 sec. to    7.864 sec.
Spectral model in the cutoff power-law:
------------------------------------------------------------
Parameters  : value       lower 90%   higher 90%
Photon index: 0.733944     ( -0.145742   0.141499 )
Epeak [keV] : 260.076      ( -64.1228 166.86 )
Norm@50keV  : 1.79165    ( -0.220177   0.257982 )
------------------------------------------------------------
#Fit statistic  : Chi-Squared                   44.78     using 59 bins.
 Reduced chi-squared = 0.799643
# Null hypothesis probability of 8.59e-01 with 56 degrees of freedom

Photon flux (15-150 keV)    in 1 sec: 153.088 ( -3.269  3.277 ) ph/cm2/s
Energy fluence (15-150 keV)             : 1.42722e-05 ( -2.8889e-07  2.88424e-07 ) ergs/cm2
Band function

Time interval is from    6.864 sec. to    7.864 sec.


Spectral model in the Band function:
------------------------------------------------------------
Parameters  : value       lower 90%   higher 90%
alpha       :    (     )
beta        :     (     )
Epeak [keV] :       (   )
Norm@50keV   :     (     )
------------------------------------------------------------

Photon flux (15-150 keV)    in  sec:  (    ) ph/cm2/s
Energy fluence (15-150 keV)             : 0 ( 0  0 ) ergs/cm2
Single BB
Spectral model blackbody:
------------------------------------------------------------
Parameters  : value    Lower 90%  Upper 90%
kT [keV]    : 22.9913  (  )
R^2/D10^2   : 4.84987  (   )
(R is the radius in km and D10 is the distance to the source in units of 10 kpc)
------------------------------------------------------------
#Fit statistic  : Chi-Squared                  433.17     using 59 bins.
 Reduced chi-squared =
# Null hypothesis probability of 2.93e-59 with 57 degrees of freedom

Energy  Fluence     90% Error
[keV]   [erg/cm2]   [erg/cm2]
15- 25  4.647e-07   1.850e-08
25- 50  2.521e-06   7.250e-08
50-150  9.953e-06   2.760e-07
15-150  1.294e-05   2.650e-07
Thermal bremsstrahlung (OTTB)

Spectral model: thermal bremsstrahlung
------------------------------------------------------------
Parameters  : value         Lower 90%    Upper 90%
kT [keV]    : 199.363       (      )
Norm        : 660.512       (     )
------------------------------------------------------------
#Fit statistic  : Chi-Squared                  748.85     using 59 bins.
 Reduced chi-squared =
# Null hypothesis probability of 2.70e-121 with 57 degrees of freedom

Energy  Fluence     90% Error
[keV]   [erg/cm2]   [erg/cm2]
15- 25  1.645e-06   3.200e-08
25- 50  3.164e-06   6.350e-08
50-150  6.939e-06   1.395e-07
15-150  1.175e-05   2.400e-07
Double BB

Spectral model: bbodyrad<1> + bbodyrad<2>
------------------------------------------------------------
Parameters  : value         Lower 90%    Upper 90%
kT1 [keV]   : 10.4614        (-0.983914      1.04825)
R1^2/D10^2  : 31.5938        (-6.91461      9.7527)
kT2 [keV]   : 39.9068        (-3.89047      5.52223)
R2^2/D10^2  : 0.705206    (-0.23266   0.278193)
------------------------------------------------------------
#Fit statistic  : Chi-Squared                   47.84     using 59 bins.
 Reduced chi-squared =
# Null hypothesis probability of 7.42e-01 with 55 degrees of freedom

Energy  Fluence     90% Error
[keV]   [erg/cm2]   [erg/cm2]
15- 25  8.591e-07   5.870e-08
25- 50  2.879e-06   1.355e-07
50-150  1.055e-05   6.300e-07
15-150  1.429e-05   7.750e-07
Pre-slew spectrum (Pre-slew PHA with pre-slew DRM)
Power-law model

Spectral model in power-law:
------------------------------------------------------------
Parameters  : value       lower 90%   higher 90%
Photon index: 1.19052     ( -0.0228866   0.0227961 )
Norm@50keV  : 0.704338    ( -0.00969081   0.00967091 )
------------------------------------------------------------
#Fit statistic  : Chi-Squared                   43.53     using 59 bins.
 Reduced chi-squared =
# Null hypothesis probability of 9.05e-01 with 57 degrees of freedom

Photon flux (15-150 keV)    in 8.833 sec: 82.5662 ( -1.266  1.26919 ) ph/cm2/s
Energy fluence (15-150 keV)             : 6.32891e-05 ( -7.85228e-07  7.85268e-07 ) ergs/cm2
Cutoff power-law model

Spectral model in the cutoff power-law:
------------------------------------------------------------
Parameters  : value       lower 90%   higher 90%
Photon index: 0.991418     ( -0.0974451   0.0956431 )
Epeak [keV] : 334.213      ( -86.8781 234.854 )
Norm@50keV  : 0.839284    ( -0.0665495   0.07334 )
------------------------------------------------------------
#Fit statistic  : Chi-Squared                   30.80     using 59 bins.
 Reduced chi-squared =
# Null hypothesis probability of 9.98e-01 with 56 degrees of freedom

Photon flux (15-150 keV)    in 8.833 sec: 81.3658 ( -1.3663  1.3737 ) ph/cm2/s
Energy fluence (15-150 keV)             : 6.31179e-05 ( 0  0 ) ergs/cm2
Band function

Spectral model in the Band function:
------------------------------------------------------------
Parameters  : value       lower 90%   higher 90%
alpha       :    (     )
beta        :     (     )
Epeak [keV] :       (   )
Norm@50keV   :     (     )
------------------------------------------------------------

Photon flux (15-150 keV)    in  sec:  (    ) ph/cm2/s
Energy fluence (15-150 keV)             : 0 ( 0  0 ) ergs/cm2
S(25-50 keV) vs. S(50-100 keV) plot
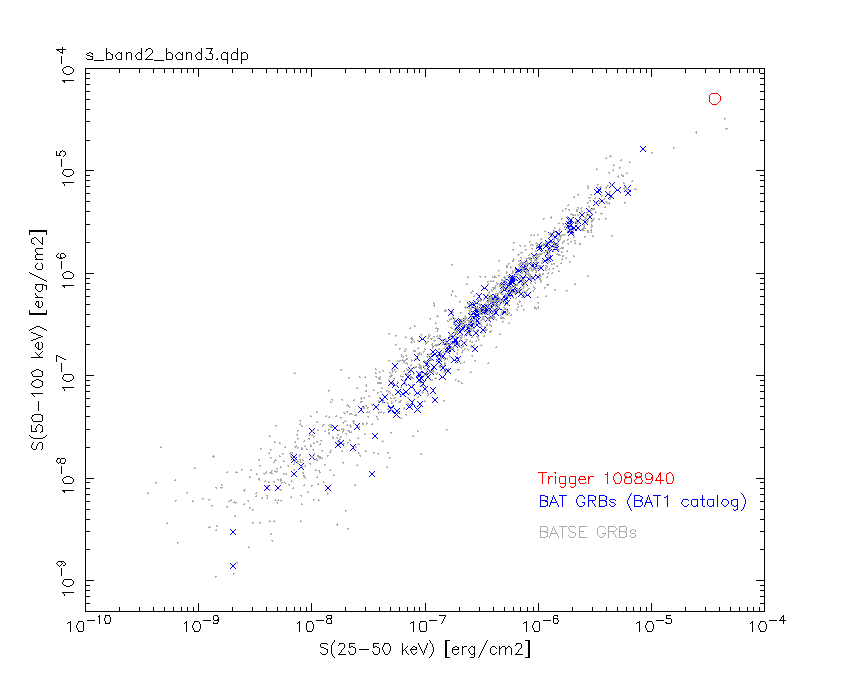
S(25-50 keV)  = 3.62e-05
S(50-100 keV) = 5.07e-05
T90 vs. Hardness ratio plot
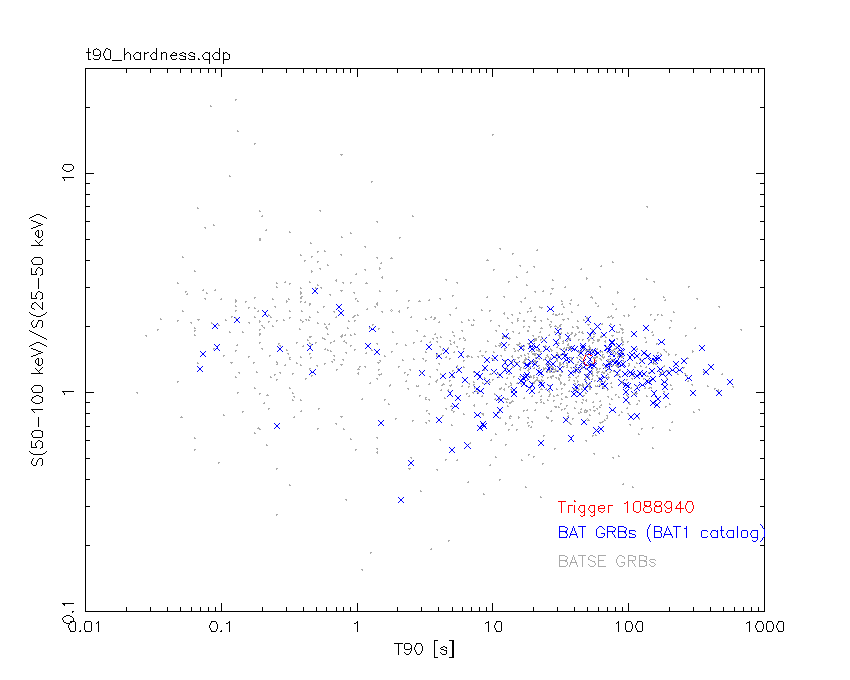
T90                                   = 50.7119998931885 sec.
Hardness ratio (energy fluence ratio) = 1.40055
Color vs. Color plot

Count Ratio  (25-50 keV) / (15-25 keV) = 1.44987
Count Ratio (50-100 keV) / (15-25 keV) = 1.16913
Mask shadow pattern

IMX = 5.278701697646530E-01, IMY = 7.102783141836446E-01
TIME vs. PHA plot around the trigger time

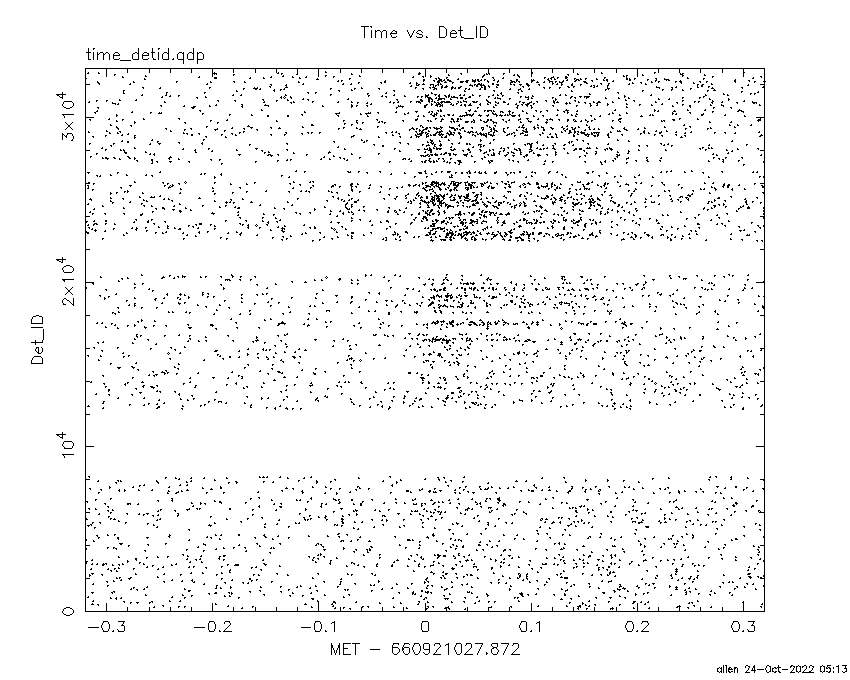
TIME vs. DetID plot around the trigger time
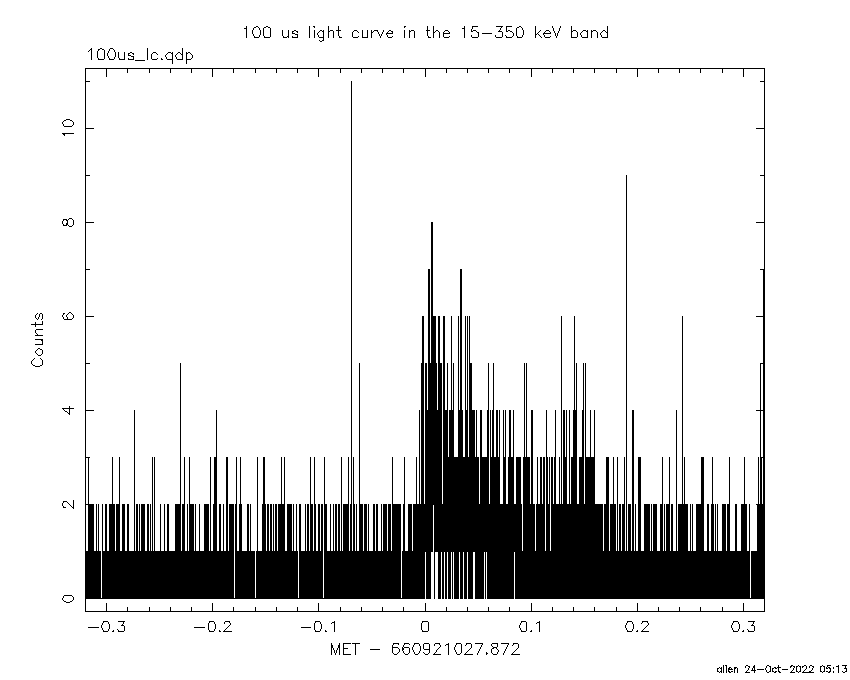
100 us light curve (15-350 keV)
Spacecraft aspect plot

Bright source in the pre-burst/pre-slew/post-slew images
Pre-burst image of 15-350 keV band
Time interval of the image:
-239.872000 -0.004000

# RAcent  DECcent POSerr Theta    Phi  PeakCts   SNR AngSep     Name
#  [deg]    [deg]    ['] [deg]  [deg]                   [']
254.3096  35.2453    5.3  42.3 -109.0   2.1191   2.1    9.3	Her X-1
299.5713  35.1816    2.3  57.8 -153.2   6.7138   5.1    1.5	Cyg X-1
308.0181  40.8896   33.1  55.4 -163.3   0.2755   0.3    5.6	Cyg X-3
147.7311  44.6136    2.6  38.7   34.6   1.9117   4.4 ------	UNKNOWN
153.0440  58.1247    2.7  25.7   44.3   1.2440   4.3 ------	UNKNOWN
321.5356  59.1191    3.0  43.0  175.7   1.6180   3.9 ------	UNKNOWN
219.3348  60.8968    2.9   9.6  -82.1   0.8837   4.0 ------	UNKNOWN
290.9543  44.0271    2.8  46.9 -150.7   1.9664   4.1 ------	UNKNOWN
201.6065  20.9066    2.7  48.6  -39.7   3.3819   4.3 ------	UNKNOWN
Pre-slew background subtracted image of 15-350 keV band
Time interval of the image:
-0.004000 8.828590

# RAcent  DECcent POSerr Theta    Phi  PeakCts   SNR AngSep     Name
#  [deg]    [deg]    ['] [deg]  [deg]                   [']
254.5773  35.2081   27.5  42.4 -109.3  -1.5751  -0.4   10.0	Her X-1
299.6359  35.2928   11.1  57.7 -153.3   5.3745   1.0    5.9	Cyg X-1
308.1691  41.0011    5.3  55.4 -163.4  -4.5042  -2.2    3.9	Cyg X-3
166.5590  28.8358    4.0  47.0    4.8   2.5673   2.9 ------	UNKNOWN
291.2931  42.3066    2.9  48.6 -149.9   6.9550   4.0 ------	UNKNOWN
189.5919  14.4932    3.6  56.1  -26.1  13.2183   3.2 ------	UNKNOWN
212.2718  27.8844    0.3  41.5  -53.4  90.1559  41.9 ------	UNKNOWN
Post-slew image of 15-350 keV band
Time interval of the image:
68.228590 298.228600

# RAcent  DECcent POSerr Theta    Phi  PeakCts   SNR AngSep     Name
#  [deg]    [deg]    ['] [deg]  [deg]                   [']
254.4374  35.3701    3.0  36.4 -156.3   1.3132   3.8    1.9	Her X-1
212.2672  27.8813    0.6   0.0  -10.9   4.1266  18.6 ------	UNKNOWN
206.7197  11.5751    3.6  17.1  -24.9   0.7244   3.2 ------	UNKNOWN
218.3481  20.2646    2.5   9.4  -81.0   1.1050   4.7 ------	UNKNOWN
262.8109  23.5846    3.7  45.4 -140.2   1.7720   3.2 ------	UNKNOWN
Plot creation:
Mon Oct 24 05:13:38 EDT 2022