Estimated redshift from machine learning (Ukwatta et al. 2016) - may take a few minute to calcaulte
Image
Pre-slew 15.0-350.0 keV image (Event data)

#   RAcent    DECcent   POSerr    Theta     Phi              Peak Cts       SNR   Name
   78.8906     0.9128   0.0153     7.1543    72.9221         2.8357197     12.547 TRIG_01090472

Foreground time interval of the image:
-129.340  15.181 (delta_t = 144.521 [sec])
Background time interval of the image:
-239.120 -129.340 (delta_t = 109.780 [sec])
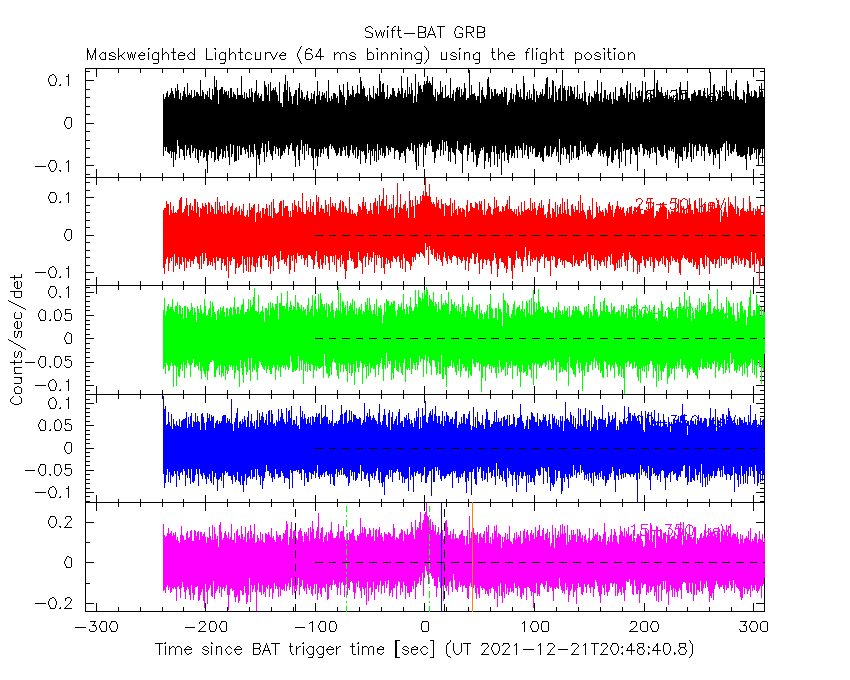
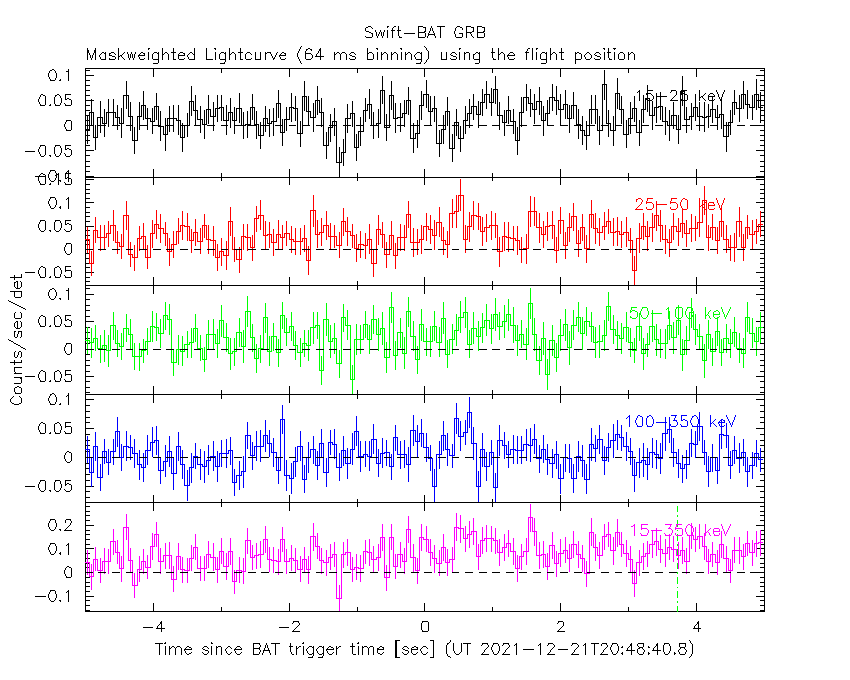
Lightcurves
Notes:
- 1) The mask-weighted light curves are using the flight position.
- 2) Multiple plots of different time binning/intervals are shown to cover all scenarios of short/long GRBs, rate/image triggers, and real/false positives.
- 3) For all the mask-weighted lightcurves, the y-axis units are counts/sec/det where a det is 0.4 x 0.4 = 0.16 sq cm.
- 4) The verticle lines correspond to following: green dotted lines are T50 interval, black dotted lines are T90 interval, blue solid line(s) is a spacecraft slew start time, and orange solid line(s) is a spacecraft slew end time.
- 5) Time of each bin is in the middle of the bin.
1 s binning
From T0-310 s to T0+310 s

From T100_start - 20 s to T100_end + 30 s

Full time interval

64 ms binning
Full time interval
From T100_start to T100_end

From T0-5 sec to T0+5 sec
16 ms binning
From T100_start-5 s to T100_start+5 s

Blue+Cyan dotted lines: Time interval of the scaled map
From 0.000000 to 1.024000
8 ms binning
From T100_start-3 s to T100_start+3 s
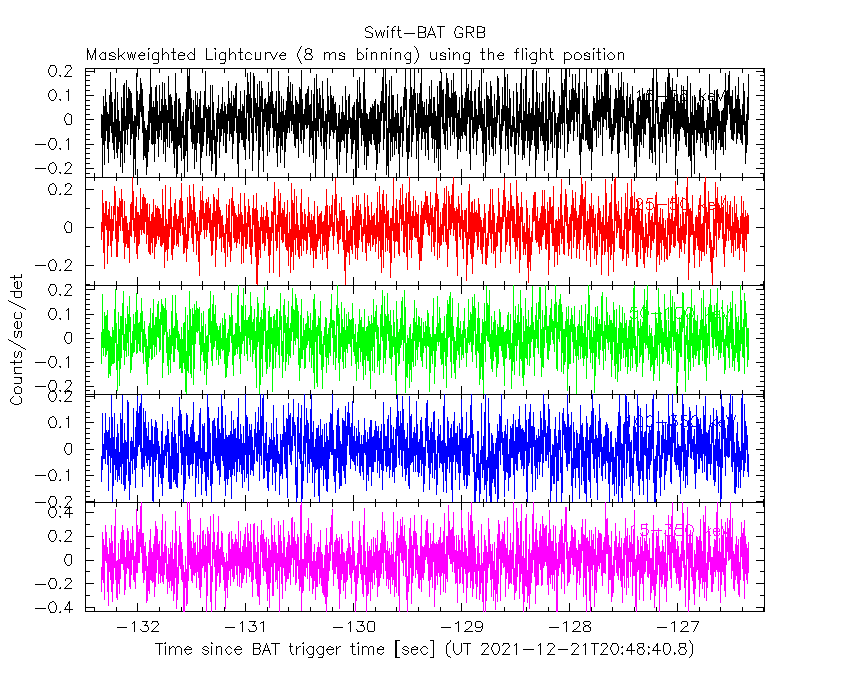
Blue+Cyan dotted lines: Time interval of the scaled map
From 0.000000 to 1.024000
2 ms binning
From T100_start-1 s to T100_start+1 s

Blue+Cyan dotted lines: Time interval of the scaled map
From 0.000000 to 1.024000
SN=5 or 10 sec. binning (whichever binning is satisfied first)

SN=5 or 10 sec. binning (T < 200 sec)

Quad-rate summed light curves (from T0-300s to T0+1000s)

Spectral Evolution
Spectra
Notes:
- 1) The fitting includes the systematic errors.
- 2) When the burst includes telescope slew time periods, the fitting uses an average response file made from multiple 5-s response files through out the slew time plus single time preiod for the non-slew times, and weighted by the total counts in the corresponding time period using addrmf. An average response file is needed becuase a spectral fit using the pre-slew DRM will introduce some errors in both a spectral shape and a normalization if the PHA file contains a lot of the slew/post-slew time interval.
- 3) For fits to more complicated models (e.g. a power-law over a cutoff power-law), the BAT team has decided to require a chi-square improvement of more than 6 for each extra dof.
Time averaged spectrum fit using the average DRM
Power-law model

Time interval is from -129.340 sec. to   26.356 sec.

Spectral model in power-law:
------------------------------------------------------------
Parameters  : value       lower 90%   higher 90%
Photon index: 1.27647     ( -0.156383   0.155253 )
Norm@50keV  : 1.11758E-03    ( -0.000102293   0.000102133 )
------------------------------------------------------------
#Fit statistic  : Chi-Squared                   51.38     using 59 bins.
 Reduced chi-squared = 0.901404
# Null hypothesis probability of 6.85e-01 with 57 degrees of freedom

Photon flux (15-150 keV)    in 155.7 sec: 0.132771 ( -0.012168  0.012179 ) ph/cm2/s
Energy fluence (15-150 keV)             : 1.72981e-06 ( -1.7918e-07  1.81532e-07 ) ergs/cm2
Cutoff power-law model

Time interval is from -129.340 sec. to   26.356 sec.
Spectral model in the cutoff power-law:
------------------------------------------------------------
Parameters  : value       lower 90%   higher 90%
Photon index: 0.438363     ( -0.845839   0.697526 )
Epeak [keV] : 91.1456      ( -24.4686 185.423 )
Norm@50keV  : 2.99960E-03    ( -0.00165692   0.00496774 )
------------------------------------------------------------
#Fit statistic  : Chi-Squared                   47.06     using 59 bins.
 Reduced chi-squared = 0.840357
# Null hypothesis probability of 7.97e-01 with 56 degrees of freedom

Photon flux (15-150 keV)    in 155.7 sec: 0.127684 ( -0.012992  0.012923 ) ph/cm2/s
Energy fluence (15-150 keV)             : 1.59312e-06 ( -1.90281e-07  2.13838e-07 ) ergs/cm2
Band function

Time interval is from -129.340 sec. to   26.356 sec.


Spectral model in the Band function:
------------------------------------------------------------
Parameters  : value       lower 90%   higher 90%
alpha       :    (     )
beta        :     (     )
Epeak [keV] :       (   )
Norm@50keV   :     (     )
------------------------------------------------------------

Photon flux (15-150 keV)    in  sec:  (    ) ph/cm2/s
Energy fluence (15-150 keV)             : 0 ( 0  0 ) ergs/cm2
Single BB

Spectral model blackbody:
------------------------------------------------------------
Parameters  : value    Lower 90%  Upper 90%
kT [keV]    : 15.8212  (-1.66889  1.94656)
R^2/D10^2   : 1.31794E-02  (-0.00431261   0.00613836)
(R is the radius in km and D10 is the distance to the source in units of 10 kpc)
------------------------------------------------------------
#Fit statistic  : Chi-Squared                   58.10     using 59 bins.
 Reduced chi-squared =
# Null hypothesis probability of 4.35e-01 with 57 degrees of freedom

Energy  Fluence     90% Error
[keV]   [erg/cm2]   [erg/cm2]
15- 25  1.065e-07   1.982e-08
25- 50  4.437e-07   5.418e-08
50-150  7.729e-07   1.415e-07
15-150  1.323e-06   1.789e-07
Thermal bremsstrahlung (OTTB)

Spectral model: thermal bremsstrahlung
------------------------------------------------------------
Parameters  : value         Lower 90%    Upper 90%
kT [keV]    : 200.000       (-31.3711      -200)
Norm        : 0.545172       (-0.0497675     0.0497675)
------------------------------------------------------------
#Fit statistic  : Chi-Squared                   56.50     using 59 bins.
 Reduced chi-squared =
# Null hypothesis probability of 4.94e-01 with 57 degrees of freedom

Energy  Fluence     90% Error
[keV]   [erg/cm2]   [erg/cm2]
15- 25  2.113e-07   2.756e-08
25- 50  4.065e-07   1.622e-07
50-150  8.916e-07   4.518e-07
15-150  1.510e-06   6.954e-07
Double BB

Spectral model: bbodyrad<1> + bbodyrad<2>
------------------------------------------------------------
Parameters  : value         Lower 90%    Upper 90%
kT1 [keV]   : 11.3628        (-3.82369      2.97261)
R1^2/D10^2  : 3.10162E-02        (-0.0159564      0.0543318)
kT2 [keV]   : 51.1152        (-25.4346      -47.0013)
R2^2/D10^2  : 1.96399E-04    (-0.000173156   0.0034468)
------------------------------------------------------------
#Fit statistic  : Chi-Squared                   45.31     using 59 bins.
 Reduced chi-squared =
# Null hypothesis probability of 8.21e-01 with 55 degrees of freedom

Energy  Fluence     90% Error
[keV]   [erg/cm2]   [erg/cm2]
15- 25  1.412e-07   5.601e-08
25- 50  4.465e-07   1.738e-07
50-150  1.064e-06   5.350e-07
15-150  1.652e-06   7.012e-07
Peak spectrum fit
Power-law model

Time interval is from    0.236 sec. to    1.236 sec.

Spectral model in power-law:
------------------------------------------------------------
Parameters  : value       lower 90%   higher 90%
Photon index: 1.14920     ( -0.294944   0.286969 )
Norm@50keV  : 7.77692E-03    ( -0.00137978   0.00137884 )
------------------------------------------------------------
#Fit statistic  : Chi-Squared                   59.81     using 59 bins.
 Reduced chi-squared = 1.0493
# Null hypothesis probability of 3.74e-01 with 57 degrees of freedom

Photon flux (15-150 keV)    in 1 sec: 0.906869 ( -0.161894  0.162081 ) ph/cm2/s
Energy fluence (15-150 keV)             : 8.00848e-08 ( -1.59786e-08  1.62826e-08 ) ergs/cm2
Cutoff power-law model

Time interval is from    0.236 sec. to    1.236 sec.
Spectral model in the cutoff power-law:
------------------------------------------------------------
Parameters  : value       lower 90%   higher 90%
Photon index: 0.188996     ( -1.60467   1.0746 )
Epeak [keV] : 92.9824      ( -34.3026 -92.9952 )
Norm@50keV  : 2.41538E-02    ( -0.0241453   0.136535 )
------------------------------------------------------------
#Fit statistic  : Chi-Squared                   57.80     using 59 bins.
 Reduced chi-squared = 1.03214
# Null hypothesis probability of 4.09e-01 with 56 degrees of freedom

Photon flux (15-150 keV)    in 1 sec: 0.876004 ( -0.166702  0.166596 ) ph/cm2/s
Energy fluence (15-150 keV)             : 7.33398e-08 ( -1.81537e-08  1.8392e-08 ) ergs/cm2
Band function

Time interval is from    0.236 sec. to    1.236 sec.


Spectral model in the Band function:
------------------------------------------------------------
Parameters  : value       lower 90%   higher 90%
alpha       :    (     )
beta        :     (     )
Epeak [keV] :       (   )
Norm@50keV   :     (     )
------------------------------------------------------------

Photon flux (15-150 keV)    in  sec:  (    ) ph/cm2/s
Energy fluence (15-150 keV)             : 0 ( 0  0 ) ergs/cm2
Single BB

Spectral model blackbody:
------------------------------------------------------------
Parameters  : value    Lower 90%  Upper 90%
kT [keV]    : 16.6974  (-3.41292  4.75995)
R^2/D10^2   : 7.75591E-02  (-0.0437222   0.0896057)
(R is the radius in km and D10 is the distance to the source in units of 10 kpc)
------------------------------------------------------------
#Fit statistic  : Chi-Squared                   60.83     using 59 bins.
 Reduced chi-squared =
# Null hypothesis probability of 3.40e-01 with 57 degrees of freedom

Energy  Fluence     90% Error
[keV]   [erg/cm2]   [erg/cm2]
15- 25  4.425e-09   1.644e-09
25- 50  1.930e-08   6.012e-09
50-150  3.819e-08   1.434e-08
15-150  6.191e-08   1.635e-08
Thermal bremsstrahlung (OTTB)

Spectral model: thermal bremsstrahlung
------------------------------------------------------------
Parameters  : value         Lower 90%    Upper 90%
kT [keV]    : 200.000       (-62.2402      -200)
Norm        : 3.66784       (-0.664019     0.664019)
------------------------------------------------------------
#Fit statistic  : Chi-Squared                   63.52     using 59 bins.
 Reduced chi-squared =
# Null hypothesis probability of 2.58e-01 with 57 degrees of freedom

Energy  Fluence     90% Error
[keV]   [erg/cm2]   [erg/cm2]
15- 25  9.133e-09   5.290e-09
25- 50  1.757e-08   1.016e-08
50-150  3.853e-08   2.168e-08
15-150  6.523e-08   3.775e-08
Double BB

Spectral model: bbodyrad<1> + bbodyrad<2>
------------------------------------------------------------
Parameters  : value         Lower 90%    Upper 90%
kT1 [keV]   : 10.0039        (-4.71922      6.12114)
R1^2/D10^2  : 0.267194        (-0.182929      1.07017)
kT2 [keV]   : 34.1424        (-23.3657      -35.2126)
R2^2/D10^2  : 5.21807E-03    (-0.00436578   0.0505272)
------------------------------------------------------------
#Fit statistic  : Chi-Squared                   56.46     using 59 bins.
 Reduced chi-squared =
# Null hypothesis probability of 4.20e-01 with 55 degrees of freedom

Energy  Fluence     90% Error
[keV]   [erg/cm2]   [erg/cm2]
15- 25  6.323e-09   3.720e-09
25- 50  1.923e-08   1.155e-08
50-150  5.102e-08   2.693e-08
15-150  7.657e-08   3.900e-08
Pre-slew spectrum (Pre-slew PHA with pre-slew DRM)
Power-law model

Spectral model in power-law:
------------------------------------------------------------
Parameters  : value       lower 90%   higher 90%
Photon index: 1.25314     ( -0.163869   0.162251 )
Norm@50keV  : 1.10348E-03    ( -0.000105872   0.000105745 )
------------------------------------------------------------
#Fit statistic  : Chi-Squared                   54.46     using 59 bins.
 Reduced chi-squared =
# Null hypothesis probability of 5.71e-01 with 57 degrees of freedom

Photon flux (15-150 keV)    in 144.5 sec: 0.130579 ( -0.0125827  0.012595 ) ph/cm2/s
Energy fluence (15-150 keV)             : 1.59449e-06 ( -1.73302e-07  1.75449e-07 ) ergs/cm2
Cutoff power-law model

Spectral model in the cutoff power-law:
------------------------------------------------------------
Parameters  : value       lower 90%   higher 90%
Photon index: 0.358682     ( -0.915014   0.744179 )
Epeak [keV] : 89.7154      ( -24.0132 180.529 )
Norm@50keV  : 3.16583E-03    ( -0.00182409   0.00595395 )
------------------------------------------------------------
#Fit statistic  : Chi-Squared                   50.14     using 59 bins.
 Reduced chi-squared =
# Null hypothesis probability of 6.95e-01 with 56 degrees of freedom

Photon flux (15-150 keV)    in 144.5 sec: 0.125294 ( -0.013448  0.013375 ) ph/cm2/s
Energy fluence (15-150 keV)             : 1.4603e-06 ( -2.04414e-07  2.08326e-07 ) ergs/cm2
Band function

Spectral model in the Band function:
------------------------------------------------------------
Parameters  : value       lower 90%   higher 90%
alpha       :    (     )
beta        :     (     )
Epeak [keV] :       (   )
Norm@50keV   :     (     )
------------------------------------------------------------

Photon flux (15-150 keV)    in  sec:  (    ) ph/cm2/s
Energy fluence (15-150 keV)             : 0 ( 0  0 ) ergs/cm2
S(25-50 keV) vs. S(50-100 keV) plot
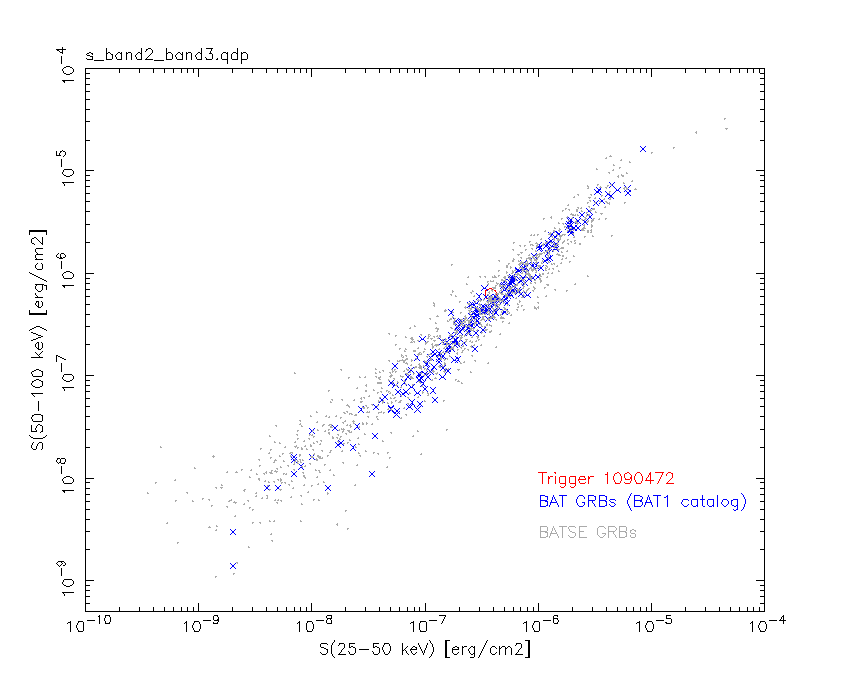
S(25-50 keV)  = 3.80e-07
S(50-100 keV) = 6.27e-07
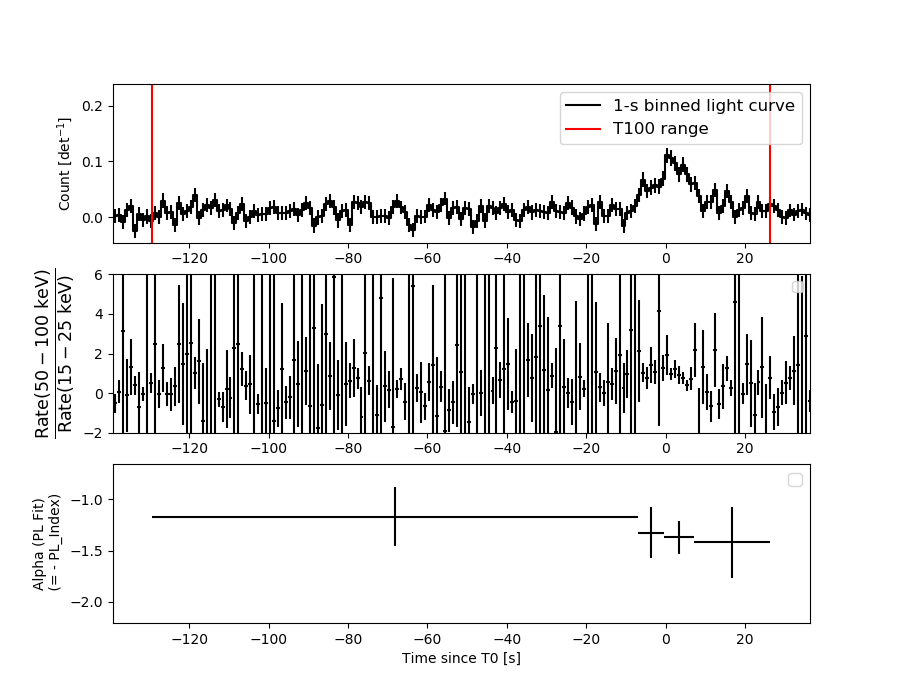
T90 vs. Hardness ratio plot

T90                                   = 136.527999997139 sec.
Hardness ratio (energy fluence ratio) = 1.65
Color vs. Color plot
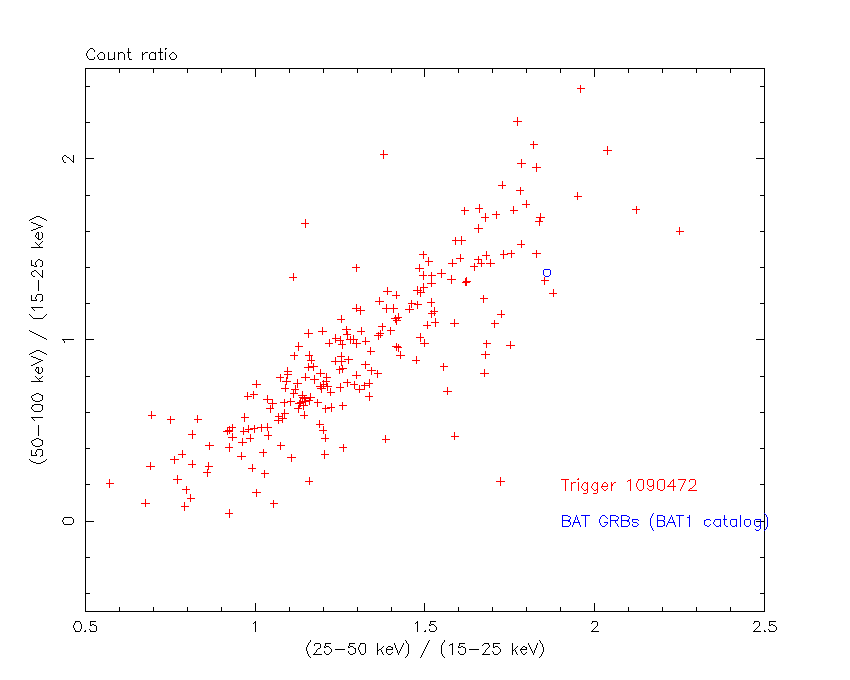
Count Ratio  (25-50 keV) / (15-25 keV) = 1.85937
Count Ratio (50-100 keV) / (15-25 keV) = 1.37176
Mask shadow pattern

IMX = 3.686134579391920E-02, IMY = -1.199847013855260E-01
TIME vs. PHA plot around the trigger time

Blue+Cyan dotted lines: Time interval of the scaled map
From 0.000000 to 1.024000
TIME vs. DetID plot around the trigger time

Blue+Cyan dotted lines: Time interval of the scaled map
From 0.000000 to 1.024000
100 us light curve (15-350 keV)
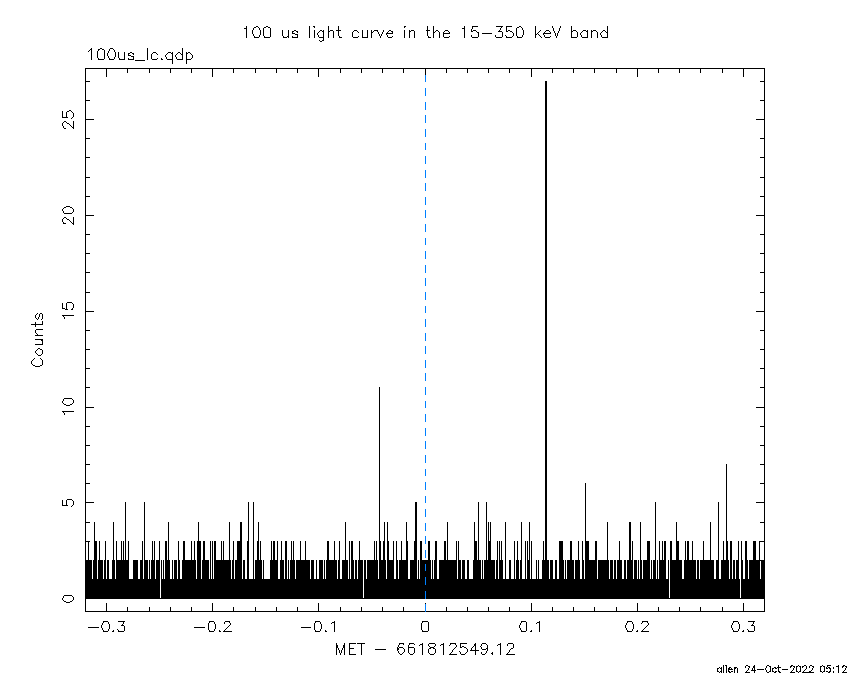
Blue+Cyan dotted lines: Time interval of the scaled map
From 0.000000 to 1.024000
Spacecraft aspect plot

Bright source in the pre-burst/pre-slew/post-slew images
Pre-burst image of 15-350 keV band
Time interval of the image:
-239.120000 -129.340000

# RAcent  DECcent POSerr Theta    Phi  PeakCts   SNR AngSep     Name
#  [deg]    [deg]    ['] [deg]  [deg]                   [']
 83.6329  22.0285    0.8  28.8   72.0   3.7422  14.9    0.8	Crab
 63.7565 -40.4099    3.8  36.4 -103.0   1.1936   3.0 ------	UNKNOWN
 20.0287  -2.9450    2.0  57.1  -30.0   5.4847   5.7 ------	UNKNOWN
 88.8603 -53.2947    2.4  48.2 -129.7   4.1727   4.9 ------	UNKNOWN
Pre-slew background subtracted image of 15-350 keV band
Time interval of the image:
-129.340000 15.180590

# RAcent  DECcent POSerr Theta    Phi  PeakCts   SNR AngSep     Name
#  [deg]    [deg]    ['] [deg]  [deg]                   [']
 83.7327  21.9465    5.0  28.7   72.2   0.9021   2.3    6.9	Crab
 78.8906   0.9128    0.9   7.2   72.9   2.8357  12.6 ------	UNKNOWN
133.5027 -31.2078    2.3  58.2 -177.2   8.0872   5.0 ------	UNKNOWN
Post-slew image of 15-350 keV band
Time interval of the image:
42.980590 963.023700

# RAcent  DECcent POSerr Theta    Phi  PeakCts   SNR AngSep     Name
#  [deg]    [deg]    ['] [deg]  [deg]                   [']
 83.6339  22.0224    0.3  21.6   77.0  39.7659  33.7    0.5	Crab
114.0495   0.5421    2.6  35.1  155.4   6.4208   4.5 ------	UNKNOWN
 61.7803   0.6624    6.3  17.1  -25.7   1.5964   1.8 ------	UNKNOWN
126.7128 -34.7100    3.2  57.1 -161.4  14.7239   3.6 ------	UNKNOWN
123.7202 -40.4233    3.6  58.0 -154.2  16.7233   3.2 ------	UNKNOWN
114.3121 -44.5330    5.7  55.3 -145.1  13.0549   2.0 ------	UNKNOWN
 94.4920 -45.2549    3.1  48.2 -129.6  17.4754   3.7 ------	UNKNOWN
 98.6984 -45.6740    3.2  49.8 -133.0  17.4026   3.6 ------	UNKNOWN
Plot creation:
Mon Oct 24 05:12:59 EDT 2022