Special notes of this burst
Image
Pre-slew 15.0-350.0 keV image (Event data)

#   RAcent    DECcent   POSerr    Theta     Phi              Peak Cts       SNR   Name
  132.1447    -2.7344   0.0097    32.0771    44.0417         1.5797072     19.750 TRIG_01091101

Foreground time interval of the image:
  0.040   9.501 (delta_t =   9.461 [sec])
Background time interval of the image:
-239.200   0.040 (delta_t = 239.240 [sec])
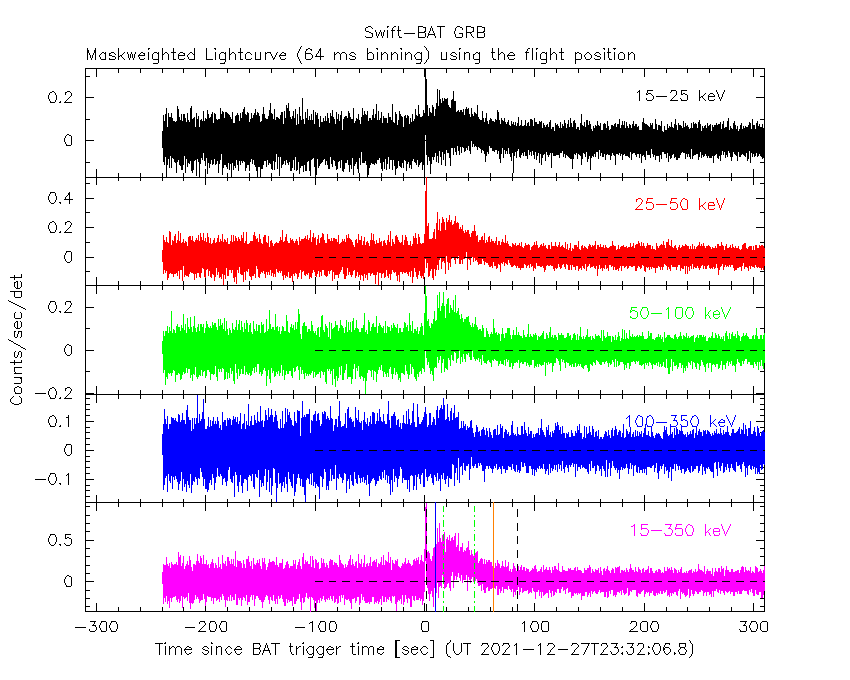
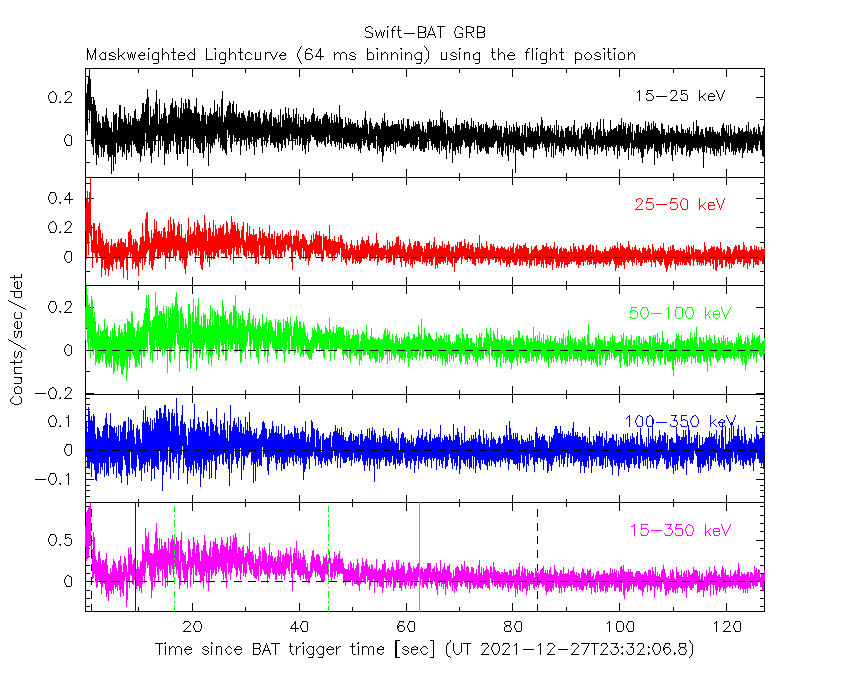
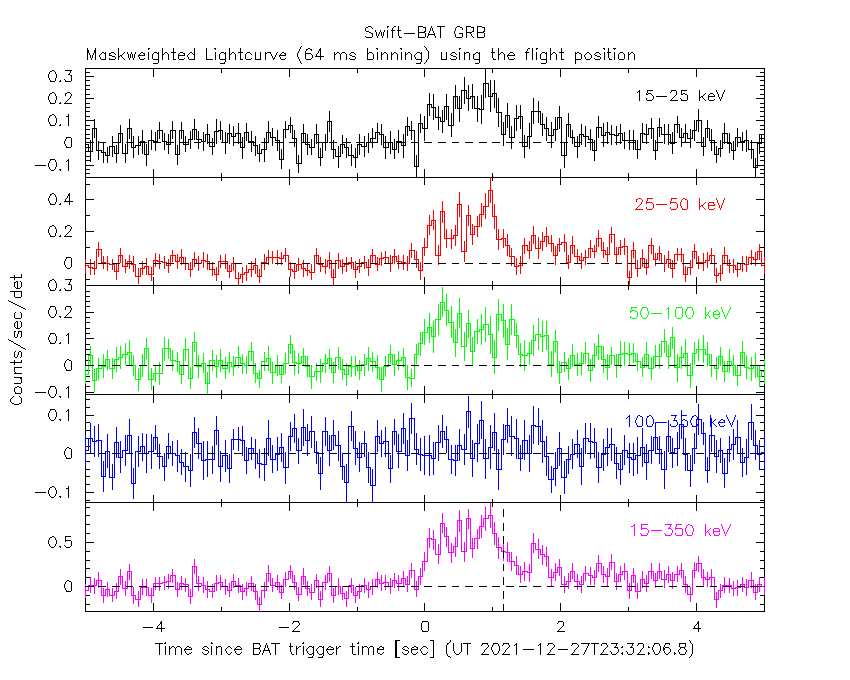
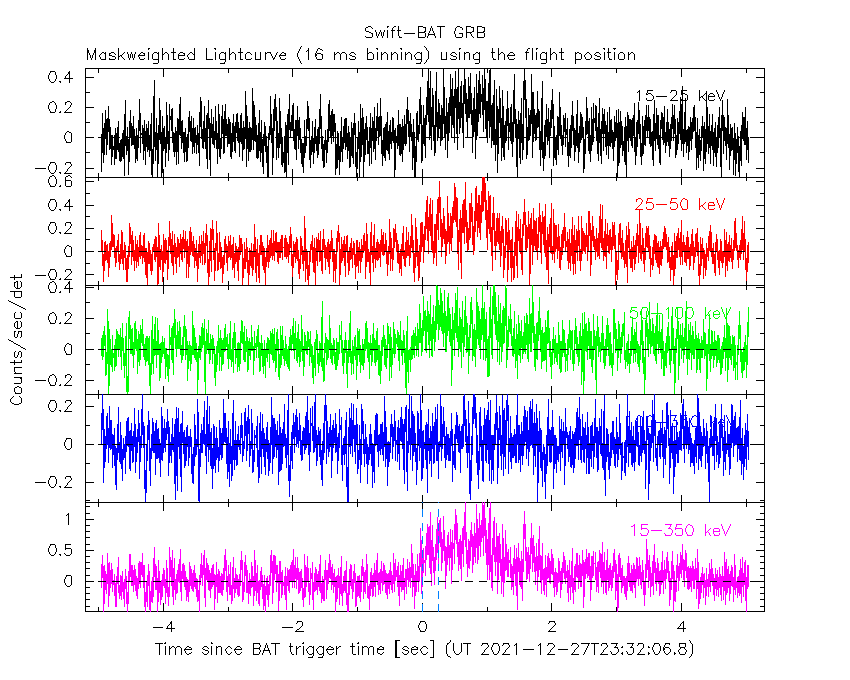
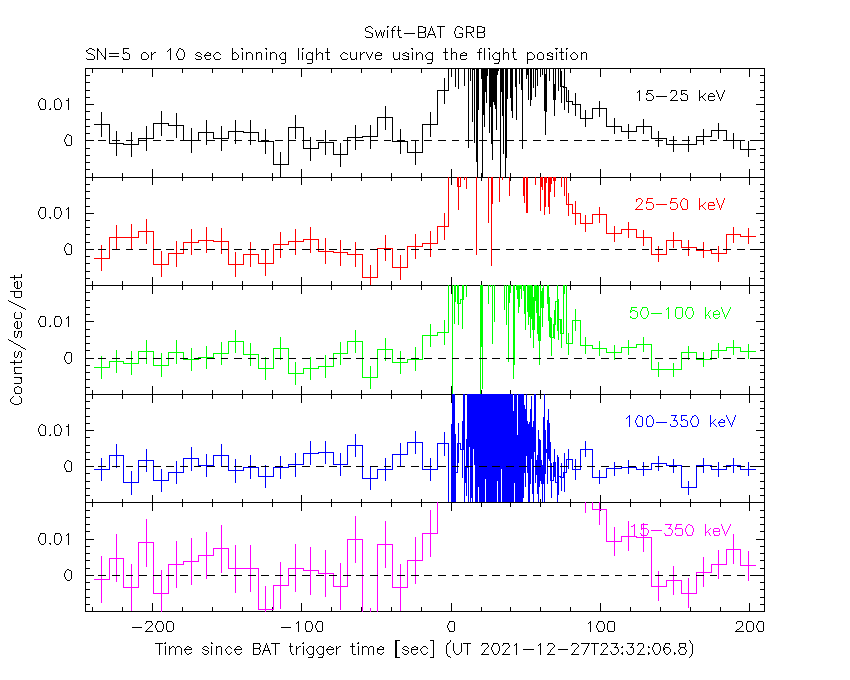
Lightcurves
Notes:
- 1) The mask-weighted light curves are using the flight position.
- 2) Multiple plots of different time binning/intervals are shown to cover all scenarios of short/long GRBs, rate/image triggers, and real/false positives.
- 3) For all the mask-weighted lightcurves, the y-axis units are counts/sec/det where a det is 0.4 x 0.4 = 0.16 sq cm.
- 4) The verticle lines correspond to following: green dotted lines are T50 interval, black dotted lines are T90 interval, blue solid line(s) is a spacecraft slew start time, and orange solid line(s) is a spacecraft slew end time.
- 5) Time of each bin is in the middle of the bin.
1 s binning
From T0-310 s to T0+310 s

From T100_start - 20 s to T100_end + 30 s

Full time interval

64 ms binning
Full time interval
From T100_start to T100_end
From T0-5 sec to T0+5 sec
16 ms binning
From T100_start-5 s to T100_start+5 s
Blue+Cyan dotted lines: Time interval of the scaled map
From 0.000000 to 0.256000
8 ms binning
From T100_start-3 s to T100_start+3 s
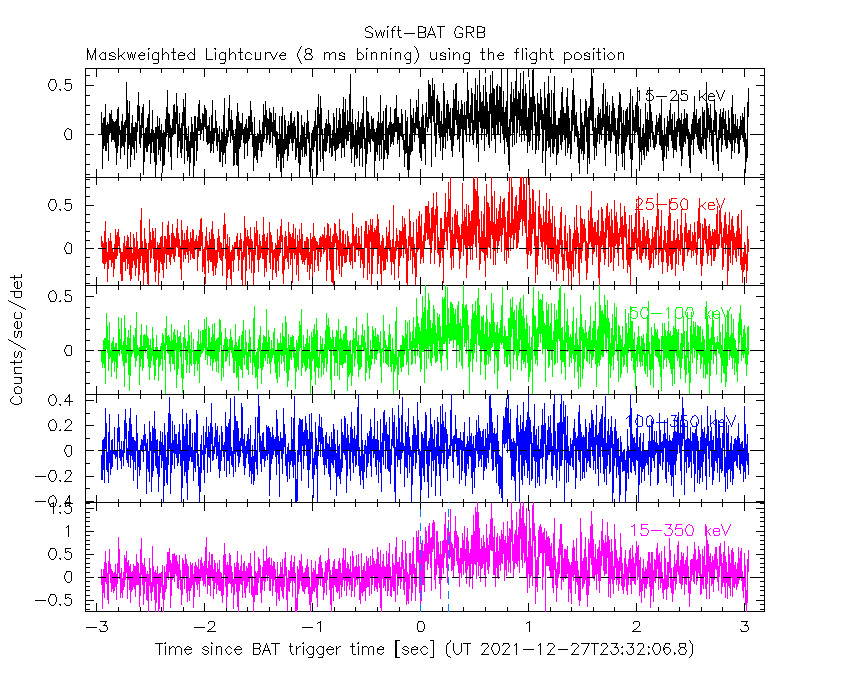
Blue+Cyan dotted lines: Time interval of the scaled map
From 0.000000 to 0.256000
2 ms binning
From T100_start-1 s to T100_start+1 s
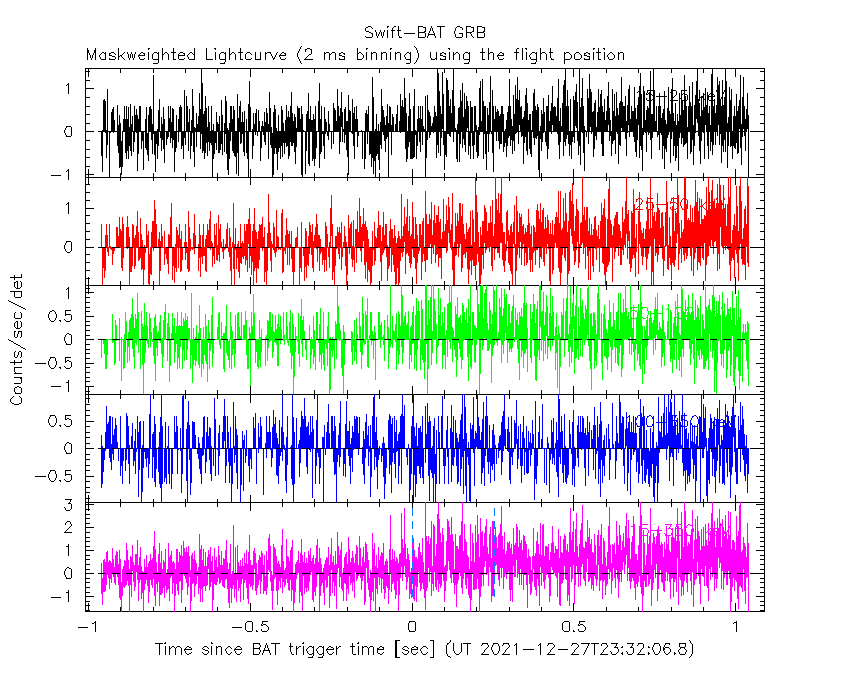
Blue+Cyan dotted lines: Time interval of the scaled map
From 0.000000 to 0.256000
SN=5 or 10 sec. binning (whichever binning is satisfied first)

SN=5 or 10 sec. binning (T < 200 sec)
Quad-rate summed light curves (from T0-300s to T0+1000s)

Spectral Evolution

Spectra
Notes:
- 1) The fitting includes the systematic errors.
- 2) When the burst includes telescope slew time periods, the fitting uses an average response file made from multiple 5-s response files through out the slew time plus single time preiod for the non-slew times, and weighted by the total counts in the corresponding time period using addrmf. An average response file is needed becuase a spectral fit using the pre-slew DRM will introduce some errors in both a spectral shape and a normalization if the PHA file contains a lot of the slew/post-slew time interval.
- 3) For fits to more complicated models (e.g. a power-law over a cutoff power-law), the BAT team has decided to require a chi-square improvement of more than 6 for each extra dof.
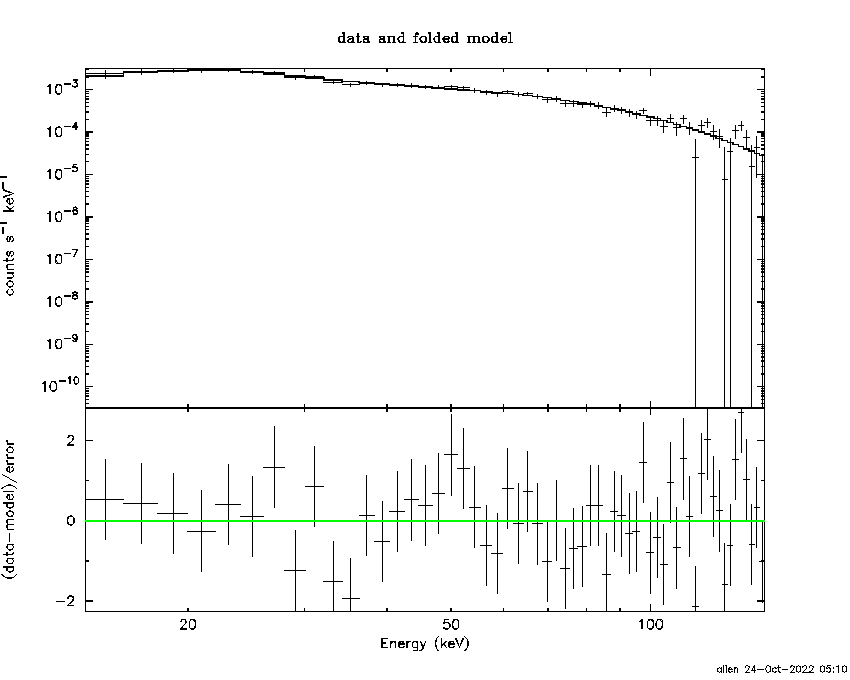
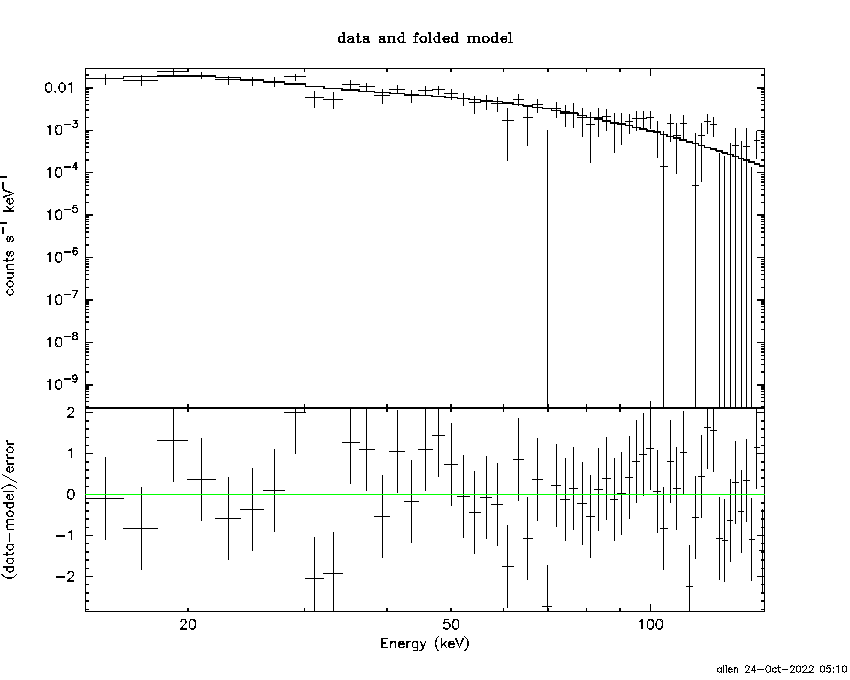
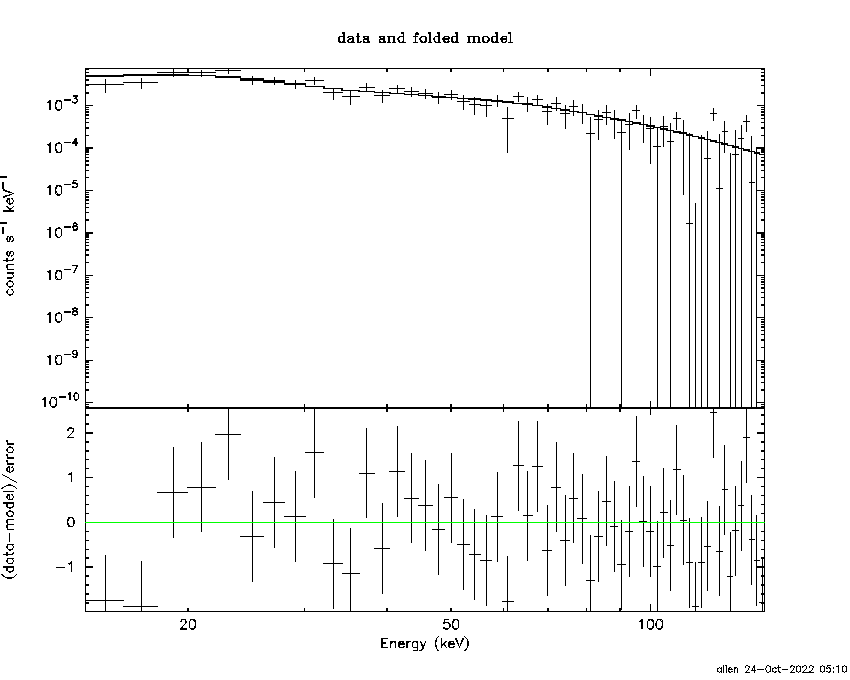
Time averaged spectrum fit using the average DRM
Power-law model
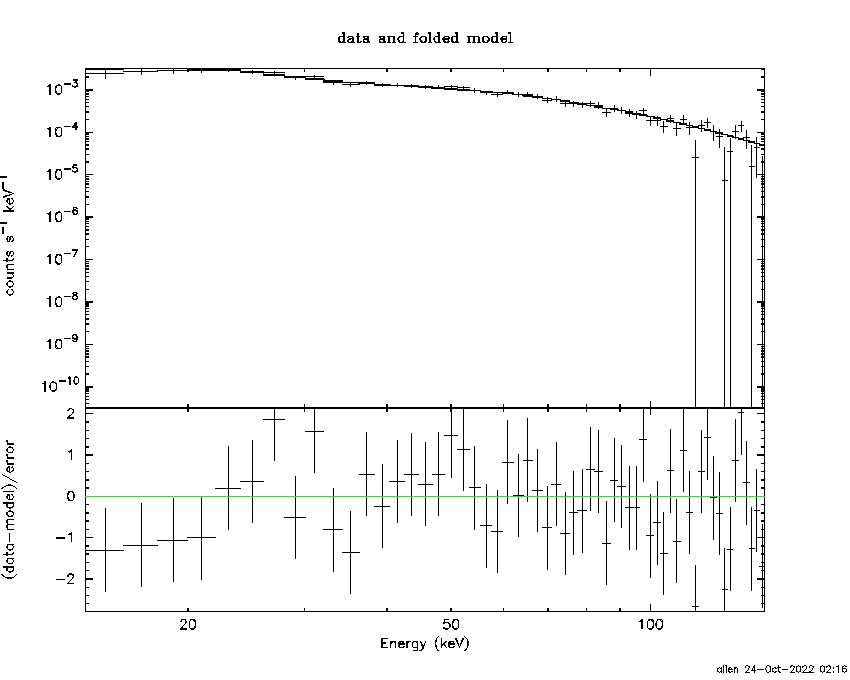
Time interval is from    0.040 sec. to  127.064 sec.

Spectral model in power-law:
------------------------------------------------------------
Parameters  : value       lower 90%   higher 90%
Photon index: 1.55074     ( -0.0505574   0.0506403 )
Norm@50keV  : 6.77972E-03    ( -0.000178422   0.000178355 )
------------------------------------------------------------
#Fit statistic  : Chi-Squared                   59.73     using 59 bins.
 Reduced chi-squared = 1.04789
# Null hypothesis probability of 3.77e-01 with 57 degrees of freedom

Photon flux (15-150 keV)    in 127 sec: 0.858482 ( -0.024497  0.024565 ) ph/cm2/s
Energy fluence (15-150 keV)             : 8.10594e-06 ( -2.27255e-07  2.27872e-07 ) ergs/cm2
Cutoff power-law model

Time interval is from    0.040 sec. to  127.064 sec.
Spectral model in the cutoff power-law:
------------------------------------------------------------
Parameters  : value       lower 90%   higher 90%
Photon index: 1.27927     ( -0.209456   0.199762 )
Epeak [keV] : 140.293      ( -38.9907 219.19 )
Norm@50keV  : 9.10639E-03    ( -0.00173382   0.00226315 )
------------------------------------------------------------
#Fit statistic  : Chi-Squared                   54.27     using 59 bins.
 Reduced chi-squared = 0.969107
# Null hypothesis probability of 5.41e-01 with 56 degrees of freedom

Photon flux (15-150 keV)    in 127 sec: 0.840793 ( -0.027429  0.027514 ) ph/cm2/s
Energy fluence (15-150 keV)             : 7.92855e-06 ( -2.62106e-07  2.61262e-07 ) ergs/cm2
Band function

Time interval is from    0.040 sec. to  127.064 sec.


Spectral model in the Band function:
------------------------------------------------------------
Parameters  : value       lower 90%   higher 90%
alpha       :    (     )
beta        :     (     )
Epeak [keV] :       (   )
Norm@50keV   :     (     )
------------------------------------------------------------

Photon flux (15-150 keV)    in  sec:  (    ) ph/cm2/s
Energy fluence (15-150 keV)             : 0 ( 0  0 ) ergs/cm2
Single BB
Spectral model blackbody:
------------------------------------------------------------
Parameters  : value    Lower 90%  Upper 90%
kT [keV]    : 15.6975  (  )
R^2/D10^2   : 7.86160E-02  (   )
(R is the radius in km and D10 is the distance to the source in units of 10 kpc)
------------------------------------------------------------
#Fit statistic  : Chi-Squared                  325.22     using 59 bins.
 Reduced chi-squared =
# Null hypothesis probability of 3.22e-39 with 57 degrees of freedom

Energy  Fluence     90% Error
[keV]   [erg/cm2]   [erg/cm2]
15- 25  5.108e-07   2.908e-08
25- 50  2.114e-06   7.811e-08
50-150  3.614e-06   1.905e-07
15-150  6.239e-06   1.880e-07
Thermal bremsstrahlung (OTTB)

Spectral model: thermal bremsstrahlung
------------------------------------------------------------
Parameters  : value         Lower 90%    Upper 90%
kT [keV]    : 200.000       (-18.5191      -200)
Norm        : 3.47330       (-0.0907142     0.0907142)
------------------------------------------------------------
#Fit statistic  : Chi-Squared                   55.05     using 59 bins.
 Reduced chi-squared =
# Null hypothesis probability of 5.48e-01 with 57 degrees of freedom

Energy  Fluence     90% Error
[keV]   [erg/cm2]   [erg/cm2]
15- 25  1.099e-06   3.258e-08
25- 50  2.114e-06   6.414e-08
50-150  4.636e-06   1.238e-07
15-150  7.848e-06   2.356e-07
Double BB
Spectral model: bbodyrad<1> + bbodyrad<2>
------------------------------------------------------------
Parameters  : value         Lower 90%    Upper 90%
kT1 [keV]   : 7.17670        (-0.732425      0.798398)
R1^2/D10^2  : 0.788173        (-0.234959      0.364962)
kT2 [keV]   : 26.1492        (-2.40747      3.184)
R2^2/D10^2  : 1.04880E-02    (-0.00359603   0.00456695)
------------------------------------------------------------
#Fit statistic  : Chi-Squared                   57.81     using 59 bins.
 Reduced chi-squared =
# Null hypothesis probability of 3.72e-01 with 55 degrees of freedom

Energy  Fluence     90% Error
[keV]   [erg/cm2]   [erg/cm2]
15- 25  1.004e-06   8.998e-08
25- 50  2.116e-06   1.283e-07
50-150  4.728e-06   3.581e-07
15-150  7.848e-06   4.813e-07
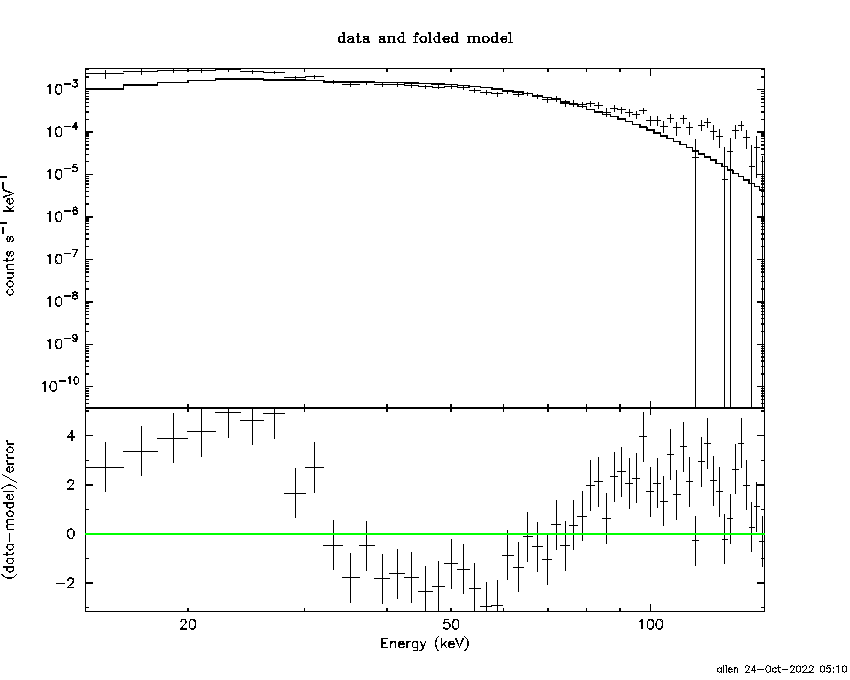
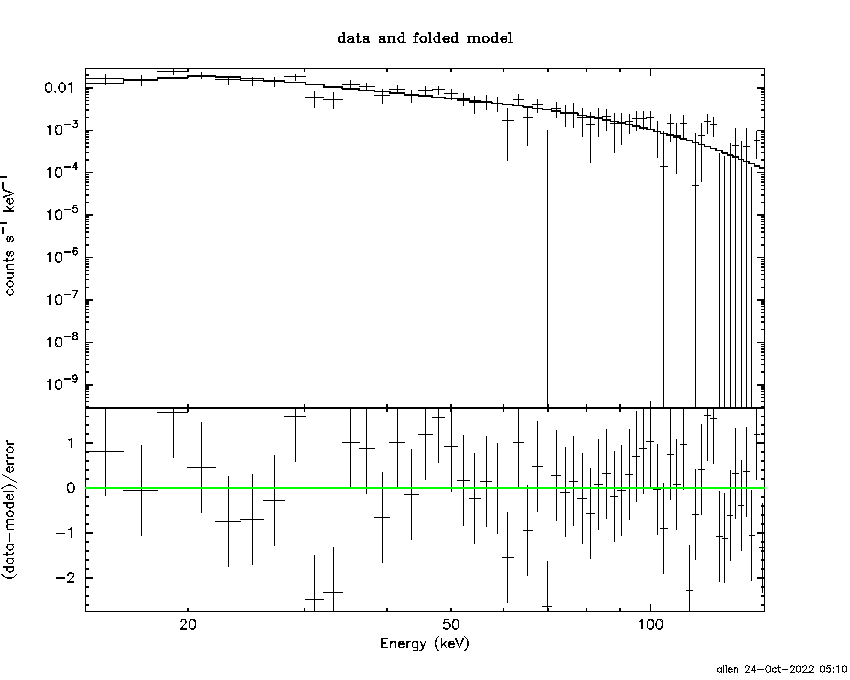
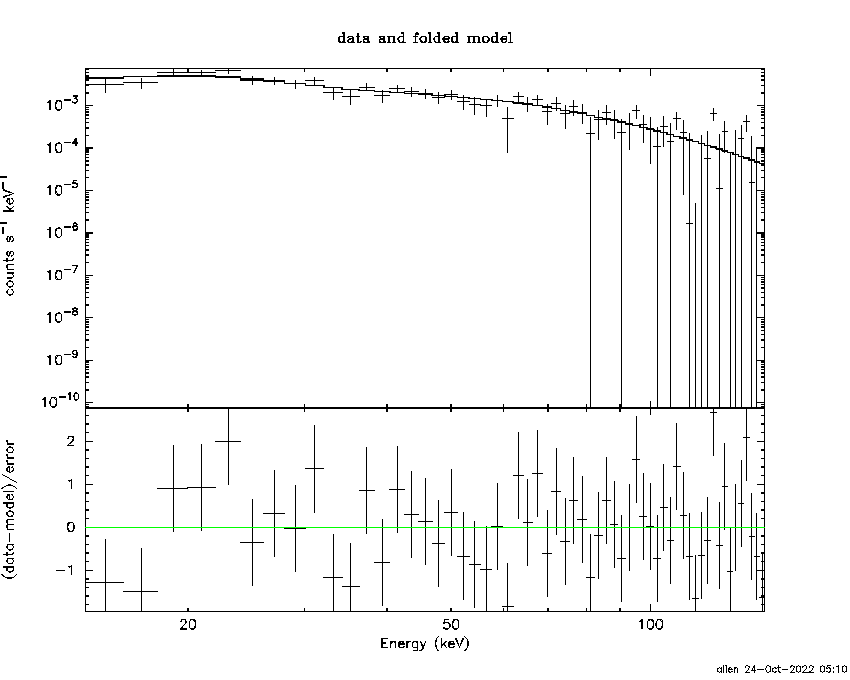
Peak spectrum fit
Power-law model

Time interval is from    0.064 sec. to    1.064 sec.

Spectral model in power-law:
------------------------------------------------------------
Parameters  : value       lower 90%   higher 90%
Photon index: 1.75396     ( -0.138468   0.142615 )
Norm@50keV  : 3.79135E-02    ( -0.00344709   0.00340275 )
------------------------------------------------------------
#Fit statistic  : Chi-Squared                   62.39     using 59 bins.
 Reduced chi-squared = 1.09456
# Null hypothesis probability of 2.91e-01 with 57 degrees of freedom

Photon flux (15-150 keV)    in 1 sec: 5.13429 ( -0.41907  0.41925 ) ph/cm2/s
Energy fluence (15-150 keV)             : 3.49816e-07 ( -3.26694e-08  3.30087e-08 ) ergs/cm2
Cutoff power-law model

Time interval is from    0.064 sec. to    1.064 sec.
Spectral model in the cutoff power-law:
------------------------------------------------------------
Parameters  : value       lower 90%   higher 90%
Photon index: 1.26523     ( -0.64077   0.538932 )
Epeak [keV] : 69.3900      ( -18.6666 -69.39 )
Norm@50keV  : 6.98654E-02    ( -0.0332736   0.0846745 )
------------------------------------------------------------
#Fit statistic  : Chi-Squared                   60.11     using 59 bins.
 Reduced chi-squared = 1.07339
# Null hypothesis probability of 3.29e-01 with 56 degrees of freedom

Photon flux (15-150 keV)    in 1 sec: 5.05465 ( -0.4299  0.42909 ) ph/cm2/s
Energy fluence (15-150 keV)             : 3.37023e-07 ( -3.59443e-08  3.60983e-08 ) ergs/cm2
Band function

Time interval is from    0.064 sec. to    1.064 sec.


Spectral model in the Band function:
------------------------------------------------------------
Parameters  : value       lower 90%   higher 90%
alpha       :    (     )
beta        :     (     )
Epeak [keV] :       (   )
Norm@50keV   :     (     )
------------------------------------------------------------

Photon flux (15-150 keV)    in  sec:  (    ) ph/cm2/s
Energy fluence (15-150 keV)             : 0 ( 0  0 ) ergs/cm2
Single BB

Spectral model blackbody:
------------------------------------------------------------
Parameters  : value    Lower 90%  Upper 90%
kT [keV]    : 11.9272  (-1.09572  1.22366)
R^2/D10^2   : 1.29267  (-0.39264   0.550973)
(R is the radius in km and D10 is the distance to the source in units of 10 kpc)
------------------------------------------------------------
#Fit statistic  : Chi-Squared                   89.88     using 59 bins.
 Reduced chi-squared =
# Null hypothesis probability of 3.57e-03 with 57 degrees of freedom

Energy  Fluence     90% Error
[keV]   [erg/cm2]   [erg/cm2]
15- 25  3.887e-08   5.605e-09
25- 50  1.215e-07   1.270e-08
50-150  1.035e-07   1.998e-08
15-150  2.638e-07   2.590e-08
Thermal bremsstrahlung (OTTB)
Spectral model: thermal bremsstrahlung
------------------------------------------------------------
Parameters  : value         Lower 90%    Upper 90%
kT [keV]    : 114.550       (-31.6992      48.8607)
Norm        : 22.0465       (-2.21328     2.7504)
------------------------------------------------------------
#Fit statistic  : Chi-Squared                   60.11     using 59 bins.
 Reduced chi-squared =
# Null hypothesis probability of 3.64e-01 with 57 degrees of freedom

Energy  Fluence     90% Error
[keV]   [erg/cm2]   [erg/cm2]
15- 25  5.752e-08   6.570e-09
25- 50  1.021e-07   1.029e-08
50-150  1.779e-07   6.861e-08
15-150  3.375e-07   7.540e-08
Double BB
Spectral model: bbodyrad<1> + bbodyrad<2>
------------------------------------------------------------
Parameters  : value         Lower 90%    Upper 90%
kT1 [keV]   : 7.46680        (-2.54955      1.95039)
R1^2/D10^2  : 5.02959        (-2.52977      14.2572)
kT2 [keV]   : 25.5351        (-8.64651      19.9799)
R2^2/D10^2  : 5.22734E-02    (-0.0434218   0.224373)
------------------------------------------------------------
#Fit statistic  : Chi-Squared                   62.31     using 59 bins.
 Reduced chi-squared =
# Null hypothesis probability of 2.32e-01 with 55 degrees of freedom

Energy  Fluence     90% Error
[keV]   [erg/cm2]   [erg/cm2]
15- 25  5.379e-08   1.829e-08
25- 50  1.077e-07   3.312e-08
50-150  1.772e-07   8.688e-08
15-150  3.387e-07   1.069e-07
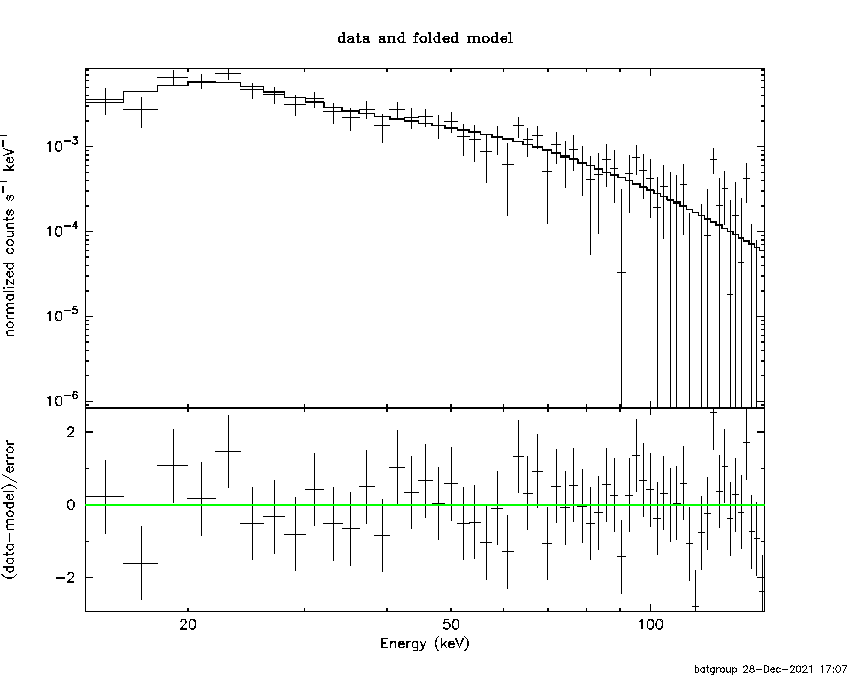
Pre-slew spectrum (Pre-slew PHA with pre-slew DRM)
Power-law model
Spectral model in power-law:
------------------------------------------------------------
Parameters  : value       lower 90%   higher 90%
Photon index: 1.68784     ( -0.130264   0.132633 )
Norm@50keV  : 1.06862E-02    ( -0.000880074   0.000871025 )
------------------------------------------------------------
#Fit statistic  : Chi-Squared                   58.42     using 59 bins.
 Reduced chi-squared =
# Null hypothesis probability of 4.23e-01 with 57 degrees of freedom

Photon flux (15-150 keV)    in 9.461 sec: 1.41328 ( -0.105786  0.105836 ) ph/cm2/s
Energy fluence (15-150 keV)             : 9.37017e-07 ( -8.1179e-08  8.20892e-08 ) ergs/cm2
Cutoff power-law model
Spectral model in the cutoff power-law:
------------------------------------------------------------
Parameters  : value       lower 90%   higher 90%
Photon index: 1.24141     ( -0.566669   0.49061 )
Epeak [keV] : 76.6042      ( -22.1774 -76.6043 )
Norm@50keV  : 1.87996E-02    ( -0.00841664   0.0193069 )
------------------------------------------------------------
#Fit statistic  : Chi-Squared                   56.06     using 59 bins.
 Reduced chi-squared =
# Null hypothesis probability of 4.72e-01 with 56 degrees of freedom

Photon flux (15-150 keV)    in 9.461 sec: 1.38774 ( -0.10954  0.10944 ) ph/cm2/s
Energy fluence (15-150 keV)             : 8.96021e-07 ( -9.29231e-08  9.37793e-08 ) ergs/cm2
Band function
Spectral model in the Band function:
------------------------------------------------------------
Parameters  : value       lower 90%   higher 90%
alpha       :    (     )
beta        :     (     )
Epeak [keV] :       (   )
Norm@50keV   :     (     )
------------------------------------------------------------

Photon flux (15-150 keV)    in  sec:  (    ) ph/cm2/s
Energy fluence (15-150 keV)             : 0 ( 0  0 ) ergs/cm2
S(25-50 keV) vs. S(50-100 keV) plot

S(25-50 keV)  = 2.06e-06
S(50-100 keV) = 2.81e-06
T90 vs. Hardness ratio plot

T90                                   = 83.5119999647141 sec.
Hardness ratio (energy fluence ratio) = 1.36408
Color vs. Color plot

Count Ratio  (25-50 keV) / (15-25 keV) = 1.42622
Count Ratio (50-100 keV) / (15-25 keV) = 1.04436
Mask shadow pattern
IMX = 4.505223046822464E-01, IMY = -4.356992036297798E-01
TIME vs. PHA plot around the trigger time
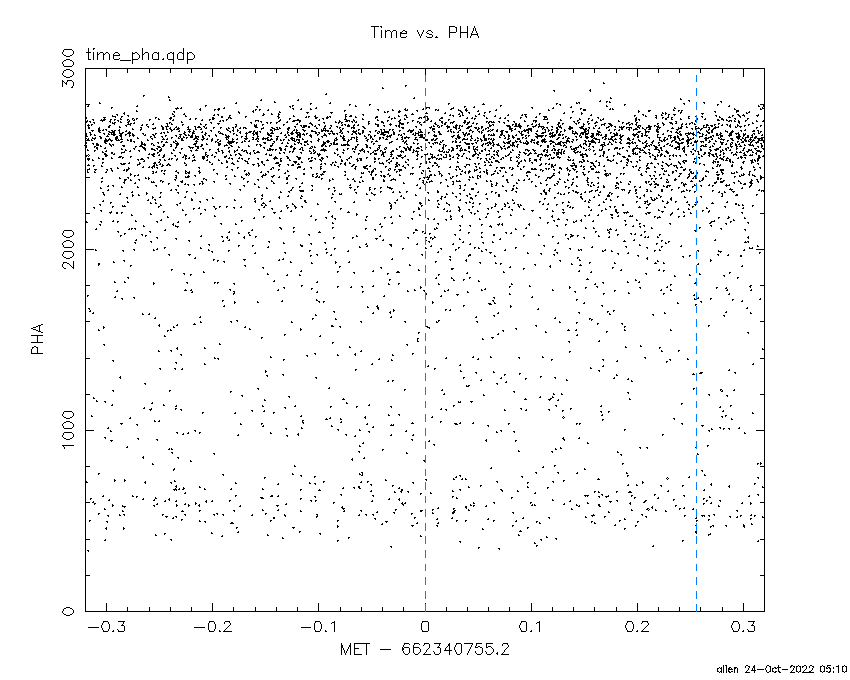
Blue+Cyan dotted lines: Time interval of the scaled map
From 0.000000 to 0.256000
TIME vs. DetID plot around the trigger time
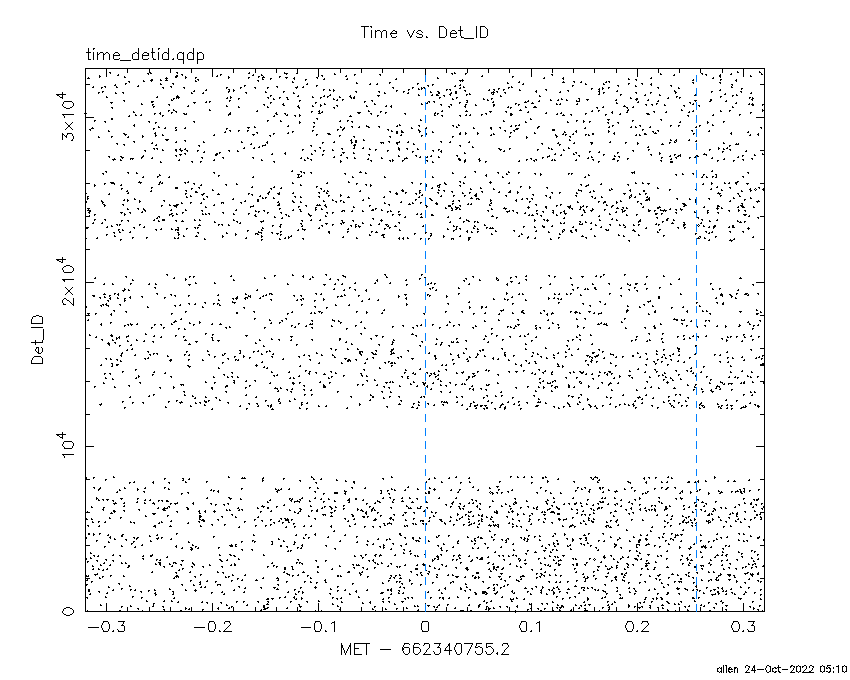
Blue+Cyan dotted lines: Time interval of the scaled map
From 0.000000 to 0.256000
100 us light curve (15-350 keV)

Blue+Cyan dotted lines: Time interval of the scaled map
From 0.000000 to 0.256000
Spacecraft aspect plot

Bright source in the pre-burst/pre-slew/post-slew images
Pre-burst image of 15-350 keV band
Time interval of the image:
-239.200000 0.040000

# RAcent  DECcent POSerr Theta    Phi  PeakCts   SNR AngSep     Name
#  [deg]    [deg]    ['] [deg]  [deg]                   [']
135.5947 -40.6202    4.7  52.9   -5.1   1.7852   2.4    5.0	Vela X-1
171.7356  27.1869    2.7  22.8  169.1   1.2022   4.2 ------	UNKNOWN
182.1063 -16.0726    2.4  29.0  -71.5   1.9264   4.8 ------	UNKNOWN
203.5042  11.7172    3.3  40.3 -132.3   1.8794   3.5 ------	UNKNOWN
202.1803  -3.1794    3.3  40.1 -109.0   3.2973   3.5 ------	UNKNOWN
207.2200   3.8552    3.8  44.0 -120.6   3.2796   3.0 ------	UNKNOWN
177.2250 -43.0603    3.4  50.6  -44.5   4.1884   3.4 ------	UNKNOWN
211.4079   9.9405    2.6  48.0 -129.2   5.6089   4.3 ------	UNKNOWN
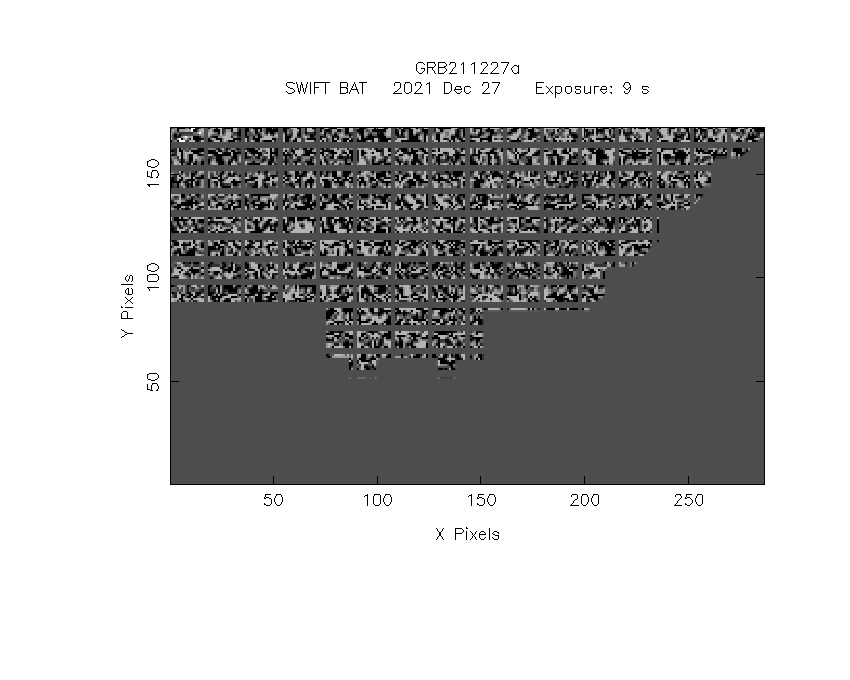
Pre-slew background subtracted image of 15-350 keV band
Time interval of the image:
0.040000 9.500600

# RAcent  DECcent POSerr Theta    Phi  PeakCts   SNR AngSep     Name
#  [deg]    [deg]    ['] [deg]  [deg]                   [']
135.7125 -40.5399    5.1  52.8   -5.1   0.2759   2.3    8.4	Vela X-1
132.1446  -2.7344    0.6  32.1   44.0   1.5797  19.7 ------	UNKNOWN
179.2322  -8.8029    2.1  21.8  -78.9   0.2914   5.4 ------	UNKNOWN
Post-slew image of 15-350 keV band
Time interval of the image:
62.500600 962.848000

# RAcent  DECcent POSerr Theta    Phi  PeakCts   SNR AngSep     Name
#  [deg]    [deg]    ['] [deg]  [deg]                   [']
135.5108 -40.5518    1.2  38.0  -43.1  13.7745   9.5    0.8	Vela X-1
 82.1267 -10.4518    4.6  50.2   39.7  11.8425   2.5 ------	UNKNOWN
141.8327  38.2125    2.7  41.9  152.4   7.1857   4.3 ------	UNKNOWN
 98.8663 -12.9474    3.2  34.5   31.9   3.9218   3.6 ------	UNKNOWN
148.2136  33.9681    2.9  39.7  162.1   5.3193   4.0 ------	UNKNOWN
100.6193 -24.3813    3.6  37.3   12.8   3.5490   3.2 ------	UNKNOWN
117.6347 -27.5996    3.3  28.5  -11.2   2.4751   3.5 ------	UNKNOWN
142.0859  -2.7091    3.5   9.9 -128.8   2.0712   3.3 ------	UNKNOWN
112.0431 -49.0286    2.8  49.4  -21.7   7.7356   4.2 ------	UNKNOWN
Plot creation:
Mon Oct 24 05:11:01 EDT 2022