Estimated redshift from machine learning (Ukwatta et al. 2016) - may take a few minute to calcaulte
Image
Pre-slew 15.0-350.0 keV image (Event data)

#   RAcent    DECcent   POSerr    Theta     Phi              Peak Cts       SNR   Name
   91.5918   -28.4033   0.0129    32.7377    84.6852         3.2253790     14.946 TRIG_01093592

Foreground time interval of the image:
 14.792  68.152 (delta_t =  53.360 [sec])
Background time interval of the image:
-239.000  14.792 (delta_t = 253.792 [sec])
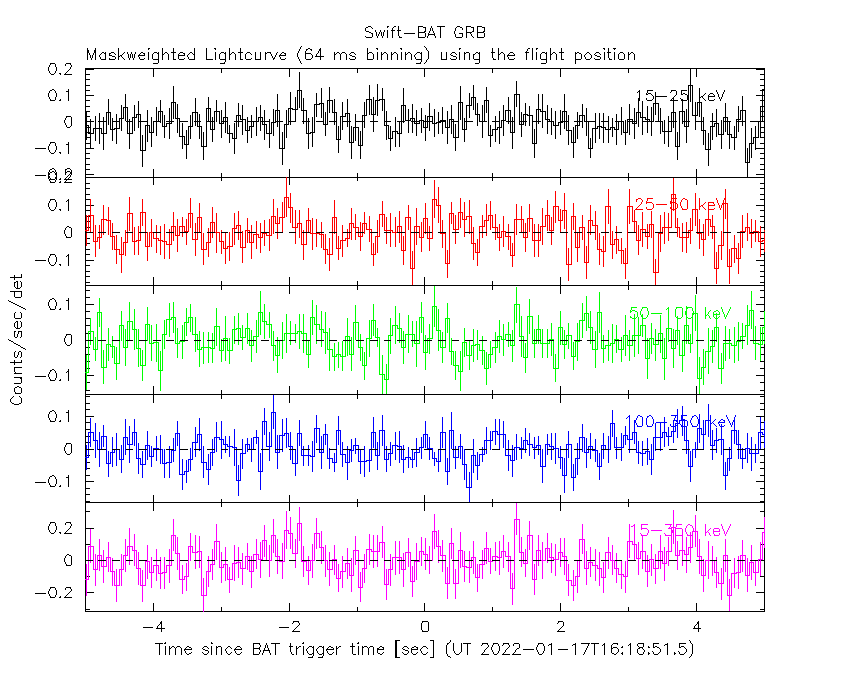
Lightcurves
Notes:
- 1) The mask-weighted light curves are using the flight position.
- 2) Multiple plots of different time binning/intervals are shown to cover all scenarios of short/long GRBs, rate/image triggers, and real/false positives.
- 3) For all the mask-weighted lightcurves, the y-axis units are counts/sec/det where a det is 0.4 x 0.4 = 0.16 sq cm.
- 4) The verticle lines correspond to following: green dotted lines are T50 interval, black dotted lines are T90 interval, blue solid line(s) is a spacecraft slew start time, and orange solid line(s) is a spacecraft slew end time.
- 5) Time of each bin is in the middle of the bin.
1 s binning
From T0-310 s to T0+310 s

From T100_start - 20 s to T100_end + 30 s

Full time interval

64 ms binning
Full time interval

From T100_start to T100_end

From T0-5 sec to T0+5 sec
16 ms binning
From T100_start-5 s to T100_start+5 s

8 ms binning
From T100_start-3 s to T100_start+3 s

2 ms binning
From T100_start-1 s to T100_start+1 s

SN=5 or 10 sec. binning (whichever binning is satisfied first)

SN=5 or 10 sec. binning (T < 200 sec)

Quad-rate summed light curves (from T0-300s to T0+1000s)

Spectral Evolution

Spectra
Notes:
- 1) The fitting includes the systematic errors.
- 2) When the burst includes telescope slew time periods, the fitting uses an average response file made from multiple 5-s response files through out the slew time plus single time preiod for the non-slew times, and weighted by the total counts in the corresponding time period using addrmf. An average response file is needed becuase a spectral fit using the pre-slew DRM will introduce some errors in both a spectral shape and a normalization if the PHA file contains a lot of the slew/post-slew time interval.
- 3) For fits to more complicated models (e.g. a power-law over a cutoff power-law), the BAT team has decided to require a chi-square improvement of more than 6 for each extra dof.
Time averaged spectrum fit using the average DRM
Power-law model

Time interval is from   14.792 sec. to   68.152 sec.

Spectral model in power-law:
------------------------------------------------------------
Parameters  : value       lower 90%   higher 90%
Photon index: 1.85637     ( -0.175494   0.182555 )
Norm@50keV  : 3.41335E-03    ( -0.000407733   0.000400489 )
------------------------------------------------------------
#Fit statistic  : Chi-Squared                   61.39     using 59 bins.
 Reduced chi-squared = 1.07702
# Null hypothesis probability of 3.22e-01 with 57 degrees of freedom

Photon flux (15-150 keV)    in 53.36 sec: 0.481057 ( -0.048964  0.048982 ) ph/cm2/s
Energy fluence (15-150 keV)             : 1.67489e-06 ( -1.98212e-07  2.01122e-07 ) ergs/cm2
Cutoff power-law model

Time interval is from   14.792 sec. to   68.152 sec.
Spectral model in the cutoff power-law:
------------------------------------------------------------
Parameters  : value       lower 90%   higher 90%
Photon index: 1.18433     ( -0.840872   0.699248 )
Epeak [keV] : 52.6424      ( -13.8972 -52.6424 )
Norm@50keV  : 8.18551E-03    ( -0.00482337   0.0161387 )
------------------------------------------------------------
#Fit statistic  : Chi-Squared                   58.73     using 59 bins.
 Reduced chi-squared = 1.04875
# Null hypothesis probability of 3.76e-01 with 56 degrees of freedom

Photon flux (15-150 keV)    in 53.36 sec: 0.470519 ( -0.05021  0.050205 ) ph/cm2/s
Energy fluence (15-150 keV)             : 1.57553e-06 ( -2.16697e-07  2.24568e-07 ) ergs/cm2
Band function

Time interval is from   14.792 sec. to   68.152 sec.


Spectral model in the Band function:
------------------------------------------------------------
Parameters  : value       lower 90%   higher 90%
alpha       :    (     )
beta        :     (     )
Epeak [keV] :       (   )
Norm@50keV   :     (     )
------------------------------------------------------------

Photon flux (15-150 keV)    in  sec:  (    ) ph/cm2/s
Energy fluence (15-150 keV)             : 0 ( 0  0 ) ergs/cm2
Single BB

Spectral model blackbody:
------------------------------------------------------------
Parameters  : value    Lower 90%  Upper 90%
kT [keV]    : 11.1033  (-1.35197  1.52377)
R^2/D10^2   : 0.154222  (-0.0590008   0.0968203)
(R is the radius in km and D10 is the distance to the source in units of 10 kpc)
------------------------------------------------------------
#Fit statistic  : Chi-Squared                   78.01     using 59 bins.
 Reduced chi-squared =
# Null hypothesis probability of 3.38e-02 with 57 degrees of freedom

Energy  Fluence     90% Error
[keV]   [erg/cm2]   [erg/cm2]
15- 25  2.124e-07   4.199e-08
25- 50  6.077e-07   7.959e-08
50-150  4.262e-07   1.110e-07
15-150  1.246e-06   1.659e-07
Thermal bremsstrahlung (OTTB)

Spectral model: thermal bremsstrahlung
------------------------------------------------------------
Parameters  : value         Lower 90%    Upper 90%
kT [keV]    : 85.3638       (-24.3464      43.0438)
Norm        : 2.22942       (-0.314871     0.379472)
------------------------------------------------------------
#Fit statistic  : Chi-Squared                   58.76     using 59 bins.
 Reduced chi-squared =
# Null hypothesis probability of 4.11e-01 with 57 degrees of freedom

Energy  Fluence     90% Error
[keV]   [erg/cm2]   [erg/cm2]
15- 25  3.098e-07   4.704e-08
25- 50  5.178e-07   6.363e-08
50-150  7.627e-07   3.354e-07
15-150  1.590e-06   3.741e-07
Double BB

Spectral model: bbodyrad<1> + bbodyrad<2>
------------------------------------------------------------
Parameters  : value         Lower 90%    Upper 90%
kT1 [keV]   : 5.48826        (-1.37376      1.82688)
R1^2/D10^2  : 1.36728        (-0.857246      2.76193)
kT2 [keV]   : 18.1540        (-3.91078      7.73646)
R2^2/D10^2  : 1.82782E-02    (-0.0139276   0.0327637)
------------------------------------------------------------
#Fit statistic  : Chi-Squared                   57.01     using 59 bins.
 Reduced chi-squared =
# Null hypothesis probability of 4.00e-01 with 55 degrees of freedom

Energy  Fluence     90% Error
[keV]   [erg/cm2]   [erg/cm2]
15- 25  3.181e-07   1.654e-07
25- 50  5.060e-07   2.260e-07
50-150  7.291e-07   4.264e-07
15-150  1.553e-06   6.775e-07
Peak spectrum fit
Power-law model

Time interval is from   14.812 sec. to   15.812 sec.

Spectral model in power-law:
------------------------------------------------------------
Parameters  : value       lower 90%   higher 90%
Photon index: 1.64085     ( -0.305489   0.324437 )
Norm@50keV  : 1.43609E-02    ( -0.00313282   0.00309387 )
------------------------------------------------------------
#Fit statistic  : Chi-Squared                   61.43     using 59 bins.
 Reduced chi-squared = 1.07772
# Null hypothesis probability of 3.20e-01 with 57 degrees of freedom

Photon flux (15-150 keV)    in 1 sec: 1.86961 ( -0.39357  0.39439 ) ph/cm2/s
Energy fluence (15-150 keV)             : 1.33712e-07 ( -3.02526e-08  3.05322e-08 ) ergs/cm2
Cutoff power-law model

Time interval is from   14.812 sec. to   15.812 sec.
Spectral model in the cutoff power-law:
------------------------------------------------------------
Parameters  : value       lower 90%   higher 90%
Photon index: -0.160401     ( -2.24534   1.47259 )
Epeak [keV] : 62.6202      ( -14.4123 50.5044 )
Norm@50keV  : 0.109674    ( -0.109764   1.08715 )
------------------------------------------------------------
#Fit statistic  : Chi-Squared                   56.80     using 59 bins.
 Reduced chi-squared = 1.01429
# Null hypothesis probability of 4.45e-01 with 56 degrees of freedom

Photon flux (15-150 keV)    in 1 sec: 1.79118 ( -0.40895  0.40556 ) ph/cm2/s
Energy fluence (15-150 keV)             : 1.28905e-07 ( -3.02225e-08  3.12056e-08 ) ergs/cm2
Band function

Time interval is from   14.812 sec. to   15.812 sec.


Spectral model in the Band function:
------------------------------------------------------------
Parameters  : value       lower 90%   higher 90%
alpha       :    (     )
beta        :     (     )
Epeak [keV] :       (   )
Norm@50keV   :     (     )
------------------------------------------------------------

Photon flux (15-150 keV)    in  sec:  (    ) ph/cm2/s
Energy fluence (15-150 keV)             : 0 ( 0  0 ) ergs/cm2
Single BB

Spectral model blackbody:
------------------------------------------------------------
Parameters  : value    Lower 90%  Upper 90%
kT [keV]    : 15.1155  (-2.81319  3.43397)
R^2/D10^2   : 0.224132  (-0.118197   0.241733)
(R is the radius in km and D10 is the distance to the source in units of 10 kpc)
------------------------------------------------------------
#Fit statistic  : Chi-Squared                   57.82     using 59 bins.
 Reduced chi-squared =
# Null hypothesis probability of 4.45e-01 with 57 degrees of freedom

Energy  Fluence     90% Error
[keV]   [erg/cm2]   [erg/cm2]
15- 25  1.071e-08   3.973e-09
25- 50  4.284e-08   1.570e-08
50-150  6.685e-08   2.865e-08
15-150  1.204e-07   3.771e-08
Thermal bremsstrahlung (OTTB)

Spectral model: thermal bremsstrahlung
------------------------------------------------------------
Parameters  : value         Lower 90%    Upper 90%
kT [keV]    : 149.501       (-74.6081      -147.339)
Norm        : 7.90012       (-1.73494     2.20888)
------------------------------------------------------------
#Fit statistic  : Chi-Squared                   59.41     using 59 bins.
 Reduced chi-squared =
# Null hypothesis probability of 3.88e-01 with 57 degrees of freedom

Energy  Fluence     90% Error
[keV]   [erg/cm2]   [erg/cm2]
15- 25  2.030e-08   1.149e-08
25- 50  3.760e-08   2.114e-08
50-150  7.412e-08   4.555e-08
15-150  1.320e-07   7.830e-08
Double BB

Spectral model: bbodyrad<1> + bbodyrad<2>
------------------------------------------------------------
Parameters  : value         Lower 90%    Upper 90%
kT1 [keV]   : 3.07618        (-3.08218      12.9521)
R1^2/D10^2  : 39.0559        (-38.6715      505.772)
kT2 [keV]   : 16.5097        (-3.36772      -16.5134)
R2^2/D10^2  : 0.154411    (-0.154267   0.205223)
------------------------------------------------------------
#Fit statistic  : Chi-Squared                   55.34     using 59 bins.
 Reduced chi-squared =
# Null hypothesis probability of 4.62e-01 with 55 degrees of freedom

Energy  Fluence     90% Error
[keV]   [erg/cm2]   [erg/cm2]
15- 25  1.716e-08   8.850e-09
25- 50  3.867e-08   2.018e-08
50-150  7.193e-08   3.938e-08
15-150  1.277e-07   6.614e-08
Pre-slew spectrum (Pre-slew PHA with pre-slew DRM)
Power-law model

Spectral model in power-law:
------------------------------------------------------------
Parameters  : value       lower 90%   higher 90%
Photon index: 1.85637     ( -0.175494   0.182555 )
Norm@50keV  : 3.41335E-03    ( -0.000407733   0.000400489 )
------------------------------------------------------------
#Fit statistic  : Chi-Squared                   61.39     using 59 bins.
 Reduced chi-squared =
# Null hypothesis probability of 3.22e-01 with 57 degrees of freedom

Photon flux (15-150 keV)    in 53.36 sec: 0.481029 ( -0.0489599  0.0489782 ) ph/cm2/s
Energy fluence (15-150 keV)             : 1.67459e-06 ( -1.98126e-07  2.01172e-07 ) ergs/cm2
Cutoff power-law model

Spectral model in the cutoff power-law:
------------------------------------------------------------
Parameters  : value       lower 90%   higher 90%
Photon index: 1.18432     ( -0.840871   0.699249 )
Epeak [keV] : 52.6424      ( -13.8972 -52.6424 )
Norm@50keV  : 8.18552E-03    ( -0.00482352   0.0161387 )
------------------------------------------------------------
#Fit statistic  : Chi-Squared                   58.73     using 59 bins.
 Reduced chi-squared =
# Null hypothesis probability of 3.76e-01 with 56 degrees of freedom

Photon flux (15-150 keV)    in 53.36 sec: 0.470436 ( -0.050194  0.050188 ) ph/cm2/s
Energy fluence (15-150 keV)             : 1.57596e-06 ( -2.1693e-07  2.24752e-07 ) ergs/cm2
Band function

Spectral model in the Band function:
------------------------------------------------------------
Parameters  : value       lower 90%   higher 90%
alpha       :    (     )
beta        :     (     )
Epeak [keV] :       (   )
Norm@50keV   :     (     )
------------------------------------------------------------

Photon flux (15-150 keV)    in  sec:  (    ) ph/cm2/s
Energy fluence (15-150 keV)             : 0 ( 0  0 ) ergs/cm2
S(25-50 keV) vs. S(50-100 keV) plot

S(25-50 keV)  = 4.81e-07
S(50-100 keV) = 5.32e-07
T90 vs. Hardness ratio plot

T90                                   = 50.5600000619888 sec.
Hardness ratio (energy fluence ratio) = 1.10603
Color vs. Color plot

Count Ratio  (25-50 keV) / (15-25 keV) = 1.11929
Count Ratio (50-100 keV) / (15-25 keV) = 0.683347
Mask shadow pattern

IMX = 5.955234194774257E-02, IMY = -6.401537666098231E-01
TIME vs. PHA plot around the trigger time

TIME vs. DetID plot around the trigger time

100 us light curve (15-350 keV)

Spacecraft aspect plot

Bright source in the pre-burst/pre-slew/post-slew images
Pre-burst image of 15-350 keV band
Time interval of the image:
-239.000000 14.792000

# RAcent  DECcent POSerr Theta    Phi  PeakCts   SNR AngSep     Name
#  [deg]    [deg]    ['] [deg]  [deg]                   [']
135.5668 -40.5058    2.9  47.4  140.9   4.1817   3.9    3.4	Vela X-1
170.5129 -60.6628    5.7  50.4 -180.0   1.5475   2.0    6.3	Cen X-3
186.7783 -62.8738    6.5  53.9 -170.8   1.4116   1.8    7.0	GX 301-2
 92.8726 -58.4995    2.6  15.6  152.5   1.2586   4.5 ------	UNKNOWN
190.1925 -69.9340    3.1  49.1 -163.9   2.2299   3.7 ------	UNKNOWN
 22.9487  -9.7462    2.6  56.0  -14.9   4.2167   4.5 ------	UNKNOWN
 19.6298  -7.8781    2.5  59.2  -17.3   7.5161   4.6 ------	UNKNOWN
  9.9380 -26.5632    2.6  48.6  -39.7   3.8443   4.3 ------	UNKNOWN
Pre-slew background subtracted image of 15-350 keV band
Time interval of the image:
14.792000 68.152000

# RAcent  DECcent POSerr Theta    Phi  PeakCts   SNR AngSep     Name
#  [deg]    [deg]    ['] [deg]  [deg]                   [']
135.5805 -40.5539    3.0  47.4  141.0  -1.8738  -3.8    2.4	Vela X-1
170.4691 -60.5455   10.1  50.5  179.9  -0.3032  -1.1    6.5	Cen X-3
186.8055 -62.7570   18.2  54.0 -170.9  -0.1791  -0.6    4.2	GX 301-2
 91.5906 -28.4028    0.8  32.7   84.7   3.1573  14.6 ------	UNKNOWN
Post-slew image of 15-350 keV band
Time interval of the image:
141.300590 963.087500

# RAcent  DECcent POSerr Theta    Phi  PeakCts   SNR AngSep     Name
#  [deg]    [deg]    ['] [deg]  [deg]                   [']
135.5274 -40.5537    3.5  37.8  178.7   3.6719   3.3    0.1	Vela X-1
106.4721   8.4745    3.5  39.6   81.7   8.8685   3.3 ------	UNKNOWN
 91.5732  -1.2244    3.7  27.2   58.2   2.9170   3.1 ------	UNKNOWN
 49.4151 -10.3226    3.2  43.4  -15.8   4.5472   3.7 ------	UNKNOWN
 35.2226  -3.1199    3.0  59.2  -17.3  17.7075   3.8 ------	UNKNOWN
 36.7685 -11.2876    2.8  53.8  -24.9  13.1931   4.1 ------	UNKNOWN
138.9154 -70.6369    3.1  49.7 -140.5   8.8821   3.7 ------	UNKNOWN
158.0034 -69.1752    2.9  55.3 -145.2  16.7661   4.0 ------	UNKNOWN
Plot creation:
Mon Oct 24 05:09:43 EDT 2022